Copyright © 2014 IJECCE, All right reserved 303
International Journal of Electronics Communication and Computer Engineering Volume 5, Issue 2, ISSN (Online): 2249–071X, ISSN (Print): 2278–4209
Reliable Distribution Feeder Reconfiguration
Containing Distributed Generation using Particle
Swarm Optimization Algorithm
I. Moradi
Department of Electrical Engineering, Science and Research Branch, Islamic
Azad University, Bushehr, Iran
R. Mohammadi
Department of Electrical & ComputerEngineering, Abbaspour College of Technology, Shahid Beheshti University,
Tehran, Iran
S. M. Musavi
Department of Electrical Engineering, Science and Research Branch, Islamic
Azad University, Bushehr, Iran
Abstract–Distributed feeder reconfiguration (DFR) is an operation processand a very important methodfor saving electrical energy and loss reduction in distribution systems. This process is carried out by changingdistribution system topology by opening and/or closing of circuit breakers. Status of the circuit breakers is optimally determined to have an improved system operation and reduced power losses. This paper proposes a multi-objective evolutionary method for distribution feeder reconfiguration. The multi-objectives optimization minimizes power losses and improves reliability of the system. For this purpose a particle swarm optimization algorithm is used for solving the problem. Simulation results show the efficiency of the proposed method for DFR.
Keywords – Feeder Reconfiguration, Distributed Generation, PSO Algorithm, Distribution System, Multi-Objective Optimization.
I. I
NTRODUCTIONIn the distribution system with radial structure, the configuration can be changedto achieve a new radial structure to reduce power loss, to improve system reliability and to enhance power quality. Radial distribution networks have someadvantages in compare with ring networks. For example, they have a lower rate of short circuit currents and the number of protective and switching equipment is smaller.
In recent years, considerable researches have been conducted for loss minimization in the distribution network by DFR method. In 1975, [1] have introduced the DFR for minimizing active power losses using DC load flow solution. Reference [2] presented the use of the radial distribution power flow method to determine radial configuration with minimum active power losses. , in 1988, [3] hasintroduceda method based on heuristic algorithm to determine the radial configuration of distribution networks, whichfinally has minimal active power losses. Furthermore, And in other researches, DFR is solved by evolutionary algorithms such as: simulated annealing [4], evolutionary programming (EP)[5]–[7], and fuzzy logic [8].
In [9], the authors presented an objective functions for distribution expansion planning which is combination of cost of energy not supplied (ENS), cost of active power losses and maintenance cost. [10] has discussed the ENS for distribution networks. In [11], a fuzzy logic has been used for minimizing ENS. Recently, in addition to ENS, optimal location for sectionalizing switches is evaluated for minimizing ENS [12-13].
In this paper, DFR problem is solved by PSO algorithm, the objective function in this problem is consist of active power losses and reliability index (ENS). In addition, Bus-Branch incidence matrix [14] is used for checking the radial structure of distribution systems.
The remainder of this paper is conducted as follows: Section II presents the mathematical formulation of the DFR problem including objective functions of the problem. In this formulation, radial structure of distribution network is checked and constraints of the DFR problem are examined to be verified. Next section is devoted to present the numerical results. A distribution system with 33 buses is used as a test system to verify the applicability and validity of the proposed approach. Finally, conclusion of the paper is drawn in Section IV.
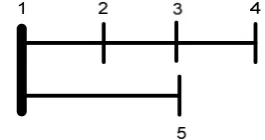
Fig. 1. Simple radial distribution network
II. P
ROBLEMF
ORMULATIONIn the DRF problem, there are many different objectives. In this paper, loss minimization and improving the reliability have been considered as the objectives andthe remaining ones mentioned above are considered as the constraints. The DFR problem is explained as:
A. Objective functions
The first objective is to minimize the total active power losses, which can be modeled as:
B. Minimizing active power losses
2
1 ( )
b rc h N
L o s s k k k
P X R I
1 L o s s F P
(1) Here, the decision variable is:
1 2 1 2
[ ... n ... k]
X SW SW SW P P P (2)
Copyright © 2014 IJECCE, All right reserved
C. Minimizing energy not supplied
Most power outages are caused by faults in the transmission and distribution systems. Accordingly, the distribution feeder reconfiguration problem should be carried out to optimize a reliability index such as minimization of ENS as follows [15]:
1
'
, ,
1
( )
bus
bus
N j
j
N
j j i j i
j i V i j
ENS X ENS
P U U
(3)
, j i
U
andU'j i, are calculated as follow:, , ,
' '
, , ,
j i j i j i
j i j i j i
U t
U t
(4)
where,
N
bust and t jP are number of buses and active power demand of bus #j.
V
is a set of branches which are Related to bus #j (upstream and downstream branches)., j i
U
andU'j i, are reparation and restoration times (h/year) of ithbranch which is a member of the set V .
j i, ,t
j i, and t'j i, are rate of faults inithbranch, average reparation and restoration time (h), respectively.In this paper, ENS index is evaluated by spanning of tree in graph theory method. This index can be used for the calculation of ENS with and without presence of DG (which is modeled by negative load) in distribution systems [16-17]. For instant, a simple distribution network is shown in Fig.1 which is used as an example. The ENS3 is determined by all failure situations that lead to prevent Bus 3 to receive energy. For example, if there is a fault in branch1-2or branch2-3, after the average reparation time t1-2 or t2-3the energy supply will be returned to the Bus 3; or if there is a fault in branch3-4 after the average restoration time t'3-4, the energy will be returned to the Bus 3. So, the energy-not-supplied can be evaluated as follows:
' 3 3 ( 1,2 2,3 3,4)
ENS P U U U (5)
D. Constraint and limits
The DFR problem is subject to the following constraints:
Voltage limits of buses
min max
j j j
v v v (6)
Where, v ,j vminj and max j
v , are the magnitude, minimum and maximum value of voltage at bus j.
Active power flowing through feeders and branches
max
k k
PF PF (7)
Where, PF andk max
k
PF , are the flowing active power of branch k and its maximum allowable value.
Power output of distributed generation max
dg dg
P P (8)
Where, P anddg Pdgmax, are the power output of dg th
distribution generation and its maximum capacity. Radial structure of the distribution network
The structure of distribution system should be radial due to the simpler protection schemes of distribution networks. For this purpose, branch-bus incidence matrix is used for checking radial structure of networks. The branch-bus incidence matrix of A is a Nbranch× Nbusmatrix wherein the kthrow of the matrix corresponds to the kthbranch in the network and the jthcolumn of the matrix corresponds to the jth bus in the system which has a branch leaving the bus. Incidence matrices are mostly used in graph theory [18]. The method for calculation of the branch-bus incidence matrix is as follows:
- If the kthbranch (corresponding to kthrow) leaves from jth bus (corresponding to jth column) then the matrix element (akj) is equal to 1.
- If the kthbranch (corresponding to kthrow) enters toward jth bus (corresponding to jth column) then the matrix element (akj) will be -1.
- All remaining entries will be identically zero.
- While the number of buses is one more than the number of branches in the radial distribution networks, the first column of branch-bus incidence matrix A should be deleted to have a square matrix A'.
- If the determinant of branch-bus incidence matrix A' is 1 or -1, the network’s graph will be radial.
For example, the Bus-branch incidence matrix for the simple distribution network which is shown in Fig.1 can be evaluated as follows:
1 2
2 3
3 4
1 5
2 3 4 5
1 0 0 0
1 1 0 0
0 1 1 0
0 0 0 1
bus bus bus bus
l l A
l l
(9)
det( )A 1 (10)
A determinant of A is equal 1, so the simple radial network is radial (it is clear that form Fig. 1).
Fig.2. Single line diagram of 33-bus test distribution network
III. P
ARTICLES
WARMO
PTIMIZATIONA
LGORITHMThe particle swarm optimization (PSO) algorithm was
first proposed by “Eberhart” and “Kennedy”[19], and has
Copyright © 2014 IJECCE, All right reserved 305
International Journal of Electronics Communication and Computer Engineering Volume 5, Issue 2, ISSN (Online): 2249–071X, ISSN (Print): 2278–4209
the global optimization field. The mainidea of the PSO is the mathematical modeling and simulation ofthe food searching activities of a flock of birds in the multidimensional Space. And detailed data could be obtained from [19].
IV. S
IMULATIONR
ESULTSResults from a test case based on the 33-bus distribution test system [19] are presented in this section. This system consists of 33 buses, 32 lines, 2 feeders and 12.66kV substation with capacity of 2600kW. The more detail data about this network can be obtained from [19]. The schematic of this network is shown in Fig. 2. DG units has been considered as negative load with the capacity of 300kW (2 micro turbines installed in bus#8 and bus#25) with variable power factor. The distribution load flow
formulation for radial distribution systems [20] has been used in the proposed approach.
The results for all cases are tabulated in table 1. The optimal values of power loss and ENS for before reconfiguration, after reconfiguration without DG units and after reconfiguration with present of DG units are presence in this table. These results has been obtained using PSO algorithm. It is clear that considering the DG in DFR provides better performance of distribution networks by improving power loss and ENS values.
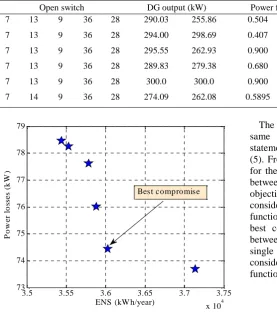
Furthermore, this paper uses the optimal Pareto fronts for obtained set of non-dominated solution. In this method the power loss and ENS have been minimized, simultaneously and that a Decision maker has several selections for selecting a compromised scheme. Table 2 and figure 3 show the set of non-dominated solution which are obtained using PSO algorithm.
Table I. Objective function values and the decision variables in all cases Power losses
(kW)
ENS
(kWh/year) Open switches
DG units power generation (kW)
DG units power factor
Before reconfiguration 202.6858 42538 S33 S34 S35 S36 S37 –
–
– –
After reconfiguration without DG units
139.5542 46984 S7 S14 S9 S32 S37 – –
144.5919 42477 S7 S9 S13 S28 S36 – –
After reconfiguration considering DG units
69.5875 38132 S7 S14 S9 S32 S28 DG8=300 DG25=300
PF8=0.55 PF25=0.22
160.9694 35439 S6 S13 S9 S36 S25 DG8=300 DG25=300
PF8=-0.78 PF25=-0.44
Table II: Set of non-dominated obtained using PSO algorithm
Open switch DG output (kW) Power factor ENS (kWh/year) Power losses (kW)
7 13 9 36 28 290.03 255.86 0.504 0.212 36031.02 74.442
7 13 9 36 28 294.00 298.69 0.407 0.352 35530.26 78.253
7 13 9 36 28 295.55 262.93 0.900 0.174 35885.19 76.0
7 13 9 36 28 289.83 279.38 0.680 0.311 35786.93 77.608
7 13 9 36 28 300.0 300.0 0.900 0.337 35438.80 78.449
7 14 9 36 28 274.09 262.08 0.5895 0.206 37136.78 73.681
Fig.3. Pareto fronts for power loss & ENS
The best compromised solution in the case assuming the same importance for the objective functions. This statement can be assessed in the results of the Figs. (4) and (5). From these figures it can be seen that the power loss for the best compromised solution is 74.44 kW which is between 69.58 kW and 160.9694 kW related to single objective DFR optimization problem in the case of considering power loss and ENS as separate objective functions, respectively. Similarly, the total ENS for the best compromised solution is 36031.02 kWh/yr. It is between 35439 kWh/yr and 38132 kWh/yr which relate to single objective DFR optimization problem in the case of considering power loss and ENS as separate objective functions, respectively.
3.5 3.55 3.6 3.65 3.7 3.75
x 104 73
74 75 76 77 78 79
ENS (kW h/year)
P
o
w
e
r
lo
ss
e
s
(k
W
)
Copyright © 2014 IJECCE, All right reserved Fig.4. Comparing power loss value of best compromised
solution with the power loss value of optimum solutions for power loss and ENS objectives
Fig.5. Comparing ENS value of best compromised solution with the ENS value of optimum solutions for
power loss and ENS objectives
V. C
ONCLUSIONTo enhance reliability performance of the distribution networks in the DFR operating phase, the distribution operators are inevitable to include reliability indices (here, ENS) in the DFR problem. The PSO algorithm yields optimal Pareto solutions taking into account different objectives functions (including power loss function and ENS) in the form of Pareto set which represents the tradeoff between the objectives. In addition, according to the results, we realized the importance of DG in distribution networks is high, consideration of DG in DFR problem, leads to decrease in ENS, and power loss.
R
EFERENCES[1] Merlin A., H. Back, Search for a minimal-lossoperating spanning tree configuration in an urbanpower distribution system, in Proc. 5th Power SystemComputation Conf., Cambridge, U.K., 1–18. (1975).
[2] D Shirmohammadi., H. W. Hong,Reconfiguration of electric distribution networks forresistive line loss reduction, IEEE Trans. Power Syst.,4(1): 1492–1498, (1989).
[3] Civanlar S., J. J. Grainger, H. Yin, and S. S.H. Lee,Distribution feeder reconfiguration for lossreduction, IEEE Trans. Power Del.,.3(3): 1217–1223,(1988).
[4] H. C. Chang and C. C. Kuo, “Network reconfiguration in
distribution system using simulated annealing,” Elect. Power
Syst. Res., vol. 29, pp. 227–238, 1994.
[5] M. Kitayama and K. Matsumoto, “An optimization method for
distribution system configuration based on genetic algorithm,” in
Proc. Inst. Elect.Eng. Int. Conf. Advances in Power Syst. Contr. Oper.Manage., 1995, pp. 614–619.
[6] Y. H. Song, G. S. Wang, A. T. Johns, and P. Y. Wang,
“Distribution network reconfiguration for loss reduction using fuzzy controlled evolutionary programming,” Proc. Inst. Elect.
Eng., Gen. Transm. Dist., vol. 144, no. 4, pp. 345–350, July 1997.
[7] W. M. Lin, F. S. Cheng, and M. T. Tsay, “Feeder loss reduction
by switching operations with a hybrid programming technique,”
in Proc. IEEE Transm. Dist. Conf., vol. 2, 1999, pp. 603–608.
[8] Q. Zhou, D. Shirmohammadi, and W. H. E. Liu, “Distribution
feeder reconfiguration for service restoration and load
balancing,” IEEE Trans. Power Syst., vol. 12, pp. 724–729, May
1997.
[9] W.-M. Lin, C.-D.Yang, and M.-T.Tsay, “Distribution system
planningwith evolutionary programming and a reliability cost model,” Proc.Inst. Elect. Eng., vol. 147, no. 6, pp. 336–341, Nov. 2000.
[10] M. Vega, H. Sarmiento, and L. Matías, “Reconfiguring a
primary industrialnetwork based on reliability studies,” inProc.
Ind. Appl. Conf.,2002, pp. 1095–1099.
[11] D. Popovic and Z.Popovic, “A risk management procedure for
supplyrestoration in distribution networks,”IEEE Trans. Power
Syst., vol. 19,no. 1, pp. 221–228, Feb. 2004.
[12] L. García, H. Opazo, and E. López, “Switches optimum location
inmedium voltage network via minimization of energy not
supplied,” inProc. CONIELECOMP, 2006, p. 44.
[13] A. Cárcamo-Gallardo, L. García-Santander, and J. E. Pezoa,
“Reconfigurationof medium voltage networks based on prim’s
algorithm,”Ing., RevistaChilena De Ingeniería, vol. 15, no. 1, pp.
83–91, 2007.
[14] AbdelazizA.Y., Mohammed F.M., Mekhamer S.F., Badr
M.A.L.:‘Distribution Systems Reconfiguration using a modified
particle swarm optimization algorithm’,Electric Power Systems Research, 2001, 79, (11), pp. 1521-1530
[15] AngelyCarcamo-Gallardo, Luis Garcia-Santander, Jorge E. Pezoa, Greedy Reconfiguration Algorithms for Medium-Voltage Distribution Networks. IEEE TRANSACTIONS ON POWER DELIVERY, 2009. 24(1), pp. 328-337.
[16] Billinton R, N. Allan R. Reliability Evaluation of Power Systems. 2th ed. New York and London: 1996. Reference to a chapter in an edited book.
[17] Khalesi N, Rezaei N, Haghifam M. R. DG allocation with application of dynamic programming for loss reduction and reliability improvement. Electrical Power and Energy Syst 2011; 33(2): 288-95.
[18] AbdelazizA.Y., Mohammed F.M., MekhamerS.F.,BadrM.A.L.:
‘Distribution Systems Reconfiguration using a modified particle swarm optimization algorithm’,Electric Power Systems Research, 2001, 79, (11), pp. 1521-1530.
[19] Kennedy J, Eberhart R. Particle swarm optimization. IEEE IntConf NeuralNetworks 1995;4:1942–8 [Piscataway, NJ].
[20] Baran ME., Wu FF.:‘Network reconfiguration in distribution
systems for loss reduction and load balancing’, IEEE Trans
Power Deliv. 1989, 4, (2), pp. 1401–1407.
A
UTHOR’
SP
ROFILEIman Moradi
was born in 1985 in Kazerun, Iran. He received the B.S. degree in electrical engineering from Azad Islamic University, Kazerun in 2009 and M.S degree in electrical engineering from Science and Research Branch, Azad Islamic University, Bushehr, Iran in 2013. From 2009, he is a Lecturer at Azad Islamic University, Kazerun. His research interests include power system studies and intelligent methods.
0 50 100 150 200
1 2 3
Power losses (kW)
34000 36000 38000 40000
1 2 3
ENS (kWh/year)
Copyright © 2014 IJECCE, All right reserved Fig.4. Comparing power loss value of best compromised
solution with the power loss value of optimum solutions for power loss and ENS objectives
Fig.5. Comparing ENS value of best compromised solution with the ENS value of optimum solutions for
power loss and ENS objectives
V. C
ONCLUSIONTo enhance reliability performance of the distribution networks in the DFR operating phase, the distribution operators are inevitable to include reliability indices (here, ENS) in the DFR problem. The PSO algorithm yields optimal Pareto solutions taking into account different objectives functions (including power loss function and ENS) in the form of Pareto set which represents the tradeoff between the objectives. In addition, according to the results, we realized the importance of DG in distribution networks is high, consideration of DG in DFR problem, leads to decrease in ENS, and power loss.
R
EFERENCES[1] Merlin A., H. Back, Search for a minimal-lossoperating spanning tree configuration in an urbanpower distribution system, in Proc. 5th Power SystemComputation Conf., Cambridge, U.K., 1–18. (1975).
[2] D Shirmohammadi., H. W. Hong,Reconfiguration of electric distribution networks forresistive line loss reduction, IEEE Trans. Power Syst.,4(1): 1492–1498, (1989).
[3] Civanlar S., J. J. Grainger, H. Yin, and S. S.H. Lee,Distribution feeder reconfiguration for lossreduction, IEEE Trans. Power Del.,.3(3): 1217–1223,(1988).
[4] H. C. Chang and C. C. Kuo, “Network reconfiguration in
distribution system using simulated annealing,” Elect. Power
Syst. Res., vol. 29, pp. 227–238, 1994.
[5] M. Kitayama and K. Matsumoto, “An optimization method for
distribution system configuration based on genetic algorithm,” in
Proc. Inst. Elect.Eng. Int. Conf. Advances in Power Syst. Contr. Oper.Manage., 1995, pp. 614–619.
[6] Y. H. Song, G. S. Wang, A. T. Johns, and P. Y. Wang,
“Distribution network reconfiguration for loss reduction using fuzzy controlled evolutionary programming,” Proc. Inst. Elect.
Eng., Gen. Transm. Dist., vol. 144, no. 4, pp. 345–350, July 1997.
[7] W. M. Lin, F. S. Cheng, and M. T. Tsay, “Feeder loss reduction
by switching operations with a hybrid programming technique,”
in Proc. IEEE Transm. Dist. Conf., vol. 2, 1999, pp. 603–608.
[8] Q. Zhou, D. Shirmohammadi, and W. H. E. Liu, “Distribution
feeder reconfiguration for service restoration and load
balancing,” IEEE Trans. Power Syst., vol. 12, pp. 724–729, May
1997.
[9] W.-M. Lin, C.-D.Yang, and M.-T.Tsay, “Distribution system
planningwith evolutionary programming and a reliability cost model,” Proc.Inst. Elect. Eng., vol. 147, no. 6, pp. 336–341, Nov. 2000.
[10] M. Vega, H. Sarmiento, and L. Matías, “Reconfiguring a
primary industrialnetwork based on reliability studies,” inProc.
Ind. Appl. Conf.,2002, pp. 1095–1099.
[11] D. Popovic and Z.Popovic, “A risk management procedure for
supplyrestoration in distribution networks,”IEEE Trans. Power
Syst., vol. 19,no. 1, pp. 221–228, Feb. 2004.
[12] L. García, H. Opazo, and E. López, “Switches optimum location
inmedium voltage network via minimization of energy not
supplied,” inProc. CONIELECOMP, 2006, p. 44.
[13] A. Cárcamo-Gallardo, L. García-Santander, and J. E. Pezoa,
“Reconfigurationof medium voltage networks based on prim’s
algorithm,”Ing., RevistaChilena De Ingeniería, vol. 15, no. 1, pp.
83–91, 2007.
[14] AbdelazizA.Y., Mohammed F.M., Mekhamer S.F., Badr
M.A.L.:‘Distribution Systems Reconfiguration using a modified
particle swarm optimization algorithm’,Electric Power Systems Research, 2001, 79, (11), pp. 1521-1530
[15] AngelyCarcamo-Gallardo, Luis Garcia-Santander, Jorge E. Pezoa, Greedy Reconfiguration Algorithms for Medium-Voltage Distribution Networks. IEEE TRANSACTIONS ON POWER DELIVERY, 2009. 24(1), pp. 328-337.
[16] Billinton R, N. Allan R. Reliability Evaluation of Power Systems. 2th ed. New York and London: 1996. Reference to a chapter in an edited book.
[17] Khalesi N, Rezaei N, Haghifam M. R. DG allocation with application of dynamic programming for loss reduction and reliability improvement. Electrical Power and Energy Syst 2011; 33(2): 288-95.
[18] AbdelazizA.Y., Mohammed F.M., MekhamerS.F.,BadrM.A.L.:
‘Distribution Systems Reconfiguration using a modified particle swarm optimization algorithm’,Electric Power Systems Research, 2001, 79, (11), pp. 1521-1530.
[19] Kennedy J, Eberhart R. Particle swarm optimization. IEEE IntConf NeuralNetworks 1995;4:1942–8 [Piscataway, NJ].
[20] Baran ME., Wu FF.:‘Network reconfiguration in distribution
systems for loss reduction and load balancing’, IEEE Trans
Power Deliv. 1989, 4, (2), pp. 1401–1407.
A
UTHOR’
SP
ROFILEIman Moradi
was born in 1985 in Kazerun, Iran. He received the B.S. degree in electrical engineering from Azad Islamic University, Kazerun in 2009 and M.S degree in electrical engineering from Science and Research Branch, Azad Islamic University, Bushehr, Iran in 2013. From 2009, he is a Lecturer at Azad Islamic University, Kazerun. His research interests include power system studies and intelligent methods.
3
3
Copyright © 2014 IJECCE, All right reserved Fig.4. Comparing power loss value of best compromised
solution with the power loss value of optimum solutions for power loss and ENS objectives
Fig.5. Comparing ENS value of best compromised solution with the ENS value of optimum solutions for
power loss and ENS objectives
V. C
ONCLUSIONTo enhance reliability performance of the distribution networks in the DFR operating phase, the distribution operators are inevitable to include reliability indices (here, ENS) in the DFR problem. The PSO algorithm yields optimal Pareto solutions taking into account different objectives functions (including power loss function and ENS) in the form of Pareto set which represents the tradeoff between the objectives. In addition, according to the results, we realized the importance of DG in distribution networks is high, consideration of DG in DFR problem, leads to decrease in ENS, and power loss.
R
EFERENCES[1] Merlin A., H. Back, Search for a minimal-lossoperating spanning tree configuration in an urbanpower distribution system, in Proc. 5th Power SystemComputation Conf., Cambridge, U.K., 1–18. (1975).
[2] D Shirmohammadi., H. W. Hong,Reconfiguration of electric distribution networks forresistive line loss reduction, IEEE Trans. Power Syst.,4(1): 1492–1498, (1989).
[3] Civanlar S., J. J. Grainger, H. Yin, and S. S.H. Lee,Distribution feeder reconfiguration for lossreduction, IEEE Trans. Power Del.,.3(3): 1217–1223,(1988).
[4] H. C. Chang and C. C. Kuo, “Network reconfiguration in
distribution system using simulated annealing,” Elect. Power
Syst. Res., vol. 29, pp. 227–238, 1994.
[5] M. Kitayama and K. Matsumoto, “An optimization method for
distribution system configuration based on genetic algorithm,” in
Proc. Inst. Elect.Eng. Int. Conf. Advances in Power Syst. Contr. Oper.Manage., 1995, pp. 614–619.
[6] Y. H. Song, G. S. Wang, A. T. Johns, and P. Y. Wang,
“Distribution network reconfiguration for loss reduction using fuzzy controlled evolutionary programming,” Proc. Inst. Elect.
Eng., Gen. Transm. Dist., vol. 144, no. 4, pp. 345–350, July 1997.
[7] W. M. Lin, F. S. Cheng, and M. T. Tsay, “Feeder loss reduction
by switching operations with a hybrid programming technique,”
in Proc. IEEE Transm. Dist. Conf., vol. 2, 1999, pp. 603–608.
[8] Q. Zhou, D. Shirmohammadi, and W. H. E. Liu, “Distribution
feeder reconfiguration for service restoration and load
balancing,” IEEE Trans. Power Syst., vol. 12, pp. 724–729, May
1997.
[9] W.-M. Lin, C.-D.Yang, and M.-T.Tsay, “Distribution system
planningwith evolutionary programming and a reliability cost model,” Proc.Inst. Elect. Eng., vol. 147, no. 6, pp. 336–341, Nov. 2000.
[10] M. Vega, H. Sarmiento, and L. Matías, “Reconfiguring a
primary industrialnetwork based on reliability studies,” inProc.
Ind. Appl. Conf.,2002, pp. 1095–1099.
[11] D. Popovic and Z.Popovic, “A risk management procedure for
supplyrestoration in distribution networks,”IEEE Trans. Power
Syst., vol. 19,no. 1, pp. 221–228, Feb. 2004.
[12] L. García, H. Opazo, and E. López, “Switches optimum location
inmedium voltage network via minimization of energy not
supplied,” inProc. CONIELECOMP, 2006, p. 44.
[13] A. Cárcamo-Gallardo, L. García-Santander, and J. E. Pezoa,
“Reconfigurationof medium voltage networks based on prim’s
algorithm,”Ing., RevistaChilena De Ingeniería, vol. 15, no. 1, pp.
83–91, 2007.
[14] AbdelazizA.Y., Mohammed F.M., Mekhamer S.F., Badr
M.A.L.:‘Distribution Systems Reconfiguration using a modified
particle swarm optimization algorithm’,Electric Power Systems Research, 2001, 79, (11), pp. 1521-1530
[15] AngelyCarcamo-Gallardo, Luis Garcia-Santander, Jorge E. Pezoa, Greedy Reconfiguration Algorithms for Medium-Voltage Distribution Networks. IEEE TRANSACTIONS ON POWER DELIVERY, 2009. 24(1), pp. 328-337.
[16] Billinton R, N. Allan R. Reliability Evaluation of Power Systems. 2th ed. New York and London: 1996. Reference to a chapter in an edited book.
[17] Khalesi N, Rezaei N, Haghifam M. R. DG allocation with application of dynamic programming for loss reduction and reliability improvement. Electrical Power and Energy Syst 2011; 33(2): 288-95.
[18] AbdelazizA.Y., Mohammed F.M., MekhamerS.F.,BadrM.A.L.:
‘Distribution Systems Reconfiguration using a modified particle swarm optimization algorithm’,Electric Power Systems Research, 2001, 79, (11), pp. 1521-1530.
[19] Kennedy J, Eberhart R. Particle swarm optimization. IEEE IntConf NeuralNetworks 1995;4:1942–8 [Piscataway, NJ].
[20] Baran ME., Wu FF.:‘Network reconfiguration in distribution
systems for loss reduction and load balancing’, IEEE Trans
Power Deliv. 1989, 4, (2), pp. 1401–1407.
A
UTHOR’
SP
ROFILEIman Moradi
Copyright © 2014 IJECCE, All right reserved 307
International Journal of Electronics Communication and Computer Engineering Volume 5, Issue 2, ISSN (Online): 2249–071X, ISSN (Print): 2278–4209
Reza Mohammadi
was born in 1981 in Tabriz, Iran. He received the B.S. degree in electrical engineering from Iran University of Science and Technology (IUST) in 2004 and M.S. and Ph.D. degree in electrical engineering from Amirkabir University of Technology (AUT) in 2007 and 2011 respectively. Currently, he is an assistant professor of Abbaspour College of Technology, Shahid Beheshti University, Iran, working in the area of the power system protection.His field of interest includes power system protection, power system transient analysis, distributed generation and intelligent methods.