Aleksander E. Makarevich
1, A, c–g, Svetlana S. Lemiasheuskaya
1, A–f,
Aleksander J. Poctavcev
1, A, c, E, f, Aleksander I. Lemeschewskij
2, b–f,
Michail Nedvedz
3, c, E, fThe Dynamics of Respiratory Muscle Changes
During the Progression of Chronic Obstructive
Pulmonary Disease
1 Department of Internal Medicine, belarusian State Medical University, Minsk, belarus 2 Department of general Surgery, belarusian State Medical University, Minsk, belarus 3 Department of Pathologic Anatomy, belarusian State Medical University, Minsk, belarus
A – research concept and design; B – collection and/or assembly of data; C – data analysis and interpretation;
D – writing the article; E – critical revision of the article; F – final approval of article; G – other
Abstract
Background. Pathological changes of the respiratory muscles (RM) during the development of chronic obstructive pulmonary disease (cOPD) have not yet been studied in detail.
Objectives. The aim of the research was to assess RM status in cOPD and the relationship between echodensito-metric and morphological changes in the RM.
Material and Methods. The participants – 152 male cOPD patients – were divided into three groups according to the severity of the disease: cOPD1 (mild), cOPD2 (moderate) and cOPD3 (severe). The status of the accessory RM in these groups was investigated using echodensitometry indices (echogenicity: IE; homogeneity: IH; and structural density: ISD) and the morphological material of the abdominal internal oblique muscle in 25 patients with cOPD1 and cOPD2.
Results. considerable differences among the cOPD groups were revealed. In mild cOPD a tendency toward increased homogeneity was detected (due to RM hypertrophy), while echogenicity results varied. IH and ISD decreased in moderate cOPD, while IE was increased due to RM fatty infiltration and sclerosis (according to the morphological data). In severe cOPD, IH and ISD rose again against a background of IE decrease. The presence of myolysis, sclerotic changes and contractures of myofibrils in the RM was significantly more frequently observed in cOPD1 and cOPD2 compared with the controls (where these features were rare). The sensitivity and specificity of the morphological and ultrasonic methods were similar in assessing atrophic and sclerotic RM changes, while their accuracy was lower in analyzing other morphological signs.
Conclusions. The echodensitometric parameters investigated reflect, in a complex way, different dynamics of degenerative RM processes during the progression of cOPD (Adv Clin Exp Med 2014, 23, 3, 381–394).
Key words: chronic obstructive pulmonary disease, sarcopenia, respiratory muscles, ultrasonic densitometry.
Adv clin Exp Med 2014, 23, 3, 381–394
ISSN 1899–5276
ORIgINAL PAPERS
© copyright by Wroclaw Medical University
Sarcopenia (loss of muscular mass) is one of the processes accompanying advanced age. Sar-copenia is divided into two types: primary, when there are no other reasons for the decrease in cle mass, and secondary, which is the loss of mus-cle mass as a result of some disease [1]. The inci-dence of primary sarcopenia fluctuates from 5% to 13% in persons aged 60–70 years [2]. A decrease in muscle mass is not an isolated process, because it develops simultaneously with fatty mass accu-mulation [3, 4]. There is a tendency to a higher
incidence of fatty infiltration in satellite cells in sarcopenia, the consequence of which is fatty mus-cle infiltration [5].
The latter depends not only on the degree of se-verity of the pulmonary pathology [9, 10] but al-so on extrapulmonary dial-sorders [11, 12]. Decreas-es in RM strength by 15–30% in 20–50% of cOPD patients (depending on the severity of the disease and RM type) have been detected [13]. The loss of muscle strength results predominantly from RM atrophy and rather than a loss of RM contractile properties [14]. In addition, the functioning of the intercostal and sternocleidomastoid muscles is be-lieved to have fewer disadvantages than the dia-phragm in the presence of severe lung hyperinfla-tion [15]. Insufficient RM inspiratory activity leads to hypoventilation, while expiratory RM weakness favors the development of dynamic hyperinflation which increases during exercise [16–18]. These in-creases in RM fatigability and atrophy are con-nected (in a complex manner) with the develop-ment of breathlessness on exertion and limitation of exercise.
Prolonged bronchial obstruction (which in-creases RM workload and oxygen demand) in cOPD has been shown to lead to RM overload and reduction in RM ability to generate maximum re-spiratory effort [19, 20]. RM hypertrophy develops in response to increased RM functional load even in the initial stages of cOPD [19]. Then, during the course of cOPD development, RM strength decreases against the background increase of atro-phic changes. The atrophy of muscles is only par-tially reversible in cOPD patients [13].
The insidious development of flow limitation and hyperinflation in prolonged cOPD enables several structural adaptive mechanisms of muscles to come into play in response to chronic mechan-ical loading to preserve the functional strength of overloaded RM [21–24]. These include a reduc-tion in sarcomere length, an increase in the rela-tive proportion of fatigue resistant fiber types and an increase in mitochondrial concentration, which improves oxidative capacity. Differences in mor-phological changes in damaged myofibrils have been detected in cOPD patients [25]. One of the most common forms of muscular dystrophy is the formation of contractures when myofilaments be-come deregulated and displaced, while myofibrils lose cross-section striation [26]. In addition, re-duced numbers of capillaries per unit of area have also been found in the muscular tissue of cOPD patients [27].
Decreased body weight in cOPD patients is commonly observed with age, primarily at the ex-pense of muscles; the loss of muscle mass is aggra-vated by fatty mass accumulation. fatty muscle in-filtration leads to decreased muscle strength and inadequate functioning. Increasing hypodynam-ia, in turn, stimulates the growth of sarcopenia.
Another mechanism of the decrease in muscle mass is an imbalance (tending toward catabolism) between synthesis and protein degradation. This is caused by suppressed formation of humoral factors that stimulate protein synthesis, with the simulta-neous expression of subclinical inflammation fac-tors (TNf-α, IL-6) and a decline in myocyte apop-tosis [28, 29].
compared with other muscles, RM have rath-er particular charactrath-eristics, due to the necessity of overcoming the elastic properties of the chest. The most important feature of RM is peak effort, in which type II muscle fibers play a more impotent role, whereas the endurance and relative strength are of greater importance for skeletal muscles. The peak expiratory flow rate is a basic RM charac-teristic, but its relationship to sarcopenia has not yet been fully established. In cOPD patients, spiratory RM have to generate more negative in-tra-thoracic pressure than is generally required for adequate alveolar ventilation. This is due to the presence of internal positive pressure at the end of the expiration phase as well as static and dynamic hyperinflation [17, 18].
The development of RM dysfunction in cOPD occurs due to the complex interplay of several fac-tors [7, 27, 30–34]: an increase in pro-inflammato-ry mediators (which plays a key role in the patho-genesis of these changes); decreased nutritional status and anabolic hormone levels; tissue hypox-ia; oxidative stress; reduced capillarity and propor-tion of type II fibers; muscle apoptosis; and the use of oral or inhaled corticoids in high doses. RM are involved in this pathological process with some de-lay [25]. An increase in proinflammatory cytokine levels (IL-1, IL-2, IL-6; TNf-α, interferon-j) circu-lating in the blood flow leads to decreased muscu-lar fiber synthesis. Indeed, TNf-α directly or in-directly promotes the development of a systemic inflammatory process and the proteolysis of myo-sin as well as an increase in catecholamin synthe-sis [35]. In addition, pathological changes in mus-cular fibers combined with decreased transverse section areas of muscle fibers are observed [36]. These RM changes decrease the efficacy of me-chanical muscular effort.
with subsequent morphological and histochemical analysis are used only for scientific purposes. All this emphasizes the importance of developing new noninvasive methods for the dynamic assessment of functional and structural pathological changes of RM in cOPD patients.
The aim of this study was to assess accesso-ry RM status (dystrophic changes) by ultrasonic scanner and to compare them with the histological data from muscle biopsy material from males with different stages of cOPD according to the glob-al Initiative for Obstructive Lung Disease (gOLD) grading system.
Material and Methods
The study was undertaken at the Pulmonolo-gy Department of the 10th Minsk clinical hospi-tal in the years 2009 to 2012. All participants gave their written informed consent. The study proto-col was approved by the Human Studies commit-tee on Research Ethics at the belarusian State Med-ical University. The inclusion criteria for the study were established before the trial and were strict-ly followed: Males aged 50–67 years with differ-ent degrees of severity of cOPD, with fEV1
in-crease < 15% during bronchodilation tests were qualified for the study. Exclusion criteria included substantial uncontrolled comorbidity.
The following accessory RM were studied: – muscles of inspiration: sternocleidomastoid
(ScM), scalenus anterior (SA), and external intercostals (ExI);
– muscles of expiration: abdominal internal oblique (AIO), abdominal external oblique (AEO), rectus abdominis (RA), transver-sus abdominis (TA) and internal intercostals (InI).
A HONDA Electronics HS-2000 ultrason-ic scanner with 7.5 МHz/50 mm and 256 shades of grey color, providing high-quality histograms, was used in the study. The following quantita-tive indices of RM were investigated: homogene-ity (IH, which characterizes the degree of muscle homogeneity); echogenicity (IE, the level of the shade of the grey scale that most often emerged in the outlined zone); structural density (ISD, which permitted a quantitative assessment of muscles of different size) and standard deviation (SD). The technical features of this scanner did not permit in-vestigation of structural changes in the diaphragm (the main respiratory muscle), because of its sub-tlety and deep arrangement.
The study group consisted of 152 cOPD pa-tients (aged 51–67 years) with acute exacerbation (increased wheezing, dyspnea, sputum volume or
sputum purulence one week prior to admission) of varying severity. These patients and a control group consisting of 34 healthy persons of compa-rable age, sex, smoking status and body mass in-dex (bMI) were examined. Special emphasis was placed on the participants’ history of chronic, pro-gressive symptoms such as dyspnea, coughing and wheezing, and on their smoking history. Most of the patients were current smokers or ex-smokers (who had stopped smoking at least 12 months be-fore evaluation); some of them were nonsmokers. The diagnosis of cOPD and its severity was based on the gOLD guidelines. The expressiveness of dyspnea (as an indirect indicator of decreased ex-ercise tolerance) in these cOPD patients was de-fined according to a modified Medical Research council (MRc) questionnaire [39].
The patients were divided into three groups according to the severity of their cOPD, which re-flected the evolution of disease (Table 1). The first group (cOPD1) consisted of 42 patients with mild
cOPD (median age and duration of disease: 55 and 4 years respectively; fEV1: 83%; bMI: 27 kg/m2;
current smokers: 79%, ex-smokers 6%, and non-smokers: 15%). The second group, with mod-erate cOPD (cOPD2), was composed of 80
pa-tients (median age and duration of disease: 57 and 10 years respectively; fEV1: 55%; bMI: 30 kg/m2;
current, ex- and nonsmokers: 78%, 10% and 12% respectively). The third group, with severe cOPD (cOPD3), was made up of 30 patients (median age
and duration of disease: 60 and 13 years respec-tively; fEV1: 33%; bMI: 25 kg/m2; current, ex- and
nonsmokers: 86%, 10% and 4% respectively). As shown in Table 1, the control group (with normal pulmonary function) did not differ from cOPD1 patients in terms of median age, the percent
of patients under 60 years, bMI and intensity of
smoking. compared with the controls, cOPD1
pa-tients only had decreased ventilation parameters. cOPD3 patients a had significantly higher median
age, disease duration, MRc breathlessness index and number of current smokers than the control group and cOPD1,2 patients, while their bMI was
significantly lower than in the cOPD2 group. As
Table 1 shows, a significant increase in the num-ber of exacerbations (which are an important com-ponent of the clinical development of disease) over the past year was found in severe cOPD compared with mild to moderate cOPD.
A progressive decrease in ventilation param-eters was noted as the disease developed: fVc
dropped from 86% in cOPD1 to 38 % in cOPD3;
fEV1 dropped from 80% to 33%; and blood
oxy-gen saturation dropped from 97% to 93%. The pa-tients (mostly cOPD2–3) were treated in the
anticholinergic or β2-agonists; inhaled and
system-ic steroids (5 days of dexametasone intravenous-ly, 4 mg a day); and antibiotics if there was clinical evidence of Type 1 or 2 exacerbation according to Anthoninsen criteria.
Additionally, morphological examinations of
AIO biopsy material from 25 stable cOPD1,2
pa-tients were carried out (Table 2). The biopsies were taken during inguinal herniotomies in order to assess the accuracy of the proposed ultrasonic method in the diagnosis of dystrophic RM chang-es. Hematoxylin-eosin staining and the one by Van gieson’s method were the histological methods used. The following morphological signs in RM were assessed: atrophic and sclerotic changes, my-olysis, fragmentations and contractures of myofi-brils, the presence of granules in sarcoplasm, the proliferation of perimysium cells and fibroblasts, as well as the growth of fatty tissue into the mus-cular tissue.
The statistical analysis was performed using Statistica 8.0 software (2007, Statsoft Inc., USA). The preliminary analysis of the variables under consideration was a Shapiro-Wilk test of corre-spondence to normal distribution. The results of the analysis were shown as median and inter-quartile range (25–75%) because all the parameters differed from normal distribution. The comparison of non-parametric parameters in two independent groups was carried out using a Mann-Whitney test, while in three or more independent groups it was performed using the Kruskal-Wallis rank sum test. fisher’s exact test was used to detect statisti-cally significant differences between independent
groups according to the frequency characteristic of the investigated parameter. Spearman’s rank cor-relation coefficient (rs) was used to describe the
re-lationship between the two quantitative variables that differed from normal distribution. The level of statistical significance was set at p < 0.05.
Results
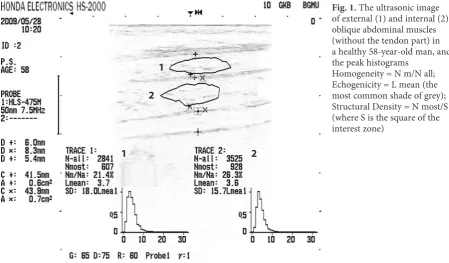
The ultrasonic images of accessory RM in the control group and in all the patient groups were significantly different. RM tissue in cOPD patients was represented as more echogenic and less homogenic compared with the control group. The peak histogram of the abdominal external and internal oblique muscles showed that echo-genicity was more common in the initial part of the grey color scale (fig. 1). Additionally, the low standard deviation value and the narrow basis of the graph denoting the uniformity of muscle tis-sue was due to a narrower spectrum of grey col-or gradation.
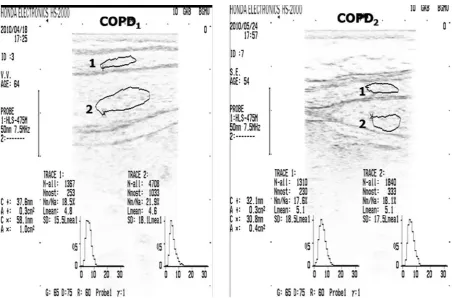
Various ultrasonic images denoting increased echogenicity and heterogeneity in the muscular tis-sue of cOPD1,2,3 patients were found. Increases in
the basis of the peak histogram and value as well as changes in structural density, echogenicity and ho-mogeneity were observed. figure 2 shows a typical amplitude histogram of abdominal oblique mus-cles in mild to moderate cOPD patients.
It wasdetermined that the changes in structur-al density, echogenicity and homogeneity in RM on inspiration varied in a complex way during the
Fig. 1. The ultrasonic image of external (1) and internal (2) oblique abdominal muscles (without the tendon part) in a healthy 58-year-old man, and the peak histograms
Homogeneity = N m/N all; Echogenicity = L mean (the most common shade of grey); Structural Density = N most/S (where S is the square of the interest zone)
1
1 2
course of cOPD development (Table 3; fig. 3, 4). A significant increase in homogeneity and struc-tural density against a background decrease of echogenicity was revealed. The structural density of ScM significantly increased in cOPD1 (by 9%
compared to the control group), while it decreased in cOPD2 (by 14% compared to the controls).
Echogenicity decreased in cOPD1 and increased
in cOPD2 (both by 18% in comparison to the
con-trol group). The opposite was that case with the Fig. 3. Dynamics of echogenicity index in
RM in the groups of patients with different severity of airflow limitation (gOLD spiro-metric levels) and the control group. * – compared with the control group, p < 0.05; ** – compared with patients of cOPD1 group, p < 0.05; *** – compared with patients of cOPD2 group, p < 0.05
Fig. 2. Echodensitometric data of external (1) and internal (2) oblique abdominal muscles in patients with cOPD1,2
homogeneity of ScM, which increased in cOPD1
(by 6% as compared to the controls) and decreased in cOPD2 (by 13% compared to the controls).
An 8% increase in the homogeneity of ScM was observed in cOPD3 in comparison with cOPD2
(p < 0.05), but this parameter remained below that
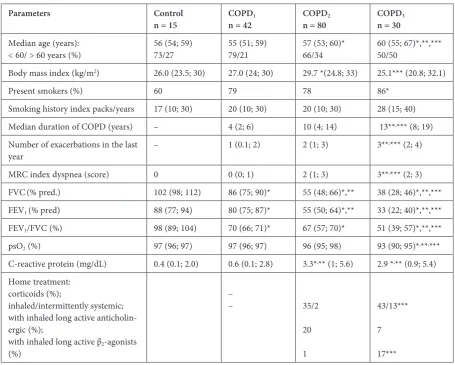
Table 1. baseline characteristics and the results of comparisons between the control group and the groups of patients with different degrees of severity of airflow limitation (gOLD spirometric level) on admission
Parameters Control
n = 15 COPDn = 421 COPDn = 802 COPDn = 303
Median age (years):
< 60/ > 60 years (%) 56 (54; 59)73/27 55 (51; 59)79/21 57 (53; 60)*66/34 60 (55; 67)*,**,***50/50
body mass index (kg/m2) 26.0 (23.5; 30) 27.0 (24; 30) 29.7 *(24.8; 33) 25.1*** (20.8; 32.1)
Present smokers (%) 60 79 78 86*
Smoking history index packs/years 17 (10; 30) 20 (10; 30) 20 (10; 30) 28 (15; 40)
Median duration of cOPD (years) – 4 (2; 6) 10 (4; 14) 13**,*** (8; 19)
Number of exacerbations in the last
year – 1 (0.1; 2) 2 (1; 3) 3**
,*** (2; 4)
MRc index dyspnea (score) 0 0 (0; 1) 2 (1; 3) 3**,*** (2; 3)
fVc(% pred.) 102 (98; 112) 86 (75; 90)* 55 (48; 66)*,** 38 (28; 46)*,**,***
fEV1 (% pred) 88 (77; 94) 80 (75; 87)* 55 (50; 64)*,** 33 (22; 40)*,**,***
fEV1/fVc (%) 98 (89; 104) 70 (66; 71)* 67 (57; 70)* 51 (39; 57)*,**,***
psO2 (%) 97 (96; 97) 97 (96; 97) 96 (95; 98) 93 (90; 95)*,**,***
c-reactive protein (mg/dL) 0.4 (0.1; 2.0) 0.6 (0.1; 2.8) 3.3*,** (1; 5.6) 2.9 *,** (0.9; 5.4)
Home treatment: corticoids (%);
inhaled/intermittently systemic; with inhaled long active anticholin-ergic (%);
with inhaled long active β2-agonists
(%)
–
– 35/2
20
1
43/13***
7
17***
Data are presented as n (%) or median (ranges), unless otherwise stated. gOLD – global initiative for chronic obstructive lung disease; cOPD – chronic obstructive pulmonary disease; MRc – modified medical research council questionnaire for
assessing the severity of breathlessness; fVc – forced vital capacity; % pred.: % predicted; fEV1 – forced expiratory volume
in one second; fEV1/fVc – ratio of these two measurements; psO2 – % blood oxygen saturation by pulse oximetry; * –
com-pared with the control group, p < 0.05; ** – comcom-pared with the cOPD1 group, p < 0.05; *** – compared with patients of
cOPD2 group, p < 0.05
Table 2. characteristics and the results of comparisons between the control group and the groups of patients who under-went morphological examinations
Parameters Control
n = 11 COPDn = 121 COPDn = 132 Kruskal-Wallis ANOVA, р
Age in years 55 (48; 60) 56 (51; 60) 57 (56; 59) > 0.05
bMI (kg/m2) 24 (23; 28) 24 (22; 26) 24 (24; 26) > 0.05
fEV1 (% pred.) 94 (85; 98) 79 (75; 87) 54 (49; 64) < 0.05
Present smokers (%) 6 (55) 8 (66) 10 (77) < 0.05
Index packs/years 12 (4; 20) 14 (5; 20) 29 (22; 40) < 0.05
Data are presented as n (%) or median (ranges), unless otherwise stated. cOPD – chronic obstructive pulmonary disease;
bMI – body mass index; fEV1 – forced expiratory volume in one second; % pred. – % predicted; p < 0.05 – significant
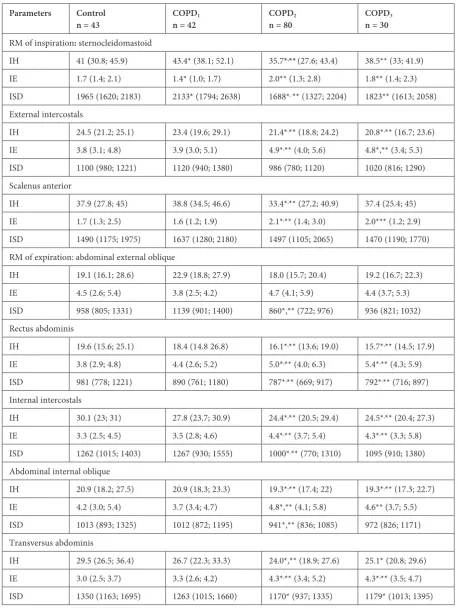
Table 3. Echodensitometric parameters of respiratory muscles and the results of comparisons between the control group and the groups of patients with different degrees of severity of airflow limitation (gOLD spirometric level)
Parameters Control
n = 43 COPDn = 42 1 COPDn = 80 2 COPDn = 30 3
RM of inspiration: sternocleidomastoid
IH 41 (30.8; 45.9) 43.4* (38.1; 52.1) 35.7*,**(27.6; 43.4) 38.5** (33; 41.9)
IE 1.7 (1.4; 2.1) 1.4* (1.0; 1.7) 2.0** (1.3; 2.8) 1.8** (1.4; 2.3)
ISD 1965 (1620; 2183) 2133* (1794; 2638) 1688*, ** (1327; 2204) 1823** (1613; 2058)
External intercostals
IH 24.5 (21.2; 25.1) 23.4 (19.6; 29.1) 21.4*,** (18.8; 24.2) 20.8*,** (16.7; 23.6)
IE 3.8 (3.1; 4.8) 3.9 (3.0; 5.1) 4.9*,** (4.0; 5.6) 4.8*,** (3.4; 5.3)
ISD 1100 (980; 1221) 1120 (940; 1380) 986 (780; 1120) 1020 (816; 1290)
Scalenus anterior
IH 37.9 (27.8; 45) 38.8 (34.5; 46.6) 33.4*,** (27.2; 40.9) 37.4 (25.4; 45)
IE 1.7 (1.3; 2.5) 1.6 (1.2; 1.9) 2.1*,** (1.4; 3.0) 2.0*** (1.2; 2.9)
ISD 1490 (1175; 1975) 1637 (1280; 2180) 1497 (1105; 2065) 1470 (1190; 1770)
RM of expiration:abdominal external oblique
IH 19.1 (16.1; 28.6) 22.9 (18.8; 27.9) 18.0 (15.7; 20.4) 19.2 (16.7; 22.3)
IE 4.5 (2.6; 5.4) 3.8 (2.5; 4.2) 4.7 (4.1; 5.9) 4.4 (3.7; 5.3)
ISD 958 (805; 1331) 1139 (901; 1400) 860*,** (722; 976) 936 (821; 1032)
Rectus abdominis
IH 19.6 (15.6; 25.1) 18.4 (14.8 26.8) 16.1*,** (13.6; 19.0) 15.7*,** (14.5; 17.9)
IE 3.8 (2.9; 4.8) 4.4 (2.6; 5.2) 5.0*,** (4.0; 6.3) 5.4*,** (4.3; 5.9)
ISD 981 (778; 1221) 890 (761; 1180) 787*,** (669; 917) 792*,** (716; 897)
Internal intercostals
IH 30.1 (23; 31) 27.8 (23.7; 30.9) 24.4*,** (20.5; 29.4) 24.5*,** (20.4; 27.3)
IE 3.3 (2.5; 4.5) 3.5 (2.8; 4.6) 4.4*,** (3.7; 5.4) 4.3*,** (3.3; 5.8)
ISD 1262 (1015; 1403) 1267 (930; 1555) 1000*,** (770; 1310) 1095 (910; 1380)
Abdominal internal oblique
IH 20.9 (18.2; 27.5) 20.9 (18.3; 23.3) 19.3*,** (17.4; 22) 19.3*,** (17.3; 22.7)
IE 4.2 (3.0; 5.4) 3.7 (3.4; 4.7) 4.8*,** (4.1; 5.8) 4.6** (3.7; 5.5)
ISD 1013 (893; 1325) 1012 (872; 1195) 941*,** (836; 1085) 972 (826; 1171)
Transversus abdominis
IH 29.5 (26.5; 36.4) 26.7 (22.3; 33.3) 24.0*,** (18.9; 27.6) 25.1* (20.8; 29.6)
IE 3.0 (2.5; 3.7) 3.3 (2.6; 4.2) 4.3*,** (3.4; 5.2) 4.3*,** (3.5; 4.7)
ISD 1350 (1163; 1695) 1263 (1015; 1660) 1170* (937; 1335) 1179* (1013; 1395)
Data are presented as median (ranges), unless otherwise stated. gOLD – global initiative for chronic Obstructive lung dis-ease; cOPD – chronic obstructive pulmonary disdis-ease; RM – respiratory muscles; IH – index of homogeneity, which charac-terized the degree of muscle homogeneity; IE – index of echogenicity (the level of the shade of the grey scale that most often emerged in the outlined zone); ISD – index of structural density, which permitted a quantitative assessment of muscles of
different size; * – compared with the control group, p < 0.05; ** – compared with the cOPD1 group, p < 0.05; *** –
of the control group. A similar picture was detect-ed in the structural density, which increasdetect-ed by 21% in cOPD3 compared with cOPD2 (p < 0.05)
and almost reached the control value. The dynam-ics of these indices for SA were similar to ScM, but were less pronounced during the progression of cOPD. The homogeneity of ExI was significant-ly decreased in cOPD2,3 (by 13% and 15% as
com-pared to the control group), while the echogenicity of ExI was increased in cOPD2,3 (by 29% and 21%
compared to the controls). The structural density of ExI did not significantly differ from the control value. The changes in the echogenicity index in de-veloping cOPD are quite evident in fig. 3.
The changes in the echodensitometric param-eters of expiratory RM were similar to those in the inspiratory RM. The homogeneity and structural density of AIO were significantly lower in cOPD2
(both by 7% in comparison with the controls) and
in cOPD3 (by 7% and 5% in comparison with the
controls), while increased echogenicity was
ob-served in cOPD2,3 (by 14% and 10% as compared
with the controls). The homogeneity and echoge-nicity of AEO did not differ from the control group in cOPD1,2,3, while the structural density was
low-er only in cOPD2 (by 10% in comparison with the
control group). Decreased homogeneity and struc-tural density of RA were also noted in cOPD2 (by
18% and 20% in comparison with the controls) and
cOPD3 (by 20% and 13% in comparison with the
controls), while significantly increased echogenic-ity was registered in cOPD2,3 (by 31% and 42% in
comparison with the controls). The dynamics of the changes in structural density in RM were no-ticeably different from the dynamics of echogenici-ty during the progression of cOPD (fig. 4).
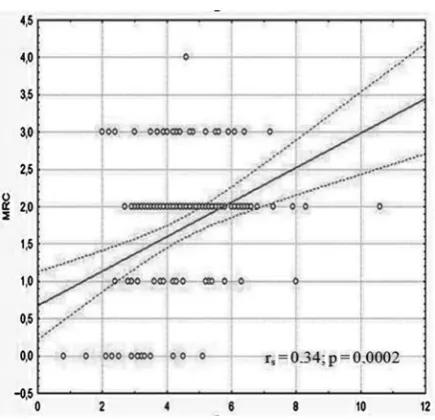
Additionally, the study investigated the re-lationship between the patients’ physical activi-ty (approximately, in accordance with the severiactivi-ty of breathlessness) and the echodensitometric pa-rameters of RM. All the patients were divided in-to four subgroups according in-to the degree of dys-pnea expressiveness on the MRc scale. In these subgroups, significant differences in homogenei-ty were revealed for AEO, ExI, InI, ScM, SA and RA. changes in echogenicity were expressed to a greater extent than changes in homogeneity in these cOPD subgroups. Significant echogenicity differences between the MRc0 subgroup and the
MRc1,2,3 subgroups were revealed for all the
stud-ied RM (Table 4).
The morphological study of RM in cOPD1,2
pa-tients provided the following picture (Table 5): Structural abnormalities – atrophic changes – were found in 25 % of the cOPD1 patients compared
with 69% of cOPD2 patients, and in 45% of
sub-jects from the control group (χ2 = 4.91; р = 0.085).
Additionally, in the cOPD2 group, the proportion
Tаble 4. comparison of echogenicity index values in RM between groups of patients with different degrees of severity of breathlessness
RM MRC0
n = 26 MRCn = 201 MRCn = 832 MRCn = 243
AEO 3.0 (2.1; 3.5) 4.3*(3.0; 5.3) 4.7 *,**(4.1; 5.6) 4.3*,▼ (3.6; 5.6)
AIO 3.5 (3.3; 4.5) 4.2 (3.6; 5.2) 4.8*,**(4.1; 5.8) 4.8*,**(3.6; 5.5)
TA 3.2 (2.4; 3.7) 3.7 (2.7; 4.7) 4.3*(3.4; 5.1) 4.1*(3.4; 4.7)
ExI 3.8 (2.9; 5.2) 4.2 (3.5; 5.2) 4.8*(3.8; 5,5) 4.6*(4.0; 5.6)
InI 3.4 (2.4; 4,0) 3.9*(3.1; 5.5) 4.4*(3.6; 5.3) 4.2*(3.4; 5.9)
ScM 1.4 (0.9; 1.7) 1.5 (1.2; 2.5) 1.9*(1.3; 2.6) 2.0*(1.6; 2.3)
SA 1.4 (1.1; 1.8) 1.9*(1.7; 3.0) 1.9*(1.3; 2.8) 2.3*(1.4; 3.2)
RA 3.4 (2.5; 5.1) 5.1*(4.5; 5.6) 5.3*(4.0; 6.5) 4.9*(4.2; 5.7)
Data are presented as median (ranges), unless otherwise stated. RM – respiratory muscles; MRc – modified Medical Research council questionnaire for assessing the severity of breathlessness; AEO – abdominal external oblique muscle; AIO – abdominal internal oblique muscle; TA – transversus abdominis muscle; ExI – external intercostal muscle; InI – inter-nal intercostal muscle; ScM – sternocleidomastoid muscle; SA – scalenus anterior muscle; RA: rectus abdominis muscle;
* – compared with patients with МRС0, p < 0.05; ** – compared with patients with МRС1, p < 0.05; *** – compared with
of patients with atrophic changes in muscle tissue was higher than in the cOPD1 group (69% and
25% respectively; χ2 = 4.89; р = 0.047). It is
neces-sary to note that this morphological sign was not specific to cOPD patients, because it was often de-tected in the control group as well.
As it can be seen from Table 5, the presence of
myolysisin RM (fig. 5A) was observed in 92% of
the cOPD1,2 patients), but in only 9% of subjects
from the control group (χ2 = 23.6; р = 0.00001).
In some cases the presence of myolysis zones with a proliferation of perimysium cells arranged into a continuous series was detected in these cOPD patients. Additionally, the presence of granules in sarcoplasm (a sign of severe dystrophic chang-es) was revealed. Deep dystrophic albuminous
granules of various sizes were also noted in rela-tively unaffected muscular fibers. The fragmenta-tion of myofibrils was also present in all the groups:
82% in the control group; 83% and 85% in cOPD1
and cOPD2 respectively (χ2 = 0.01; р = 0.99).
No significant differences were detected be-tween the control group and the cOPD1,2 groups
regarding the presence of perimysium cell prolif-eration (36%, 67% and 72% respectively; χ2 = 2.43;
p = 0.29); nor were significant differences observed between the cOPD1,2 groups (fig. 5b). Round-cell
infiltrates around microcirculation vessels, peri-vascular and intramuscular fatty tissue along the myofibrils were found, with no significant differ-ences between the control group and cOPD1,2
pa-tients (χ2 = 6.08; р = 0.06). Deposits of lymphocytes
Таble 5. Distribution of cOPD1,2 patients according to the presence of some morphological signs in RM
Morphological sign Control
n = 11 COPDn = 121 COPDn = 132
Atrophy of myofibrils 5 (45) 3 (25) 9 (69)**
Myolysis 1 (9) 11 (92)* 12 (92)*
Proliferation of perimysium cells 4 (36) 8 (67) 8 (62)
Proliferation of fibroblasts 0 3 (25) 9 (69)*,**
Intergrowth of fatty tissue into muscular tissue 4 (36) 3 (25) 9 (69)**
Sclerotic changes: moderate
pronounced 1 (9)0 7 (58)2 (17) 3 (23)*10 (77)*,**
contractures of myofibrils 0 8 (67)* 11 (85)*
Data are presented as n (%), unless otherwise stated. cOPD – chronic obstructive pulmonary disease; RM – respiratory
muscles; * – compared with the control group, p < 0.05; ** – compared with patients of cOPD1 group, p < 0.05.
Fig. 5A. fragmentation and destruction of sarcoplasm in the center of myofibrils and proliferation of perimy-sium cells and fibroblasts
in separate fibers with fusion of sarcolemma and
bordering sarcoplasm were noted in cOPD1,2
pa-tients; there were no significant differences be-tween these groups (χ2 = 0.99; p = 0.43). No
pro-liferation of fibroblasts was detected in the control group, but it was observed in 25% and 69% of the cOPD1 and cOPD2 patients respectively. There
were significant differences between the control group and the study groups (χ2 = 13.4; р = 0.0012)
as well as between cOPD1 and cOPD2 (χ2 = 4.89;
р = 0.047). Intergrowth of fatty tissueinto muscle tissue (fig. 6A) was observed in 25% of cOPD1
pa-tients and in 69% of cOPD2 patients, as well as in
36% of the control group. This shows the nonspe-cific character of these changes, although there was a significant difference between the cOPD groups and the controls (χ2 = 12.3; р = 0.002) as well as
between the cOPD1 and cOPD2 groups (χ2 = 11.54;
р = 0.0012). Marked focal growth of fatty tissue be-tween muscular fibers and in damaged muscle fi-bers may be considered a sign of “false hypertro-phy” of muscle tissue.
Sclerotic changes in RM muscle tissue were observed in 75% of the cOPD1 patients and in all
cOPD2 patients (fig. 6b, 7A) compared with
on-ly 9% of the healthy controls. This also indicates nonspecificity of these changes, although there was a significant difference between these three groups (χ2 = 20.6; р = 0.00038) as well as between the
cOPD1 and cOPD2 groups (χ2 = 5.16; р = 0.039)
in the combination of expressed and insignificant sclerotic manifestations. Expressed interstitial scle-rosis that extended to certain areas of the damaged muscle fibers was revealed.
Fig. 6A. Intergrowth of fatty tissueinto the muscular
tissue and proliferation of peremysium cells Fig. 6B.scleroses and a large number of collagen fibers in The presence of zones with interstitial cOPD1 patients
Fig. 7A. foci of sclerosis in intramuscular regions (1), increase in adipose cells (2) and destruction of myofi-brils (3) in cOPD2 patient
contractures of myofibrils (fig. 7b) were ob-served in 67% of the cOPD1 patients and in 85% of
the cOPD2 patients, while these changes were not
found in the control group. There was a significant difference between these cOPD groups and the con-trol group, but no significant difference was noted be-tween the cOPD groups (χ2 = 1.1; р = 0.37). A
com-bination of contracture foci and interstitial sclerosis around separate muscular fibers was found.
Discussion
Muscular dysfunction often occurs in cOPD and may involve both respiratory and peripheral
muscles.Decreased strength and endurance in RM
can lead to clinical symptoms and ventilatory insuf-ficiency, whereas in the peripheral muscles it limits exercise capacity and daily activities.The structur-al changes of accessory RM that were revestructur-aled by ultrasonic densitometry consisted of echogenicity
phase changes, the cause of which may be multi-factorial. A relationship between the severity of cOPD and the dystrophic changes in RM accord-ing to the data from the ultrasonic densitometry was established. This is illustrated in fig. 8.
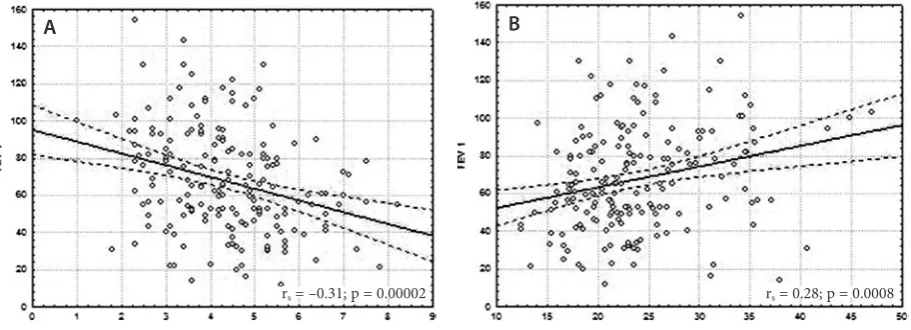
It was determined that the changes in the ech-odensitometry parameters in isolated RM correlate with decreased fEV1 and increased breathlessness
expressiveness in cOPD patients. The correla-tion between the echodensitometric parameters of external intercostal muscle and fEV1 as well as
breathlessness can be seen in fig. 9 and fig. 10. Additionally, a simultaneous increase in the se-verity of dyspnoea and the echogenicity of isolated RM in the course of cOPD development was de-tected against a background of decreasing homo-geneity and structural density due to the expressed atrophy of muscular fibers and the expansion of connective and fatty tissue.
The dynamics of these ultrasonic parame-ters precisely reflects the course of the dystrophic Fig. 8. comparisons of echodensitometry parameters: indices of echogenicity (A) and homogeneity (b) of the external intercostals muscle in the groups of patients with different degrees of severity of airflow limitation (gOLD spirometric level) and the control group (results of the Kruskal-Wallis test)
Fig. 9. correlations between fEV1 and the echodensitometric parameters: indices of echogenicity (A) and homogene-ity (b) of the external intercostals muscle (–) with 95% confidence intervals (––). fEV1 – forced expiratory volume in one second
rs = –0.31; p = 0.00002 rs = 0.28; p = 0.0008
A A
process in RM during the progression of cOPD: from compensatory hypertrophy of RM in re-sponse to the increase in RM functional load, through their dystrophy in the phase of substitut-ing muscle growth with fatty and connective tis-sue, to severe RM atrophy in severe cOPD. Thus,
each subsequent stage of cOPD severity leads to increasing atrophic and degenerative RM changes. This fact provides the basis for a conclusion about a relationship between RM structural changes (re-vealed during ultrasonic examination) and func-tional changes of the respiratory system (mani-fested by decreased fEV1 and increased dyspnea
expressiveness) in severe cOPD. The significance of these phase changes in RM echodensitometric parameters is not fully understood. This dynamics of echodensitometric parameters in cOPD1 could
be explained to a certain degree by the increase in echogenicity due to substituting muscle growth with fatty and connective tissue. Thus, a significant positive correlation was determined between scle-rotic manifestations of RM and their echogenicity index (fig. 11) in cOPD patients.
Homogeneity and structural density increased slightly in cOPD3 compared with cOPD2, while
echogenicity decreased slightly. It can be assumed that the development of RM fatigability in severe cOPD was caused by several factors (a decrease in their mass, sclerotic changes and a loss of fatty mass) that reduced the echogenicity of RM. These morphological changes could be primarily due to the expressed systemic inflammation, as well as (to a lesser extent) changes in the hormonal status and the high sensitivity of patients who had received
long-term high doses of glucocorticoids during cOPD exacerbation.
The study has demonstrated the advantages of the ultrasonic method in the diagnosis of sclerotic changes, the detection of intergrowth of fatty tis-sue into the muscle tistis-sue and atrophic changes. The method is a major source of information for assessing structural RM changes. This was proba-bly connected with the use of the ultrasonic meth-od to examine the muscles throughout their full thickness. These morphological data suggest that the alternating increases and decreases in the ul-trasonic parameters could be caused by changes in the fatty tissue volume in the muscle tissue in dif-ferent stages of cOPD development.
The morphological method of studying RM is invasive and inconvenient, as it is associated with possible complications, whereas the proposed ul-trasonic method for examining RM is simple and safe. In light of this, the authors compared the pos-sibilities of these 2 diagnostic methods for the as-sessment of RM status in cOPD patients with different degrees of severity. The sensitivity and specificity of the ultrasonic method were con-firmed in 55% and 59% of cases for the estimation of sclerotic changes in RM, which was compara-ble to the results of morphological study. both the prognostic positive and prognostic negative results of the ultrasonic method approached 57%. Thus, the likelihood ratio for a positive result was 1.34. No significant differences between the ultrasonic and morphometric methods were detected while evaluating sclerotic changes in cOPD patients (χ2 = 0.82; р = 0.37).
Fig. 11. correlations between sclerosis manifesta-tions and index of echogenicity of abdominal internal oblique muscle
The sensitivity and specificity of the ultrasonic method of determining the expressiveness of fatty tissue intergrowth into the muscle tissue were con-firmed in 55% of the cases, including both prognos-tic positive and prognosprognos-tic negative results. Thus, the likelihood ratio for a positive result was 1.20. No significant differences between the ultrasonic and morphological methods were found in rela-tion to these morphological phenomena (χ2 = 0.36;
р = 0.55).
The sensitivity and specificity of the ultrason-ic method for estimating atrophultrason-ic muscular tissue expressiveness were confirmed in 55% and 59% of cases. The prognostic importance of both pos-itive and negative results was 57%. Thus, the like-lihood ratio for a positive result was 1.33. No sig-nificant differences were detected comparing the results from cOPD patients who underwent ex-aminations by both the ultrasonic and morpholog-ical methods to evaluate atrophic muscular tissue expressiveness (χ2 = 0.82; р = 0.37). The accuracy
of the ultrasonic method was lower than that of the morphological method in diagnosing RM dystro-phic changes in relation to other morphological signs analyzed.
The authors concluded that the proposed method of assessing echodensitometric parame-ters showed the heterogeneity of RM pathological
changes and reflected the dynamics of the degen-erative processes in RM during the development of cOPD in a complex way. More dystrophic chang-es were detected in the following RM: the stern-ocleidomastoid, external intercostal, abdominal internal-external oblique and rectus. In cOPD1
a tendency to increased homogeneity and structur-al density structur-along with decreased echogenicity was observed, whereas in cOPD2 there was a tendency
to decreased homogeneity and structural density, while echogenicity increased. In cOPD3 a
tenden-cy to return to increased homogeneity and struc-tural density against the background of decreased echogenicity wasdetected. In general, greater dif-ferences were detected between cOPD groups in the echogenicity index.
• Increased breathlessness in COPD patients
positively correlated with echogenicity and negatively correlated with the structural den-sity of the sternocleidomastoid, internal inter-costal, abdominal external oblique and rectus muscles.
• The high informative value of the ultrasonic
method for evaluating dystrophic changes in RM was shown, providing a basis for consider-ing this method a first-line choice for monitor-ing pathological RM changes durmonitor-ing the pro-gression of cOPD.
References
[1] Franssen FM: Sarcopenia in cOPD: functional and metabolic implications. Eds.: Schols A., Wouters E. Maastricht University 2009, 248.
[2] Bezdenezhnykh AV, Sumin AN: Sarcopenia: prevalence, detection, clinical significance. clin Med (Russia) 2012, 10, 16–22.
[3] Cesari M, Pahor M, Lauretani F: Skeletal muscle and mortality results. In cHIANTI Study. J gerontol 2009, 64A, 377–384.
[4] Santanasto AJ, Glynn NW, Newman MA: Impact of weight loss on physical function with changes in strength, muscle mass, and muscle fat infiltration in overweight to moderately obese older adults: A randomized clinical trial. J. Obesity 2011, article ID 516576, doi:10.1155/2011/516576.
[5] Stenholm S, Harris TB, Rantanen T: Sarcopenic obesity: definition, cause and consequences. curr Opin clin Nutr Metab care 2008, 693–700.
[6] Agusti AG: Systemic effects of chronic obstructive pulmonary disease. Eur Respir J 2003, 21, 347–360.
[7] Fitting JW: Respiratory muscles in chronic obstructive pulmonary disease. Swiss Medical Weekly 2001, 131, 483–486.
[8] Avdeev SN: cOPD as systemic disease. Pulmonology (Russia) 2007, 2, 104–116.
[9] Garcia-Rio F: Daily physical activity in patients with cOPD is mainly associated with dynamic hyperinflation. Am J Respir crit care Med 2009, 180, 506–512.
[10] Watz H: Physical activity in patients with cOPD. Eur Respir J 2009, 33, 262–272.
[11] Watz H: Extrapulmonary effects of chronic obstructive pulmonary disease on physical activity: a cross-sectional study. Am J Respir crit care Med 2008, 177, 743–751.
[12] Waschki B: Physical activity is the strongest predictor of all-cause mortality in patients with cOPD. chest 2011, 140, 331–359.
[13] Perzeva TA: Muscle’s dysfunction in cOPD: overestimate of this problem, new possibilities of therapy. Health of Ukraine (electronic resource) 2008.
[14] Bernarg S: Peripheral muscle weakness in patients with chronic obstructive pulmonary disease. Am J Respir crit care Med 1998, 158, 629–634.
[15] Sharp JT: The respiratory muscles in cOPD. Am Rev Respir Dis 1986, 134, 1089–1091.
[16] O’Donnell DE, Laveneziana P: Physiology and consequences of lung hyperinflation in cOPD. Eur Respir Rev
2006, 15, 61–67.
[18] Laghi F: Disorders of the respiratory muscles. Am J Respir crit care Med 2003, 168, 10–48.
[19] Chuchalin AG, Ajsanov ZR: Disorders of respiratory muscles function in cOPD. Therap. Archive (Russia) 1988, 8, 126–132.
[20] Surkova EG: The estimation of diaphragm function in cOPD according to the data of ultrasound methods. In: Scientific proceedings of St.-Petersburg Academy. Ed.: Jaickij NA, St-Petersburg (Russia) 2009, 16, 28–32.
[21] Similowski T, Yan S, Gauthier AP: contractile properties of the human diaphragm during chronic hyperinflation. N Engl J Med 1991, 325, 917–923
[22] Orozco-Levi M, Gea J, Lloreta JL: Subcellular adaptation of the human diaphragm in chronic obstructive pulmo-nary disease. Eur Respir J 1999, 13, 371–378.
[23] Levine S, Kaiser L, Leferovich J, Tikunov B: cellular adaptations in the diaphgram in chronic obstructive pulmo-nary disease. N Engl J Med 1997, 337, 1799–1806.
[24] Mercadier JJ, Schwarz K, Schiaffino S: Myosin heavy chain gene expression changes in the diaphragm of patient with chronic lung hyperinflation. Am J Physiol 1998, 274, 527–534.
[25] Orozco-Levi M: Structure and function of the respiratory muscles in patients with cOPD: impairment or adapta-tion? Eur Respir J 2003, 22, Suppl. 46, 41–51.
[26] Cullen MJ: Morphological changes in dystrophic muscle. british Medical bulletin 1980, 36, 145–152.
[27] Jobin J, Maltais F, Doyon JF: chronic obstructive pulmonary disease: capillarity and fiber-type characteristics of skeletal muscle. J cardiopulm Rehabil 1998, 18, 432–437.
[28] Petrella JK, Kim JS, Tuggle SC: Age differences in knee extension power, contractile velocity, and fatigability. J Appl Physiol 2005, 98, 211–220.
[29] Schertzer JD, Van der Poel C, Shavlakadze T: Muscle-specific overexpression of Igf-I improves E-c coupling in skeletal muscle fibers from dystrophic mice. Am J Physiol cell Physiol 2008, 294, 161–168.
[30] Ambrosimov VN: Dysfunction of respiratory muscles and their diagnostics in cOPD patients. clin gerontology (Russia) 2008, 6, 38–43.
[31] Wouters EF: Nonpharmacological modulation of dynamic hyperinflation. Eur Respir Rev 2006, 15, 90–95.
[32] Casaburi R, Bhasin S, Cosentino L: Effects of testosterone and resistance training in men with chronic obstructive disease. Am J Respir crit care Med 2004, 170, 870–878.
[33] Casaburi R: Impacting patient-centered outcomes in cOPD: deconditioning. Eur Respir Rev 2006, 15, 42–46.
[34] Tkác J: Systemic consequences of cOPD. Therap Advances in Respir Dis 2007, 1, 47–59.
[35] Van Eeden SF, Sin DD: cOPD: A chronic Systemic Inflammatory Disease. Respiration 2008, 75, 224–238.
[36] Mador MJ, Bozkanat E: Skeletal muscle dysfunction in chronic obstructive pulmonary disease. Respiratory Research 2001, 2, 216–224.
[37] Shrikrishna D: Ultrasound measurement of quadriceps wasting in patients with gOLD stage II cOPD and its
relationship to physical activity. Eur Respir J (Abstracts; 21th ERS annual congress), Amsterdam, Netherlands 2011, 38, Suppl. 55, 889.
[38] Platonova IS: The morphologic changes of respiratory muscles in cOPD patients with different degree of respiratory insufficiency. Author’s abstract of dissertation on scientific degree of candidate of medical sciences. St.-Petersburg Med. University, St.-Petersburg (Russia), 2003, 18.
[39] global Initiative for chronic Obstructive Pulmonary Disease (gOLD). global Strategy for the Diagnosis, Management, and Prevention of chronic Obstructive Pulmonary Disease, global Initiative for chronic Obstructive Lung Disease NHLbI/WHO workshop report. Last updated 2011. http://www.goldcopd.org.
Address for correpondence:
Aleksander E. Makarevich Department of Internal Medicine belarusian State Medical University 83 Dzerzhinsky Ave.
Minsk belarus
E-mail: [email protected]
conflict of interest: None declared