J
OLANTAO
FICJALSKA−M
ŁYŃCZAK, M
ARIAM
UZYKA−W
OŹNIAK, P
ATRYCJAK
RZYŻANOWSKA,
A
GNIESZKAJ
AMROZY−W
ITKOWSKAChanges in Macular Hole Morphology
after Vitrectomy with Internal Limiting Membrane
Peeling Assessed by Scanning Laser Tomography
(Heidelberg Retina Tomograph)
Dynamika zmian morfologicznych plamki
w obrazie skaningowej tomografii laserowej
(Heidelberg Retina Tomograph) po usunięciu błony granicznej
wewnętrznej siatkówki u chorych z otworami w plamce
Department of Ophthalmology, Silesian Piasts University of Medicine in Wroclaw, Poland Adv Clin Exp Med 2007, 16, 1, 69–73
ISSN 1230−025X
ORIGINAL PAPERS
© Copyright by Silesian Piasts University of Medicine in Wrocław
Abstract
Background. Idiopathic macular hole causes progressive loss of vision. Vitrectomy with retinal internal limiting membrane (ILM) peeling is a well−known treatment modality. Ophthalmoscopy and stereo fundus photography are usually used for macula assessment. However these methods are subjective and do not provide quantitative assess− ment of the macula after vitrectomy.
Objectives.The aim of this study was to assess morphological changes in idiopathic macular hole after vitrecto− my with ILM peeling using scanning laser tomography (Heidelberg Retina Tomograph).
Material and Methods.Fourteen eyes of 14 patients (3 men, 11 women) aged 62–79 years with idiopathic mac− ular hole stage III or IV were included. Scanning laser tomography was performed before and two weeks to three months after vitrectomy. The macular hole was circumscribed with a circle corresponding to its edge. The para− meters assessed were: area, mean radius, volume below the surface, effective mean depth, and maximum depth in contour.
Results.The mean area of the macular hole was 0.318 mm2(± 0.12) before and 0.319 mm2(± 0.11) after vitrectomy,
mean radius was 0.313 mm (± 0.05) before and 0.314 mm (± 0.05) after vitrectomy, the differences not being statis− tically significant. The effective mean depth was 0.11 mm (± 0.06) before and 0.01 mm (± 0.01) after vitrectomy (p< 0.001), maximum depth in contour was 0.18 mm (± 0.06) before and 0.05 mm (± 0.02) after vitrectomy (p< 0.0001), and the volume below the surface was 0.029 mm (± 0.01) before and 0.004 mm (± 0.005) after vitrectomy (p< 0.001). The mean visual acuity before vitrectomy was 0.08 (± 0.04) and it improved to 0.24 (± 0.13) after surgery (p< 0.001). The change in visual acuity correlated with the change in volume below the surface (p< 0.05).
Conclusions.Scanning laser tomography is a useful tool for assessing macular hole morphology after vitrectomy (Adv Clin Exp Med 2007, 16, 1, 69–73).
Key words:scanning laser tomography, macular hole, vitrectomy
Streszczenie
Wprowadzenie.Otwory w plamce są częstą przyczyną postępującej utraty ostrości wzroku. Jedyną metodą lecze− nia otworu w plamce jest witrektomia z usunięciem błony granicznej wewnętrznej siatkówki. Do oceny stanu plamki po zabiegu stosuje się metody subiektywne (oglądanie dna oka, kolorowe zdjęcia dna oka), niepozwalają− ce na ilościową analizę badanego obszaru.
Cel pracy.Analiza porównawcza stanu morfologicznego otworów w plamce przed, a następnie po zabiegu opera− cyjnym witrektomii z usunięciem błony granicznej wewnętrznej, dokonana za pomocą skaningowej tomografii la− serowej (Heidelberg Retina Tomograph – HRT).
Idiopathic macular hole causes serious loss of vision in patients over 55 years of age. Vitrectomy is a well−known and established treatment modali− ty which results in the release of tractional tangen− tial forces causing elevation of the edges of the macular hole by peeling the internal limiting membrane (ILM) of the retina and SF6 tamponade [1, 2]. Anatomical success, described as the disap− pearance of subretinal fluid and flattening of the macular hole’s edges, is achieved in 58–73% of cases [2–5]. The anatomical effect does not always correspond with functional success. Visual acuity improvement of at least two lines on the Snellen chart is achieved only in 42–56% of cases [2–5]. Ophthalmoscopy and stereo fundus photography are usually used for macula assessment. However, these methods are subjective and do not provide quantitative assessment of the macula after vitrec− tomy [6].
The aim of this study was to assess morpholog− ic changes in idiopathic macular holes before and after vitrectomy with ILM peeling using scanning laser tomography (Heidelberg Retina Tomograph, HRT) and correlate these with visual acuity.
Methods
Fourteen eyes of 14 patients (3 men, 11 women) aged 62–79 with idiopathic macular hole stage III (5 eyes) or IV (9 eyes) were included. Vitrectomy with ILM peeling and SF6 tamponade was performed in all eyes between May 2003 and January 2004 at the Department of Ophthalmology in Wrocław, Poland. Indocyianine green or trypan blue were used to stain the internal limiting mem− brane. Eyes without macular hole closure after vit− rectomy were excluded from the study.
Quantitative assessment of macular morpholo− gy was performed by scanning laser tomography using a Heidelberg Retina Tomograph (version 2.01) before and after vitrectomy and during fol− low−up examinations. The Heidelberg Retina Tomograph (HRT) is a confocal laser scanning system designed for the acquisition and analysis of three−dimensional images of the posterior seg− ment. It enables the quantitative assessment of the topography of ocular structures and precise fol− low−up of topographic changes [7]. A two−dimen− sional image is an optical section at the focal plane. When the focal plane is moved and images at different depth locations are acquired, a series of optical section images is obtained which forms a layer−by−layer three−dimensional image of the three−dimensional object. Topographical images are computed from the acquired three−dimensional images, consisting of 256 × 256 individual height measurements, which are absolutely scaled for the individual eye and have a reproducibility of the height measurements of approximately 10 to 20 microns [8]. The Heidelberg Retina Tomograph system allows the acquisition of three−dimension− al images and topographic analysis of the macula. In particular, laser scanning tomography as real− ized in the HRT allows a quantitative assessment of changes in the morphology of the macula region over time [9–12].
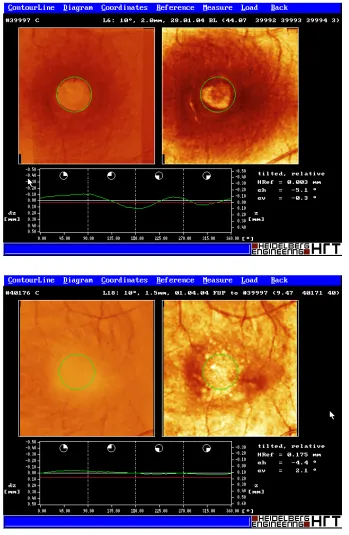
Scanning laser tomography was performed before (Fig. 1) and two weeks to three months after vitrectomy (Fig. 2). In order to increase reproducibility and minimize the influence of arti− facts, five single measurements of possibly highest quality were saved and the mean was calculated. The examination was always performed by the same person and the results were masked for the other person performing the visual acuity exami−
kówki wykonano przed witrektomią, a następnie 2 tygodnie – 3 miesiące po operacji. Otwór plamki wpisywano w okrąg odpowiadający dokładnie brzegom otworu. Oceniano następujące wskaźniki otworu: powierzchnia (area), średni promień (mean readius), objętość pod powierzchnią (volume below surface), efektywna średnia głębokość (effective mean depth), maksymalna głębokość (maximal depth in contour).
Wyniki.Średnia powierzchnia otworu plamki (area) w badanej grupie chorych wynosiła średnio 0,318 mm2(±
0,12) przed witrektomią i 0,319 mm2(± 0,11) po witrektomii, średni promień powierzchni (mean radius) wynosił
średnio 0,313 mm (± 0,05) przed witrektomią i 0,314 mm (± 0,05) po witrektomii, różnice były nieistotne staty− stycznie. Istotnie zmieniły się natomiast wskaźniki opisujące otwór plamki trójwymiarowo: średnia efektywna głę− bokość otworu (effective mean depth) wynosiła przed zabiegiem 0,11 mm (± 0,06), po zabiegu 0,01 mm (± 0,01), p < 0,001, maksymalna głębokość otworu (maximum depth in contour) przed zabiegiem osiągała średnio 0,18 mm (± 0,06), a po zabiegu 0,05 mm (± 0,02), p < 0,0001, objętość poniżej powierzchni (volume below surface) wyno− siła przed zabiegiem średnio 0,029 mm (± 0,01), a po zabiegu 0,004 mm (± 0,005), p < 0,001. Średnia ostrość wzroku przed witrektomią wynosiła 0,08 (± 0,04), a po witrektomii uległa poprawie do 0,24 (± 0,13) (p < 0,001). Zmiana ostrości wzroku korelowała ze zmianą w objętości poniżej powierzchni (volume below surface), p < 0,05. Wnioski. Skaningowa tomografia laserowa (HRT) jest obiektywnym narzędziem badawczym, pomocnym w oce− nie topografii otworów plamki u pacjentów poddanych chirurgicznemu usunięciu błony granicznej wewnętrznej siatkówki (Adv Clin Exp Med 2007, 16, 1, 69–73).
nation. The macular hole was circumscribed with a circle (contour line) corresponding to its edge. The following parameters were assessed: area, mean radius, volume below the surface, effective mean depth, and maximum depth in contour. The contour line was then used for follow−up examina− tions using an export/import function.
All results are expressed as mean ±SD. The Wilcoxon matched−pairs signed−ranks test was used to compare values before and after vitrecto− my. Spearman’s rank correlation test was used to determine the relationship between values. A value of p< 0.05 was considered significant.
Results
The parameters describing the surface of the macular hole remained unchanged after vitrectomy. The mean area of the macular hole was 0.318 mm2 (± 0.12) before and 0.319 mm2(± 0.11) after vitrec− tomy, mean radius was 0.313 mm (± 0.05) before and 0.314 mm (± 0.05) after vitrectomy, the differ− ences not being statistically significant. Three− dimensional parameters changed significantly: the effective mean depth was 0.11 mm (± 0.06) before and 0.01 mm (± 0.01) after vitrectomy (p< 0.001) (Fig. 3), maximum depth in contour was 0.18 mm
Fig. 1. Scanning laser topography of the macular hole before vitrectomy
Ryc. 1. Skaningowa tomo− grafia laserowa otworu w plamce wykonana przed zabiegiem witrektomii
Fig. 2. Scanning laser tomography of the same eye as in Figure 1 after successful vitrectomy
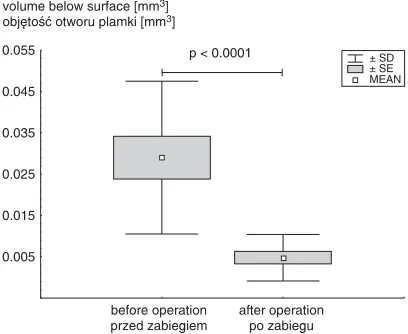
(± 0.06) before and 0.05 mm (± 0.02) after vitrecto− my (p< 0.0001) (Fig. 4), and the volume below the surface was 0.029 mm (± 0.01) before and 0.004 mm (± 0.005) after vitrectomy (p< 0.001) (Fig. 5).
Discussion
Hudson et al. evaluated four eyes using HRT exhibiting different stages of macular hole forma− tion preoperatively. The subjects were assessed preoperatively and at one and three months post− operatively. Topographic difference analysis of the right and left eyes of case 1 showed a significant postoperative reduction in the height of the retina. Topographic difference analysis of case 2 showed no significant change in topography. Topographic difference analysis of case 3 showed a significant postoperative increase in the height of the retina [13]. However the authors did not circumscribe the macular hole with a circle. Instead they ana− lyzed images of the macula at 10−degree and 20− degree fields. Kobayashi et al. examined 44 Japanese patients with idiopathic full−thickness stage III macular holes in a similar follow−up peri− od. They divided patients in two groups based on the size of the macular hole: < 0.350 mm2 and >0.350 mm2. The area, volume, mean depth, and maximum depth of the macular holes diminished significantly postoperatively [14].
In the group of patients of the present study, the preoperative mean visual acuity was 0.08 (± 0.04) and improved after vitrectomy up to a mean of 0.24 (± 0.13), which was statistically significant (p < 0.001). The improvement in visual acuity correlated with the change in volume below the surface (r = 0.99, p< 0.05). Kobayashi et al. reported similar results [14, 15], additionally showing strong corre− lation of pre−op visual acuity with parameters describing the mean and maximal depth of the mac− ular hole. This was not confirmed in our group of patients, probably due to the small number of cases. Analyzing ten consecutive patients with mac− ular holes, Byhr and Lindblom [16] suggested that the preoperative size of a macular hole can be used as a predictor of the functional outcome of macu− lar hole surgery. Such a correlation was not obser− ved in the group of patients of the present study. Studies of larger sample size are required to verify the predictive value of this parameter.
Scanning laser tomography (HRT) is an objec− tive diagnostic tool for assessing macular hole to− pography in patients undergoing surgical removal of the retinal internal limiting membrane. Further studies on a larger group of patients with different stages of macular hole are needed to determine the correlation of stage with post−op visual acuity. Fig. 3. “Effective depth” parameter of the macular
hole before and after vitrectomy
Ryc. 3. Głębokość otworu plamki przed zabiegiem witrektomii i po zabiegu
0.02 0.06 0.10 0.14 0.18 0.22 before operation przed zabiegiem after operation po zabiegu p < 0.001 effective depth [mm]
głębokość otworu plamki [mm]
± SD ± SE MEAN
Fig. 4. “Maximum depth” parameter of the macular hole before and after vitrectomy
Ryc. 4. Maksymalna głębokość otworu plamki przed zabiegiem witrektomii i po nim
0.00 0.04 0.08 0.12 0.16 0.20 0.24
0.28 p < 0.0001
before operation przed zabiegiem
after operation po zabiegu maximum depth [mm]
maksymalna głębokość otworu plamki [mm]
± SD ± SE MEAN
Fig. 5. “Volume below” parameter of the macular hole before and after vitrectomy
Ryc. 5. Objętość otworu plamki przed zabiegiem witrektomii i po nim
0.005 0.015 0.025 0.035 0.045
0.055 p < 0.0001 ± SD
± SE MEAN before operation przed zabiegiem after operation po zabiegu volume below surface [mm ]3
References
[1] Mester V, Kuhn F: Internal limiting membrane removal in the management of full−thickness macular holes. Am J Ophthalmol 2000, 129, 769–777.
[2] Simcock PR, Scalia S: Phaco−vitrectomy for of full−thickness macular holes. Acta Ophthalmol Scand 2000, 78, 684–686.
[3] Kelly NE, Wendel RT: Vitreous surgery for idiopatic macular holes. Results of a pilot study. Arch Ophthalmol 1991, 109, 654–659.
[4] Smiddy WE, Pimentel S, Williams GA: Macular hole surgery without using adjunctive additives. Ophthalmic Surg Lasers 1997, 28, 713–717.
[5] Wendel RT, Patel AC, Kelly NE, Salzano TC, Wells JW, Novack GD: Vitreous surgery for macular holes. Ophthalmology 1993,100 (11), 1671–1676.
[6] Akiba J, Ischiko S, Hikihi T, Ogasawara H, Yanagiya N, Yoshida A: Imaging of epiretinal membranes in mac− ular holes by scanning laser ophthalmoscopy. Am J Ophthalmol 1996, 121, 177–180.
[7]American Academy of Ophthalmology: Optic nerve head and retinal nerve fiber layer analysis. Ophthalmic pro− cedure preliminary assessment. Ophthalmology 1999, 1414–1424.
[8]Operation Manual for the Heidelberg Retina Tomograph. Software Version 2.01 Heidelberg, Germany, Heidelberg Engineering, 1999.
[9] Beausencourt E, Elsner AE, Hartnett ME, Trempe CL: Quantitative analysis of macular holes with scanning laser tomography. Ophthalmology. 1997, 104 (12), 2018–2029.
[10] Kobayashi H, Kanai K, Sakaue H, Kurimoto Y, Kondo T: Precise measurement of macular hole using confo− cal scanning laser ophthalmoscope. Invest Ophthalmol Vis Sci 1994, 35 [Suppl], 1711.
[11] Konno S, Takeda M., Yanagiva N, Akiba J, Yoshida A: Three−dimensional analysis of macular diseases with a scanning retinal thickness analyzer and a confocal scanning laser ophthalmoscope. Ophthalmic Surg Lasers 2001, 32, 95–99.
[12] Weinberger D, Stiebel H, Gaon DD, Priel E, Yassur Y: Three−dimensional measurements of idiopathic macu− lar holes using scanning laser tomograph. Ophthalmology 1995, 102, 1445–1449.
[13] Hudson C, Charles SJ, Flanagan JG, Brahma AK, Turner GS, McLeod D: Objective morphological assess− ment of macular hole surgery by scanning laser tomography. Br J Ophthalmol 1997, 81, 107–116.
[14] Kobayashi H, Kobayashi K: Correlation of quantitative three−dimensional measurements of macular hole size with visual acuity after vitrectomy. Graefe’s Arch Clin Exp Ophthalmol 1999, 237, 283–288.
[15] Kobayashi H, Kobayashi K: Quantitative measurements of changes of idiopathic stage 3 macular holes after vit− rectomy using confocal scanning laser tomography. Graefe’s Arch Clin Exp Ophthalmol 2000, 238, 410–419. [16] Byhr E, Lindblom B: Preoperative measurement of macular hole with scanning laser ophthalmoscopy.
Correlation with functional outcome. Acta Ophthalmol Scand. 1998, 76 (5), 579–583.
Address for correspondence:
Patrycja Krzyżanowska
Klinika Okulistyki AM we Wrocławiu ul. Chałubińskiego 2a
50−368 Wrocław Tel. +48 71−7842427 Fax: +48 71−7841583
email: [email protected]
Conflict of interest: None declared
Received: 3.01.2006 Revised: 10.02.2006 Accepted: 16.10.2006
Praca wpłynęła do Redakcji: 3.01.2006 r. Po recenzji: 10.02.2006 r.