www.ijper.org
Internal factors Affecting Academic Performance
among Pharmacy Students in Malaysian Public
Institutions of Higher Learning
Norazrina Azmi, Adliah Mhd Ali*, Xiao-Lian Wong, Endang Kumolosasi, Jamia Azdina Jamal and Thomas Paraidathatu
Faculty of Pharmacy, Universiti Kebangsaan Malaysia, Jalan Raja Muda Abdul Aziz, 50300 Kuala Lumpur
ABSTRACT
Introduction: Several factors have been found to affect university students from achieving and maintaining good academic performance. Therefore, the objective of this study was to evaluate the internal factors that affect pharmacy students’ academic performance and to determine whether these factors have significant effect on their Cumulative Grade Point Average (CGPA) and year of study. Method: A questionnaire consisted of 47 items was used as the survey instrument in this study. A total of 1,018 pharmacy students from five Malaysian public institutions of higher learning participated in this study. Result: The result of the study showed that students’ academic performance (CGPA) was significantly associated (p<0.05) with academic competency, test competency, time management skills, neuroticism and test anxiety. Academic competence, test competence, time management skills and test anxiety significantly (p<0.05) affect students with different ranks of CGPA. There was a significant difference (p<0.05) in conscientiousness level among second, third and fourth years’ pharmacy students. Post hoc analysis indicated that significant difference was noted in the conscientiousness level between the second year students compared to fourth year students. In conclusion, academic competence, test competence, time management skills and test anxiety were important factors that were associated with students’ academic performance.
Keywords: Pharmacy education, academic performance, pharmacy students, internal factors.
DOI: 10.5530/ijper.48.3.5
Address for correspondence:
Dr. Adliah Mhd Ali
Faculty of Pharmacy, Universiti Kebangsaan Malaysia, Jalan Raja Muda Abdul Aziz, 50300 Kuala Lumpur, Malaysia Phone: +603 92897964 Fax: +603 26983271 E-mail: adliah@pharmacy. ukm.my
INTRODUCTION
In order to become a successful future pharmacist, a pharmacy student should acquire important qualities such as empa-thy and social skills which includes
com-munication skills and teamwork.1 Students
who acquired these qualities were more likely able to work effectively with the other health care providers in managing
patient care.2 Academic performance has
also been demonstrated to be one of the important factors associated with career
success in the future.3 Academic
compe-tence, test compecompe-tence, time management skills, study strategies and test anxiety have been identified as important factors that may affect students’ academic
perfor-mance.1 Students’ personality traits such as conscientiousness, extraversion and neu-roticism have also been found to affect
students’ academic performance.4 These
factors could be used by the academic administrators of the faculty to develop strategies in improving students’ academic
performance.1
insti-tutions of higher learning. We hypothesized that stu-dents with different ranks of cumulative Grade Point Average (CGPA) and in different years of study have different analytical and thinking skills as well as differ-ent levels of stress and confidence. Therefore, the dif-ferences in these factors with different ranks of CGPA and among second, third and fourth year students were measured.
MATERIALS AND METHODS
Subject
This cross-sectional survey was conducted by distrib-uting the questionnaires to the pharmacy students at five Malaysian Public Institutions of Higher Learning which offer Bachelor of Pharmacy (B. Pharm.) degree; University Kebangsaan Malaysia (UKM), Interna-tional Islamic University Malaysia (IIUM), University Teknologi MARA (Ui TM), University of Malaya (UM) and University of Science Malaysia (USM).Convenience sampling was used and all the students from the study population were enrolled as the study subjects. First year students were excluded due to unavailability of CGPA during the study period. The participation in this study was voluntary. This study was approved by the UKM Research Ethics Committee with the approval code of NF-035-2012.
Survey instrument
The survey instrument consisted of 47 items and were divided into Section A and B. Section A consisted of 7 questions consisting of demographic data while Sec-tion B consisted of 40 selected items adapted from previous studies to measure the factors that would
affect pharmacy students’ academic performance.1,4
Section B consisted of 35 items which were used to measure academic competence, test competence, time management skills, study strategies, conscientious-ness, extraversion and neuroticism. Academic com-petence, test comcom-petence, time management skills and study strategies were measured using a validated scale from the Study Management and Academic
Results Test (SMART) by Kleijn and colleagues.5 The
inventory used to assess conscientiousness, extraver-sion and neuroticism was adapted from the Revised NEO Personality Inventory (NEO-PI-R) by Costa
and McCrae.6 All of the items were measured using
5-point Likert scale ranging from 1 (strongly disagree) to 5 (strong agree). Section B consisted of 5 items which were used to measure test anxiety. The scale used to measure test anxiety was adapted from the Test Anxiety Scale (TAS)by Sarason.7 All of the items were measured using a 5-point Likert scale ranging
from 1 (not at all typical of me) to 5 (very much typi-cal of me).
A pilot study was conducted by distributing the ques-tionnaires to 30 pharmacy students from UKM which comprised of 10 pharmacy students from second, third and fourth year respectively for face validity. Minor modifications were made and these 30 phar-macy students were not included into the study. The data obtained were coded and analysed using Statistical Package for Social Sciences (SPSS) version
20.0. The alpha level (p value) was set as 0.05which
indicates significant relationship when p<0.05. The questionnaire was self-administered by subjects and analysed anonymously. The self-reported CGPA was used as an academic performance indicator. Accord-ing to the current system, students must maintain their CGPA above 2.00 for continuation of enrolment in the programme. CGPA less than 2.50 was considered as poor, intermediate when the value falls between 2.50 to 2.99, good: 3.00 to 3.66 and excellent: 3.67 to 4.00.The statistical analysis used to analyse the data included descriptive statistics, Spearman’s correla-tion analysis, Kruskal-Wallis H and Mann-Whitney U tests. Items 9, 10, 11, 12, 23, 28, 29, 30, 31, 32 and 35 in section B were reverse-coded during statisti-cal analysis to indicate better outcomes with higher scores.
RESULTS
Reliability
Data obtained from the pilot study was analysed for reli-ability by calculating Cronbach’s alpha. The Cronbach’s alpha obtained from the pilot study was 0.709. A score of 0.7 and above indicates acceptable reliability.8
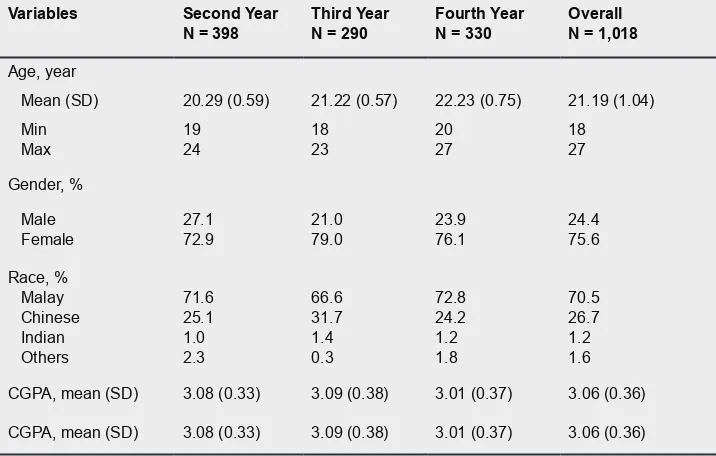
Demographic data
A total of 1,650 questionnaires were distributed and only 1,220 questionnaires (73.9%) were returned to the researcher. From the total of 1,220 returned question-naires, only 1,018 were included in the final analysis. Two hundred and two questionnaires were excluded due to incomplete data. It has been found that 398 of the subjects were second year students, 290 sub-jects’ were third year students and 330 subjects were fourth year students (Table 1). The overall mean age of the respondents was 21.19 ± 1.04. Majority of the respondents were Malays (70.5%) and females (75.6%). The mean CGPA was 3.06 ± 0.36. Statistical analyses showed that age and gender were not significantly
asso-ciated with CGPA (p>0.05) but race and the year of
Internal factors affecting academic performance:
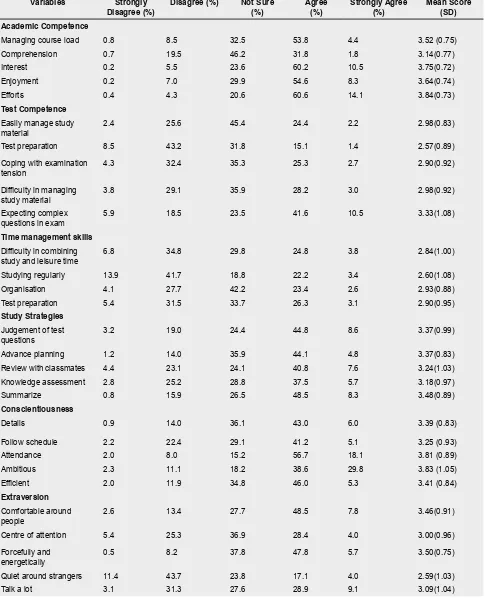
The mean score of academic competence was 3.58 ± 0.49. Table 2 showed that 58.2% of the students were able to manage their course loads (agree and strongly agree). Majority of the students (70.7%) found that their course materials were interesting (agree and strongly agree) while 74.7% of the students indicated that they need to put effort to understand the course materials being taught (agree and strongly agree).
The results showed that the mean score of test compe-tence was 2.95 ± 0.53 (Table 2). Half of the students (51.7%) indicated that they had difficulty to prepare for examinations (disagree and strongly disagree).One third of the students (36.7%) were not able to cope with the examination tension (disagree and strongly disagree) while 32.9% of the students had difficulty in managing the amount of study material for examination (disagree and strongly disagree).
The mean score of time management skills was 2.82 ± 0.71. Only a small proportion of the students (28.6%) indicated that they could organise their study and lei-sure time easily (agree and strongly agree) while 55.6% of the students were having difficulty to study regularly (disagree and strongly disagree). Some of the students (29.4%) reported that they always started to prepare for an examination well in advance (agree and strongly agree).
The mean score of study strategies was 3.33 ± 0.57. Less than half of the students (48.4%) would review their course materials with their classmates while studying for
examinations (agree and strongly agree) while56.8% of the students indicated that they summarised the course materials in their own words (agree and strongly agree). The results showed that the mean score of conscien-tiousness was 3.54 ± 0.54. Majority of the students (74.8%) would try to attend lecture even when they were not feeling well (agree and strongly agree). Less than half of the students (49.0%) indicated that they paid attention to details (agree and strongly agree) and 46.3% of the students followed schedule (agree and strongly agree). Most of the students (68.4%) were ambitious (agree and strongly agree).
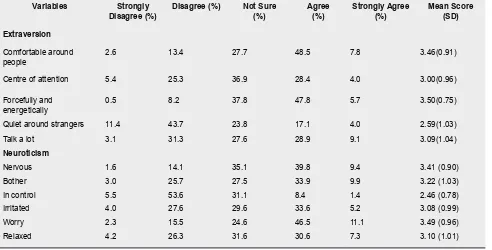
The mean score of extraversion was 3.13 ± 0.59. More than half of the students (56.3%) reported that they felt comfortable around people (agree and strongly agree) while 53.5% of the students acted forcefully and ener-getically (agree and strongly agree). The results indicated that 55.1% of the students were quiet around strangers (disagree and strongly disagree).
Statistical analysis showed that the mean score of neu-roticism was 3.13 ± 0.52. Over half of the students (57.6%) reported that they were worried about things (agree and strongly agree) while 59.1% of the students were always in control of themselves (disagree and strongly disagree. The results revealed that 30.5% of the students were relaxed most of the time (disagree and strongly disagree).
Test anxiety
The mean score of test anxiety was 3.08 ± 0.70. One third of the students (31.6%) were nervous during
Table 1: Respondents’ demographic characteristic
Variables Second Year
N = 398 Third YearN = 290 Fourth YearN = 330 OverallN = 1,018
Age, year
Mean (SD) 20.29 (0.59) 21.22 (0.57) 22.23 (0.75) 21.19 (1.04) Min
Max 1924 1823 2027 1827
Gender, % Male
Female 27.172.9 21.079.0 23.976.1 24.475.6 Race, %
Malay Chinese Indian Others
71.6 25.1 1.0 2.3
66.6 31.7 1.4 0.3
72.8 24.2 1.2 1.8
Table 2: Pharmacy students’ responses to survey
Variables Strongly
Disagree (%) Disagree (%) Not Sure(%) Agree(%) Strongly Agree(%) Mean Score (SD) Academic Competence
Managing course load 0.8 8.5 32.5 53.8 4.4 3.52 (0.75)
Comprehension 0.7 19.5 46.2 31.8 1.8 3.14(0.77)
Interest 0.2 5.5 23.6 60.2 10.5 3.75(0.72)
Enjoyment 0.2 7.0 29.9 54.6 8.3 3.64(0.74)
Efforts 0.4 4.3 20.6 60.6 14.1 3.84(0.73)
Test Competence Easily manage study
material 2.4 25.6 45.4 24.4 2.2 2.98(0.83)
Test preparation 8.5 43.2 31.8 15.1 1.4 2.57(0.89)
Coping with examination
tension 4.3 32.4 35.3 25.3 2.7 2.90(0.92)
Difficulty in managing
study material 3.8 29.1 35.9 28.2 3.0 2.98(0.92)
Expecting complex
questions in exam 5.9 18.5 23.5 41.6 10.5 3.33(1.08)
Time management skills Difficulty in combining
study and leisure time 6.8 34.8 29.8 24.8 3.8 2.84(1.00)
Studying regularly 13.9 41.7 18.8 22.2 3.4 2.60(1.08)
Organisation 4.1 27.7 42.2 23.4 2.6 2.93(0.88)
Test preparation 5.4 31.5 33.7 26.3 3.1 2.90(0.95)
Study Strategies Judgement of test
questions 3.2 19.0 24.4 44.8 8.6 3.37(0.99)
Advance planning 1.2 14.0 35.9 44.1 4.8 3.37(0.83)
Review with classmates 4.4 23.1 24.1 40.8 7.6 3.24(1.03)
Knowledge assessment 2.8 25.2 28.8 37.5 5.7 3.18(0.97)
Summarize 0.8 15.9 26.5 48.5 8.3 3.48(0.89)
Conscientiousness
Details 0.9 14.0 36.1 43.0 6.0 3.39 (0.83)
Follow schedule 2.2 22.4 29.1 41.2 5.1 3.25 (0.93)
Attendance 2.0 8.0 15.2 56.7 18.1 3.81 (0.89)
Ambitious 2.3 11.1 18.2 38.6 29.8 3.83 (1.05)
Efficient 2.0 11.9 34.8 46.0 5.3 3.41 (0.84)
Extraversion Comfortable around
people 2.6 13.4 27.7 48.5 7.8 3.46(0.91)
Centre of attention 5.4 25.3 36.9 28.4 4.0 3.00(0.96)
Forcefully and
energetically 0.5 8.2 37.8 47.8 5.7 3.50(0.75)
Quiet around strangers 11.4 43.7 23.8 17.1 4.0 2.59(1.03)
Talk a lot 3.1 31.3 27.6 28.9 9.1 3.09(1.04)
Table 2: Pharmacy students’ responses to survey (Continue ....) Variables Strongly
Disagree (%) Disagree (%) Not Sure(%) Agree(%) Strongly Agree(%) Mean Score (SD) Extraversion
Comfortable around
people 2.6 13.4 27.7 48.5 7.8 3.46(0.91)
Centre of attention 5.4 25.3 36.9 28.4 4.0 3.00(0.96)
Forcefully and
energetically 0.5 8.2 37.8 47.8 5.7 3.50(0.75)
Quiet around strangers 11.4 43.7 23.8 17.1 4.0 2.59(1.03)
Talk a lot 3.1 31.3 27.6 28.9 9.1 3.09(1.04)
Neuroticism
Nervous 1.6 14.1 35.1 39.8 9.4 3.41 (0.90)
Bother 3.0 25.7 27.5 33.9 9.9 3.22 (1.03)
In control 5.5 53.6 31.1 8.4 1.4 2.46 (0.78)
Irritated 4.0 27.6 29.6 33.6 5.2 3.08 (0.99)
Worry 2.3 15.5 24.6 46.5 11.1 3.49 (0.96)
Relaxed 4.2 26.3 31.6 30.6 7.3 3.10 (1.01)
Table 3: Pharmacy students’ responses to survey questions to measure test anxiety
Variables Not at all typical of me
(%)
Not very typical of me
(%)
Somewhat typical of me
(%)
Fairly typical of me
(%)
Very much typical of me
(%)
Mean Score (SD)
Failure to perform better 5.4 15.1 35.5 33.4 10.6 3.29 (1.02)
Nervousness 5.7 27.8 34.9 26.4 5.2 2.98 (0.99)
Task-irrelevant cognitions 13.8 34.6 31.8 16.8 3.0 2.61 (1.02)
Panicky 9.1 25.9 34.4 24.2 6.4 2.93 (1.06)
Anxious even when
well-prepared 2.9 10.2 26.5 42.9 17.4 3.62 (0.98)
Test anxiety = 3.08 (0.70)
examinations until they forgot the facts that they knew (fairly typical of me and very much typical of me) (Table 3). Most of the students (60.3%) found that they were very anxious even when they were well prepared for a test (fairly typical of me and very much typical of me).
Relationship between the factors measured and academic performance
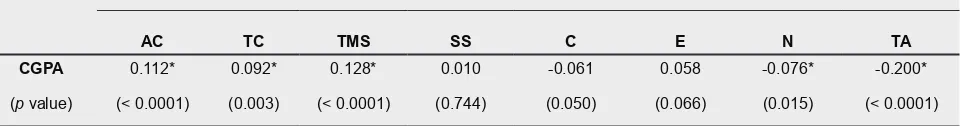
The results showed that the pharmacy students’ aca-demic performance (CGPA) was significantly (p<0.05) associated with academic competence, test competence, time management skills, neuroticism and test anxiety although the correlation coefficients were fairly weak (Table 4). Academic competence, test competence and
time management skills were found to be positively associated with academic performance while neuroti-cism and test anxiety were negatively associated with academic performance. However, academic perfor-mance (CGPA) was not significantly associated with study strategies, conscientiousness and extraversion.
Differences in the factors measured among students with different ranks of CGPA
Among the 1,018 respondents, 51 students were in the rank of poor academic performance while 350 stu-dents, 580 students and 37 students were in the ranks of intermediate, good and excellent academic
Table 4: Spearman’s correlation analysis to predict the association between the factors measured with students’ academic performance (CGPA)
Spearman’s Correlation Coefficients (p value)
AC TC TMS SS C E N TA
CGPA 0.112* 0.092* 0.128* 0.010 -0.061 0.058 -0.076* -0.200*
(p value) (< 0.0001) (0.003) (< 0.0001) (0.744) (0.050) (0.066) (0.015) (< 0.0001) *Significant at p<0.05
CGPA = Cumulative Grade Point Average; AC = Academic Competence; TC = Test Competence; TMS = Time Management Skills; SS = Study Strategies; C = Conscientiousness; E = Extraversion; N = Neuroticism; TA = Test Anxiety
Table 5: Differences in factors among students with different ranks of CGPA
Kruskal-Wallis H Test(mean rank)
AC TC TMS TA
CGPA Ranks
Poor Intermediate
Good Excellent
449.75 477.46 532.24 538.42
379.04 502.21 522.56 553.61
524.10 470.23 522.53 656.59
630.28 557.25 480.28 349.43
CGPA = Cumulative Grade Point Average; AC = Academic Competence; TC = Test Competence; TMS = Time Management Skills; TA = Test Anxiety
test competence (p=0.006), time management skills
(p=0.001) and test anxiety (p< 0.0001) were found to have significant difference (p<0.05) among students with different ranks of CGPA. Study strategies, consci-entiousness, extraversion and neuroticism showed no significant difference (p>0.05) among students with dif-ferent ranks of CGPA.
Table 5 showed that students with excellent academic performance had the highest academic competence (mean rank=538.42) while students with poor aca-demic performance had the lowest acaaca-demic compe-tence (mean rank=449.75). The results of post hoc analysis indicated that students with intermediate and good academic performance were significantly different (p=0.005).
The test competence of students with poor academic performance was the lowest (mean rank=379.04) among all the ranks of CGPA while students with excellent academic performance had the highest test competence (mean rank=553.61). Students with poor and
interme-diate academic performance (p=0.004), poor and good
academic performance (p=0.001) and poor and
excel-lent academic performance (p=0.007) were significantly different as shown by post hoc analysis.
Students with excellent academic performance dem-onstrated the best time management skills (mean rank=656.59). The poorest time management skills were shown by students with intermediate academic performance (mean rank = 470.23). Post hoc analysis reported that students with poor and excellent
aca-demic performance (p=0.024), intermediate and good
academic performance (p=0.009), intermediate and
excellent academic performance (p<0.0001) and good
and excellent academic performance (p=0.008) differed
significantly.
Statistical analysis showed that students with poor academic performance had the highest test anxiety (mean rank=630.28) while students with excellent academic performance had the lowest test anxiety (mean rank=349.43). Students with poor and good academic performance (p<0.0001), poor and excellent
academic performance (p<0.0001), intermediate and
good academic performance (p<0.0001), intermediate
and excellent academic performance (p<0.0001) and
good and excellent academic performance (p=0.005)
Differences in the factors measured among second, third and fourth years’ students
There was a significant difference (p<0.05) in
consci-entiousness (p=0.002) among second, third and fourth
years’ pharmacy students. Second year students were shown to have the highest conscientiousness level (mean rank = 544.80), followed by third year students (mean rank = 507.18) while fourth year students had the lowest level of conscientiousness (mean rank = 468.97). The results of post hoc analysis indicated that second year and fourth year students differed signifi-cantly (p<0.0001). However, academic competence, test competence, time management skills, study strategies, extraversion, neuroticism and test anxiety were found to have no significant difference (p>0.05) among second, third and fourth years’ pharmacy students.
DISCUSSION
Academic competence, test competence, good time management skills were found to be associated with academic performance. The positive association of academic competence with academic performance indi-cates that the students think it is important to manage their course material effectively to ensure improvement in their academic performance. Studies from Sansgiry et al.1 and Kleijn et al.5 have also reported similar findings. Time management skills significantly associated with academic performance, which was similar to the previ-ous studies.5, 9-13 Many students reported that they had difficulty organising their study and leisure time. This may be attributed to the extensive course load and stress associated with examinations or tests.1 it’s believed that students may achieve academic success with better time management skills.14
Study strategies were not associated with their academic performance which was consistent with the study by
Sansgiry and colleagues.1 Although extraversion was
found not to affect students’ academic performance, however the finding was inconsistent with the previous studies.4,15
Extraversion was negatively associated with academic performance and found similar to the previous stud-ies.4,16,17 This finding can be due to the neurotic charac-teristic of the students which is anxiety, especially under stressful conditions such as examinations or tests.18,19 Based on the result obtained, test anxiety was shown to be negatively associated with academic performance. The finding is consistent with some of the previous studies.7,18,20-22 Therefore, the academic administrators of the faculty could organise stress management pro-grams to reduce the stress levels of students and assist
them to overcome anxiety in order to help them to
improve their academic performance.22
Academic competence, test competence, time manage-ment skills and test anxiety were found to be the impor-tant factors which might help to distinguish students with different ranks of CGPA (academic performance). This indicates that students with good academic
compe-tence,5 high test competence,1 good time management
skills12 and low test anxiety20 will achieve higher CGPA. This is supported by the results of this study which showed that students with excellent academic perfor-mance had the highest academic and test competence, best time management skills and lowest test anxiety among students with all ranks of CGPA. Students with poor academic performance were shown to have the lowest academic and test competence and highest test anxiety. This may be due to the poor ability of these students to manage their academic course load and they may have difficulty in coping with the study materials for examinations or tests.1 However, in this study, stu-dents with poor academic performance demonstrated better time management skills than students with inter-mediate and good academic performance. It is possible that students with poor academic performance have the wrong perception about good time management. Our study found that the year of study would not affect academic performance based on the factors measured except for conscientiousness.
It is evident that academic competence, test compe-tence, time management skills, neuroticism and test anxiety would affect students’ academic performance. Similarly, students with good academic performance have better control of academic competence, test com-petence, time management skills and test anxiety.
CONCLUSION
It is evident that academic competence, test compe-tence, time management skills, neuroticism and test anxiety would affect students’ academic performance. Similarly, students with good academic performance have better control of academic competence, test com-petence, time management skills and test anxiety.
ACKNOWLEDGMENT
ABBREVIATION
CGPA Cumulative Grade Point Average
BPharm Bachelor of Pharmacy
UKM Universiti Kebangsaan Malaysia
IIUM International Islamic University Malaysia
UiTM Universiti Teknologi MARA
UM University of Malaya
USM University of Science Malaysia
SMART Study Management and Academic
Results Test
NEO-PI-R Revised NEO Personality Inventory
TAS Test Anxiety Scale
CONFLICT OF INTEREST
There is no conflict of interest to declare for this study.
REFERENCES
1. Sansgiry SS, Bhosle M, Sail K. Factors that affect academic performance among pharmacy students. American Journal of Pharmaceutical Education. 2006; 70(5): Article 104.
2. Lust E, Moore F. Emotional intelligence instruction in a Pharmacy Communications Course. American Journal of Pharmaceutical Education. 2006; 70: Article 6.
3. Womble LP. Impact of stress factors on college students’ academic performance. Undergraduate Journal of Psychology. 2003; 16: 21–34. 4. Chamorro-Premuzic T, Furnham, A. Personality traits and academic
examination performance. European Journal of Personality. 2003; 17(3): 237–50.
5. Kleijn W, Ploeg H, Topman R. Cognition, study habits, test anxiety, and academic performance. Psychological Reports. 1994; 75(3): 1219–26. 6. Costa PT, McCrae RR. Revised NEO Personality Inventory (NEO-PI-R)
and NEO Five-Factor Inventory (NEO-FFI) Professional Manual. Florida: Psychological Assessment Resources; 1992.
7. Sarason IG. The test anxiety scale: Concept and research. In Spielberger CD, Sarason IG. (Eds.). Stress and anxiety. Washington: Hemisphere Publishing Corporation 1978. Vol. 5:
8. Kerlinger FN, Lee HB. Foundations of behavioral research. Vol. 4. London: Wadsworth Thompson Learning; 2000.
9. Noftle EE, Robins RW. Personality predictors of academic outcomes: Big five correlates of GPA and SAT scores. Journal of Personality and Social Psychology. 2007; 93(1): 116–30.
10. Campbell RL, Svenson LW. Perceived level of stress among university undergraduate students in Edmonton, Canada. Perceptual and Motor Skills. 1992; 75: 552–4.
11. Nonis SA, Hudson GI, Logan LB Ford CW. Influence of perceived control over time on college students’ stress and stress-related outcomes. Research in Higher Education. 1998; 39(5): 587–605.
12. Powell DH. Behavioural treatment of debilitating test anxiety among medical students. Journal of Clinical Psychology. 2004; 60: 853–65.
13. Trueman, M, Hartely, J. A comparison between the time management skills and academic performance of mature and traditional entry university students. Journal of Higher Education. 1996; 32(2): 199–215.
14. Sansgiry S.S, Kawatkar AA, Dutta A.P, Bhosle M.J. Predictors of academic performance at two universities: the effects of academic progression. American Journal of Pharmaceutical Education. 2004. 68(4): Article 103. 15. Furnham A, Chamorro-Premuzic T. McDougall J. Personality, cognitive
ability and beliefs about intelligence as predictors of academic performance. Learning and Individual Differences. 2002;14(1): 47–64.
16. Furnham A, Mitchell J. Personality, needs, social skills and academic achievement: a longitudinal study. Personality and Individual Differences. 1991; 12: 1067–73.
17. Seipp B. Anxiety and academic performance: a meta-analysis of findings. Anxiety Research. 1991; 4 (1): 27–41.
18. Chamorro-Premuzic T, Furnham A. Neuroticism and ‘special treatment’ in university examinations. Social Behavior and Personality. 2002; 30: 807–13. 19. Hollandsworth JG, Glazeski RC, Kirkland K, Jones GE, VanNorman LR.
An analysis of the nature and effects of test anxiety. cognitive, behavioral, and physiological components. Cognitive Therapy and Research. 1979; 3: 165–80.
20. Kivimaki M. Test anxiety, below-capacity performance, and poor test performance: intra subject approach with violin students. Personal Individual Differences. 1995; 18(1) : 47–55.
21. Zeidner M, Klingman A, Papko O. Enhancing student’s test coping skills: Report of a Psychological Health Education Program . Journal of Educational Psychology. 1988; 80: 95–101.