University of New Orleans University of New Orleans
ScholarWorks@UNO
ScholarWorks@UNO
University of New Orleans Theses and
Dissertations Dissertations and Theses
8-9-2006
Nanopore Detector Feedback Control Using Cheminformatics
Nanopore Detector Feedback Control Using Cheminformatics
Methods Integrated with Labview/Labwindows Tools
Methods Integrated with Labview/Labwindows Tools
Srikanth Sendamangalam
University of New Orleans
Follow this and additional works at: https://scholarworks.uno.edu/td
Recommended Citation Recommended Citation
Sendamangalam, Srikanth, "Nanopore Detector Feedback Control Using Cheminformatics Methods Integrated with Labview/Labwindows Tools" (2006). University of New Orleans Theses and Dissertations. 412.
https://scholarworks.uno.edu/td/412
This Thesis is protected by copyright and/or related rights. It has been brought to you by ScholarWorks@UNO with permission from the rights-holder(s). You are free to use this Thesis in any way that is permitted by the copyright and related rights legislation that applies to your use. For other uses you need to obtain permission from the rights-holder(s) directly, unless additional rights are indicated by a Creative Commons license in the record and/or on the work itself.
NANOPORE DETECTOR FEEDBACK CONTROL USING CHEMINFORMATICS METHODS INTEGRATED WITH LABVIEW / LABWINDOWS TOOLS
A Thesis
Submitted to the Graduate Faculty of the University of New Orleans
in partial fulfillment of the requirements for the degree of
Master of Science in
Computer Science
by
Srikanth Sendamangalam
B.E. Annamalai University
ACKNOWLEDGEMENTS
I take this opportunity to thank my thesis advisor Dr. Stephen Winters-Hilt. I thank him for
giving me the freedom to explore the various possibilities in this fast growing field. I would also
like to take this opportunity to thank my thesis committee members, Dr. Yixin Chen and Dr. Bin
Fu. I also thank Dr. Shengru Tu, graduate coordinator, Department of Computer Science, UNO
for guiding me all through my Master’s program. I would also like to thank Dr. Mahdi
Abdelguerfi, Chairman, Department of Computer Science, University of New Orleans, for his
support. I would also like to express my gratitude to all the other professors in the department.
I would also like to express my appreciation to all my colleagues at Children’s Hospital, New
Orleans who helped me a lot understanding the chemistry behind the experiment. I also thank the
software team at UNO who helped me with the interfacing of external code.
TABLE OF CONTENTS
LIST OF FIGURES ...v
ABSTRACT...vi
1. INTRODUCTION ...1
2. BACKGROUND ...2
2.1 The highly stable, nanometer-scale,α-hemolysin protein channel ...2
2.2 Noise in acquired signal ...5
2.2.1 White noise ...5
2.2.2 Thermal noise ...5
2.2.3 Membrane Noise ...5
2.2.4 Device Noise ...6
2.2.5 Nanopore Noise Sources...6
2.3 Choice of Aperture...8
2.4 Data Acquisition System ...8
2.4.1 Hardware...9
2.4.2 Software ...9
2.5 LabVIEW ...10
2.6 LabWindows/CVI ...11
3. METHODS ...13
3.1 LabVIEW architecture ...13
3.1.1 Circular Buffer ...13
3.1.2 LabVIEW prototype design ...14
3.1.3 Disadvantages...15
3.2 LabWindows Architecture...16
3.2.1 Multithreading ...17
3.2.2 Transmission Control Protocol...18
3.2.3 Prototype design of the Server ...19
3.2.4 Prototype design of the Client...20
3.3 Finite state automaton ...20
3.3.1 Reset Begin ...23
3.3.2 Reset End ...23
3.3.4 Bad eLevel ...24
3.3.5 Signal End ...24
4. RESULTS ...25
5. CONCLUSION ...28
6. REFERENCES...29
LIST OF FIGURES
Figure 2.1: Nanopore Detector...2
Figure 2.2: Overall Architecture ...4
Figure 2.3 Signal Trace...6
Figure 2.4 Power Spectra ...7
Figure 2.5: Hardware Setup ...8
Figure 2.6: Levels of processing in LabVIEW ...10
Figure 2.7: Program elements in LabWindows/CVI...12
Figure 3.1: Producer Consumer Loop ...13
Figure 3.2: Implementation of a Circular Buffer ...14
Figure 3.3: Prototype design ...15
Figure 3.4: Block Diagram of the LabVIEW prototype ...16
Figure 3.5: Multithreading application ...17
Figure 3.6: TCP diagram ...18
Figure 3.7: LabWindows Server Screen Shot ...19
Figure 3.8: LabWindows Client Screen Shot ...20
Figure 3.9: Sampling protocol...21
Figure 3.10:τ - Finite State Automaton Flow Chart ...22
Figure 3.11: Signal levels forτ - Finite State Automaton ...23
Figure 4.1: LabVIEW code...25
Figure 4.2: 9GC hairpin molecule screen shot in LabWindows ...26
ABSTRACT
Single biopolymers (DNA, RNA, or polypeptide) can be examined using an alpha-hemolysin
channel detector. When a biopolymer is present in an alpha-hemolysin channel it can produce a
highly structured ionic current blockade pattern, where the lifetimes at various sub-blockade
levels reveal information about the kinetics of the biopolymer. Here we describe integration of
LabVIEW/LabWindows automation capabilities with the "in-house" Channel Current
Cheminformatics (CCC) software. Data acquired with LabVIEW/LabWindows is passed to the
CCC software, on a streaming real time basis, for analysis and classification. The classification
results are then quickly returned to the LabVIEW/LabWindows automation software for
experimental feedback control. The prototype signal processing architecture is designed to
rapidly extract useful information from noisy blockade signals. A fast, specially designed,
generic Hidden Markov Model can be used for the channel current feature extraction.
Classification of feature vectors obtained by the HMM can then be done by Support Vector
1. INTRODUCTION
LabVIEW is a powerful, graphical programming development system which is ideally suited for
data acquisition, storage, analysis, and presentation. LabVIEW is one of the best known data
acquisition and instrument control tool. It has rich libraries consisting of Input / Output, Analysis
and display. LabVIEW has development tools that include Control block diagrams, State
diagram, User interface programming. The control block diagrams can be used for designing
linear, nonlinear, discrete, and continuous control systems. A State diagram can be used for
defining multiple states and transition logic between them using a graphical state diagram
representation. While a User interface programming can be used for managing very complex
user interfaces.
In the nanopore detector LabVIEW is used to control the instrument settings in an on-line
feedback manner that is informed by LabVIEW passing information in and out of its software
environment into the CCC (Channel Current Cheminformatics) software environment. LabVIEW
can be used to control the voltage switching, temperatures changes, or laser modulations. This
provides bandwidth broadening capabilities to the nanopore instrument. LabVIEW is not limited
to the only controls stated above. Instead it can also be used to drive a Pico pump or to perfuse a
nanopore detector, to provide automated perfusion of the device all that is needed is a stepper
motor that can be controlled by LabVIEW. Moreover the integration capabilities of external code
to Lab VIEW broadens the application of LabVIEW in the nanopore detector as it becomes
possible to integrate the in-house software developed at UNO’s Biomedical Informatics and
2. BACKGROUND
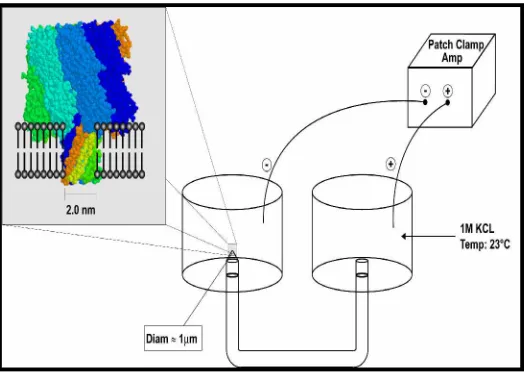
2.1 The highly stable, nanometer-scale,α-hemolysin protein channel
The α-hemolysin channel is a protein heptamer, formed by seven identical 33 kD protein
molecules secreted by Staphylococcus aureus. The total channel length is 10 nm and is
comprised of a 5 nm trans-membrane domain and a 5 nm vestibule that protrudes into the
aqueous cis compartment (Song et al., 1996). The narrowest segment of the pore is a 1.5
nm-diameter aperture (Song et al., 1996), see Fig. 1a. By comparison, a single strand of DNA is
about 1.3 nm in diameter. Given that water molecules are 0.15 nm in diameter; this means that
one hydration layer separates
Figure 2.1: Nanopore Detector
ssDNA from the amino acids in the limiting aperture. This places the charged phosphodiester
backbone, hydrogen bond donors and acceptors, and apolar rings of the DNA bases within one
Debye length (3 Å in 1 M KCl) of the pore wall. Not surprisingly, DNA and RNA strongly
interact with the α-hemolysin channel during translocation. Although dsDNA is too large to
translocate, about ten base-pairs at one end can still be drawn into the large cis-side vestibule.
This actually permits the most sensitive experiments to date, as the ends of “captured” dsDNA
Winters-Hilt and Akeson, 2004; Winters-Hilt et al., 2003; Winters-Hilt, 2003; Vercoutere et al.,
2003). For ssDNA translocation under normal operating conditions (Kasianowicz et al., 1996;
Akeson et al., 1999; Meller et al. 2000; Meller et al. 2001; Vercoutere, et al., 2001; Bezrukov,
2000; Bezrukov et al., 1994), approximately one nucleotide passes the limiting aperture of the
channel every microsecond, and a vigorous effort is underway to find ways to slow down and
control this translocation process (Meller et al. 2001).
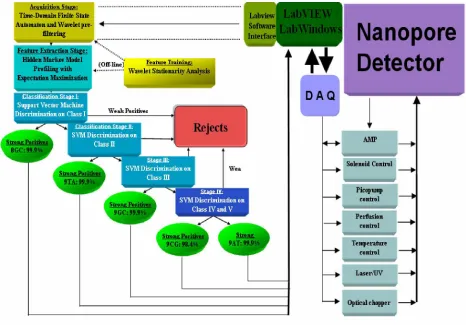
LabVIEW is used for acquiring the signal and LabVIEW makes use of its automation
capabilities with Channel Current Cheminformatics (CCC) software developed at UNO’s
Biomedical Informatics and Bioinformatics (BIB) Lab. Different tools are employed at each
stage of the signal analysis (as shown in Fig. 1b) in order to realize the most robust (and noise
resistant) tools for knowledge discovery, information extraction, and classification. Statistical
methods for signal rejection using SVMs are also employed in order to reject extremely noisy
signals. Since the automated signal processing is based on a variety of machine-learning
methods, it is highly adaptable to any type of channel blockade signal. This enables a new type
of informatics (cheminformatics) based on channel current measurements, regardless of whether
those measurements derive from biologically based or a semiconductor based channels.
LabVIEW is capable of running voltage driven experiments, which requires the switching of
voltages at a very high frequency. It is also used to modulate the temperature and the perfusion
of the nanopore detector can also be automated as soon as a channel is formed. The automation
of the perfusion device requires the use of a stepper motor which is controlled by LabVIEW.
Some of the other instruments that can be controlled by LabVIEW include an optical chopper
and a laser lamp. All the control equipment is driven by feedback originating from the nanopore
detector as shown in Figure 2.2 of the overall architecture of LabVIEW/LabWindows data
Figure 2.2: Overall Architecture
Support Vector Machines can also be integrated to LabVIEW/LabWindows using the integration
capabilities of LabVIEW. The SVM discriminators are trained by solving their KKT relations
using the Sequential Minimal Optimization (SMO) procedure (Platt, 1998). A chunking (Osuna
et al., 1997; Joachims, 1998) variant of SMO also is employed to manage the large training task
at each SVM node. The multi-class SVM training generally involves thousands of blockade
signatures for each signal class. The data cleaning needed on the training data is accomplished by
2.2 Noise in acquired signal
Noise can be defined as the addition of external factors to the signal. It is a disturbance that
affects the signal and it also distorts the information carried by the signal. Noise sources limit the
resolution of the nanopore detector, a lot of times noise serves as a signal that tells where the
noise is originating from. There are numerous sources of noise and there are also a variety of
them. The types of noises are many, one of them is AF noise emanating during moving, vibrating
or colliding of molecules in the pore. The nanopore detector itself is very sensitive to AF noise.
The main noise encountered in the nanopore detector is Gaussian Noise. Gaussian noise can be
explained further by white noise and thermal noise.
2.2.1 White noise
A White noise is a random signal with a flat power spectral density. The signal's power spectral
density has equal power in any band, at any centre frequency, having a given bandwidth. An
infinite-bandwidth white noise signal is a theoretical construct. By having power at all
frequencies, the total power of such a signal is infinite. In practice, a signal can be "white" with a
flat spectrum over a defined frequency band.
A Gaussian white noise is a good approximation of many real-world situations and it generates
mathematically tractable models. The values of a Gaussian white noise are independent.
2.2.2 Thermal noise
Thermal noise is an unwanted current or a voltage that is produced that is produced in electronic
equipment due to the agitation of electrons by heat. Thermal noise is also known as Johnson
noise, it has its roots in thermodynamics. Thermal noise is associated with the random movement
of free particles in the nanopore. Even though the random movements average to zero, there are
fluctuations about the average that constitute the thermal noise.
2.2.3 Membrane Noise
The fluctuations that are inherent in the biological membrane constitute the membrane noise.
to the random opening and closing of ion channels, that is the opening and closing of the mouth
of the nanopore due to the translocation causes the lipid bilayer membrane to go to a state of
excitation.
2.2.4 Device Noise
Electrical distortions are introduced in the system due to the electrical components that are used
in the experiment. For example an inductance is caused when two charged wires are close
together.
2.2.5 Nanopore Noise Sources
Noise cannot be eliminated altogether but it can be reduced by using appropriate compensation
circuits and there are various compensation systems which can be used to make the conditions
favorable to the user.
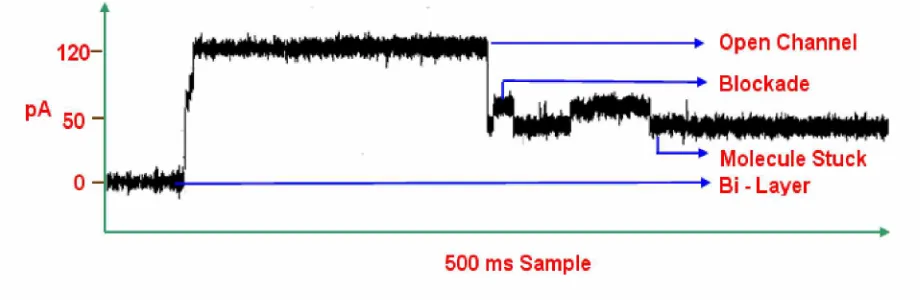
The accessible detector bandwidth is delimited by noise resulting from 1/f (flicker) noise,
Johnson noise, Shot noise, and membrane capacitance noise. Shown below is
Figure 2.3 Signal trace
a 500ms Sample of a 9GC hairpin capture, as illustrated in Figure 2.3 there are four current
spectral densities. We have the bi – layer at 0 pA and we see a sharp rise in current to 120 pA
which is a signature of the open channel. The toggles seen in Figure 2.3 occurs when the
molecule blocks the channel and when there is no motion of the molecule the toggles are absent,
channel conducts 120 pA under an applied potential of 120 mV. The thermal noise contribution
at the 1 G channel resistance has an RMS noise current of 0.4 pA. Shot noise is the result of
current flow based on discrete charge transport. During nanopore operation with 120pA current
(with 10KHz bandwidth) there is, similarly, about 0.6 pA noise due to the discreteness of the
charge flow. As with Johnson noise, the Shot noise spectrum is white. The power spectra for the
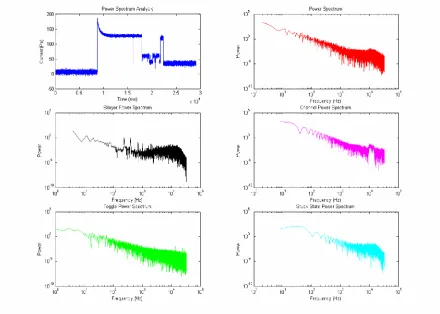
various current spectral densities is shown in the figure below
Figure 2.4: Power Spectra
It can be seen in the above power spectra plots that our accessible band width is limited by 1/f
noise. The complex toggling with stationary statistics (due to the stationarity of the physically
observed kinetics), tends to have a 1/f power spectrum at low frequencies. This is exhibited in
the power spectra plot of a toggle. A two-state Markovian toggling system has 1/f 2 power
2.3 Choice of Aperture
The specific capacitance of a lipid bilayer is approximately 0.8 F/cm2, and the specific
conductance is approximately 10-6 -1cm-2. In order for bilayer conductance to produce less
RMS noise current than fundamental noise sources, the leakage current must be a fraction of a
pA. This problem is solved by reducing to less than a 500 m2 bilayer area, for which less than
0.6 pA leakage current results and for which total bilayer capacitance is at most 4pF. This
indicates that a decrease in bilayer area by another magnitude is about as far as this type of noise
reduction can go. Hence the aperture ranges in size between 1 micron in diameter and 100
microns in diameter, where smaller apertures are used in the single channel experiments and
larger apertures in the multi-channel experiments.
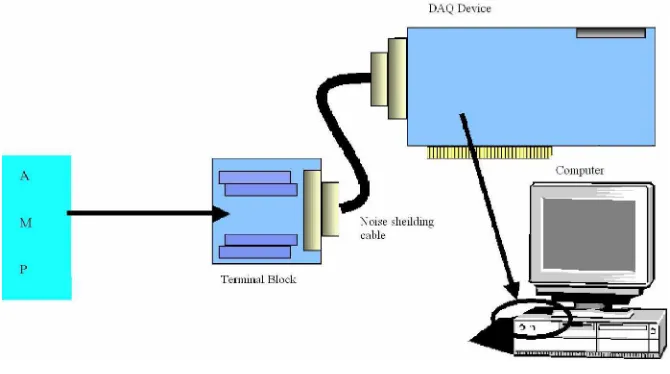
2.4 Data Acquisition System
The data acquisition (DAQ) system is a combination of tools and processes that are used to
gather analyze and record information about the phenomena in the nanopore device. The
hardware setup consists of a computer, data acquisition card and a break out box, a break out box
gives the user easy access to all the pins of the card. The card is connected to the breakout box
using a noise shielding cable.
Figure 2.5 Hardware Setup
2.4.1 Hardware
The hardware consists of an Analog to Digital converter which forms the core component of the
data acquisition system. The data acquisition card used in the experiment is manufactured by
National Instruments and it has an on board buffer which can store 512 samples. The card also
has two 12-bit analog outputs; 8 digital I/O lines; and two 24-bit counters. The card can sample
at a maximum of 500,000 samples per second.
2.4.2 Software
Data acquisition software is needed to communicate with the card and perform other operations.
The software chosen for this application was LabVIEW and LabWindows. The software serves a
lot of purposes some of them include, specifying a particular sampling rate, stream data to and
from disk, perform I/O operations, store, analyze and present data.
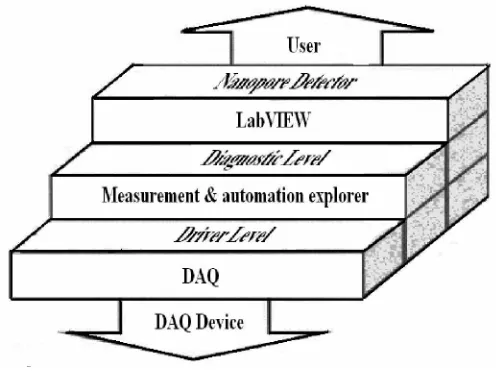
The data acquisition software involves three levels of processing: (shown in Figure 2.5) the
device driver level, the diagnostic level for measurement and automation setup, and the
LabVIEW user interface level to the Nanopore Detector Channel Current Cheminformatics
(CCC) software.
The DAQ is the data acquisition device which is manufactured by National Instruments,
Measurement & Automation explorer is a software interface to communicate with the Data
Acquisition device and it also serves to configure the data acquisition card. LabVIEW
communicates with the hardware and performs signal acquisition and also drives the feed back
Figure 2.6: Levels of processing in LabVIEW
2.5 LabVIEW
LabVIEW is a software tool for designing test, measurement, and control systems. LabVIEW
can be used to interface with real-world signals, analyze data for meaningful information, and
share results. Because LabVIEW has the flexibility of a programming language combined with
built-in tools designed specifically for test, measurement, and control, it is possible to create
applications that range from simple temperature monitoring to sophisticated simulation and
control systems.
LabVIEW has the performance, flexibility, and compatibility of a traditional programming
language such as C or BASIC. LabVIEW programming language has the same constructs that
traditional languages have -- variables, data types, looping, and sequencing structures as well as
error handling. And, with LabVIEW, it is possible to reuse legacy code packaged as DLLs or
shared libraries and integrate with other software using ActiveX, TCP, and other standard
technologies.
LabVIEW programs are known as Virtual Instruments because they imitate real instruments only
that they are Virtual Instruments. The LabVIEW program has three parts front panel, block
consists of functions for the controls in the front panel. The icon/connector is used to link the
various functions of the control in the block diagram.
LabVIEW software is used manage the flow of data into the computer and to provide feedback to
the experimental instrumentation. The various tasks that can be accomplished by LabVIEW are
shown in Figure 2.2 of the overall architecture of the data acquisition system.
2.6 LabWindows/CVI
LabWindows/CVI is a proven ANSI C integrated development environment that provides a
comprehensive set of programming tools for creating test and control applications. The main
advantage of using LabWindows is efficiency and maintainability, apart from the ease of
integrating external code without the hassles of a Dynamic Link Library. It is for the reason that
C is behind LabWindows, it makes it easy to write applications as fast as in LabVIEW, moreover
the choices are numerous when an application is programmed in C.
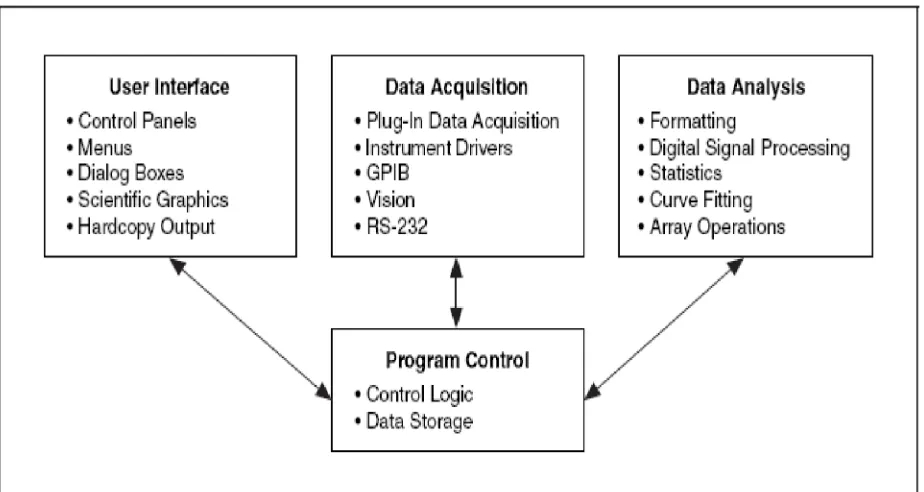
LabWindows/CVI applications include the following elements:
• User interface
• Data acquisition
• Data analysis
• Program control
The relationship between the various program elements is shown in Figure 2.6. In
LabWindows/CVI control elements receive input from the user interface, data acquisition, and
data analysis elements.
Each element has various components in them for example one can use LabWindows/CVI to
create user interfaces that contain graphs, menus etc. A user interface editor can be used to create
In LabWindows/CVI, the user interface that is created can be used to control the data acquisition
(DAQ) device. The user interface also displays the acquired data. After the data is acquired, the
next phase involves the analysis of the acquired data. The analysis of the acquired data is
performed by the in house software (Channel Current Cheminformatics tools are used). Initially
the time domain finite state automaton is used to detect the start and end of a blockade and the
CCC software tools which are used later involves a variety of machine learning algorithms, each
chosen to provide robust noise-resistant signal analysis at various stages of the signal analysis
Figure 2.7: Program elements in LabWindows/CVI
.The program control portion of the program coordinates the user interface, data acquisition, and
data analysis. The program control contains the logic for managing the flow of program
execution and user defined functions.
The callback functions help to control the flow of applications. They enable the program to
3. METHODS
3.1 LabVIEW architecture
Initially LabVIEW was used as the main tool to acquire and process data, but later on due to
certain difficulties discussed below a change in the environment was adopted. The basic design
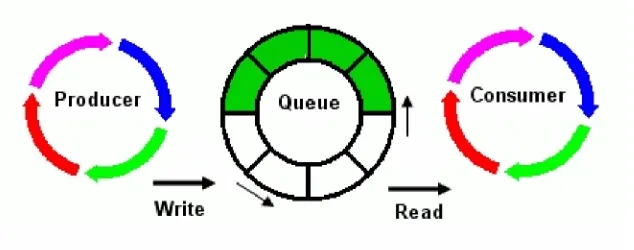
of the system was modeled on a state machine with a producer consumer loop.
Figure 3.1: Producer Consumer Loop
In the above design, data is read continuously from a circular buffer and the producer loop
performs the I/O operation, while the consumer loop performs the plotting and other operations
like data processing and control applications.
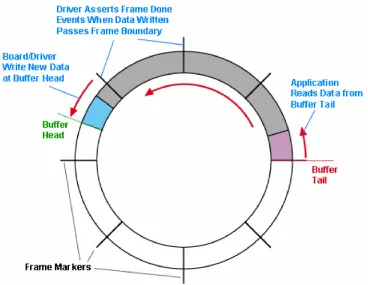
3.1.1 Circular Buffer
Data is acquired continuously via a circular buffer that is implemented by the LabVIEW
hardware/software. When the data acquisition starts, the hardware buffer starts to fill with data
and this is periodically shifted to the LabVIEW buffer for processing. The buffer can hold up to
512 samples. LabVIEW is only used as an intermediary in the signal processing, however, as
specialized CCC tools used for this purpose instead. So LabVIEW’s task initially is just
DataStream management that links to on-line signal processing using the in-house software
(written in C and Perl). LabVIEW’s role is crucial on managing the instrumentation, however,
particularly the instrumentation feedback upon blockade signal classification or weak-signal
Figure 3.2: Implementation of a Circular Buffer
3.1.2 LabVIEW prototype design
LabVIEW is a convenient environment for managing the experimental automation and the
critical feedback that is needed once it is informed by the CCC software. One example of this is
the easily designed virtual instrument interface. A prototype is shown in Figure 3.3 below. The
goal is to increase the sophistication of the interface to account for the feedback controls and API
Figure 3.3: Prototype design
LabVIEW is used to control the instrument settings in an on-line feedback manner that is
informed by LabVIEW passing information in and out of its software environment into the CCC
software environment. CCC identification of particular blockade analytes, or a given analytes
blockade state (there can be many) can then be used with LabVIEW controls to drive voltage
switching, temperatures changes, or laser modulations. This can provide bandwidth broadening
capabilities to the nanopore instrument. The advantage in using LabVIEW is the possibility of
creating a nice visualization tool in minutes; it has a very good data-flow user interface and it is
very convenient for creating data acquisition applications.
3.1.3 Disadvantages
There are a few disadvantages with LabVIEW also, which demands the use of another package,
LabWindows developed by the same company National Instruments. The major disadvantages of
(e.g. finite state machines). It is not particularly easy to integrate with conventional
programming (e.g. C, C++, and PERL). There are only two known approaches for integrating
external code with LabVIEW. One of them involves making Dynamic Link Libraries, which are
hard to debug and the other one makes use of their built – in functions which involves changing
the code drastically to suit the platform needs and more over only code written in C can be
interfaced. The block diagram for the prototype shown in Figure 3.4 is shown below. It can be
seen here that it is in fact hard to program Data-flow paradigms.
Figure 3.4: Block Diagram of the LabVIEW prototype
3.2 LabWindows Architecture
After weighing all the pros and cons of LabVIEW, it was decided that LabWindows environment
would be favorable to integrate the in house software and also build the data acquisition system
in the same package. The LabWindows architecture makes use two methods; it involves multi
threading and it also sends the data packets to another computer using the Transmission Control
LabVIEW. LabWindows also makes use of a circular buffer as explained for LabVIEW;
LabWindows uses the circular buffer to store the acquired samples.
The TCP protocol is used to send the acquired samples to another computer that is capable of
performing the computation tasks. Designing the architecture this way has numerous advantages
and it is explained in the methods concerning to LabWindows.
3.2.1 Multithreading
In Microsoft Windows multithreading extends the idea of multitasking into applications, so that
specific operations within a single application can be subdivided into individual threads, each of
which can theoretically run in parallel.
Figure 3.5: Multithreading application
Hence the operating system can divide processing time not only among different applications,
but also among each thread within an application. In the nanopore data acquisition system the
data is acquired on the server and sent as packets to the client. The client runs a multi threaded
LabWindows application; two threads are used in the data acquisition system. One thread is used
for file Input / Output operations while another thread performs computation tasks on the
integrated to the data acquisition system. The finite state automaton is used to detect the start and
the end of a particular blockade.
3.2.2 Transmission Control Protocol
The transmission control protocol (TCP) serves to manage the data transfer between the server
and the client. TCP is a reliable, connection-based protocol. It provides error detection and
ensures that data arrives in order and without any duplication.
Data is acquired continuously using a circular buffer, as the data is retrieved from the buffer it is
plotted and it also sends the data to the client in parallels. The server sends 50,000 samples per
second to the client to ensure that there is a timely feed back from the client.
Figure 3.6: TCP diagram
The client here serves as a “think tank”; the client will later be made into an information rich
source capable of taking decisions and the client can also suggest the server about the feed back
control like voltage switching or automatic perfusion of the nanopore device or the client can
even instruct the server to eject a molecule etc. The client will be able to set flags on the server
for this purpose. Multithreading is made use in the client, two threads are used in the client and
as stated before, as soon as the client receives the data from the server one thread performs the
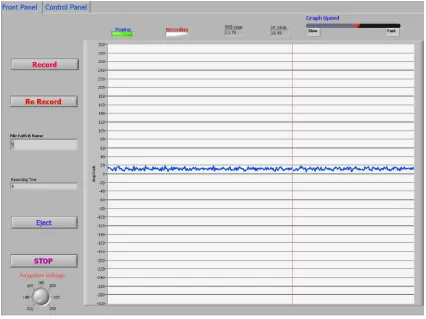
3.2.3 Prototype design of the Server
The server and the client run on two independent AMD Opteron machines. The prototype of the
server has various options which can be seen in the screen shot below
Figure 3.7: LabWindows Server Screen Shot
The Figure 3.7 which is a screen capture of the prototype with a 9GC hairpin molecule, As far as
customizing the controls the user has the option of selecting which channel to use, timing
parameters etc. To perform computational tasks such as the Finite State Automaton the client
should also be running, so the data can be passed to the client for analysis. The server indicates
whether the client is connected and the data sent to the client can also be stopped manually.
When a toggle is detected, the client sets a flag on the server which turns on the indicator “FSA
3.2.4 Prototype design of the Client
The client connects to the server using the intranet; there is an option to specify the server
address etc. The client records the data and as well runs the finite state
Figure 3.8: LabWindows Client Screen Shot
automaton as a multithreaded application. The standard I/O window shown in the above screen
capture displays the length of the toggle in terms of samples, the average and the standard
deviation. Client capture is that of a 9GC hairpin molecule. It is evident from the screen shot that
the toggle shown in the Figure 3.8 passes the FSA.
3.3
τ
-Finite state automatonA specially designed τ - finite state automaton is used to detect the blockades in the acquired
signal. The acquired signal is sent sequentially to the finite state automaton, the signal is stored
have a baseline of around 120 pA and the average of the previous samples are recorded. This
average is used to quantize the signal. As soon as a molecule enters the alpha hemolysin channel,
a sharp drop in the current is visible, as soon as this drop is visible it indicates the start of a
blockade and the signal is recorded from this point until there is a sharp downward spike which
is an indication of the end of blockade, this signifies the absence of the molecule in the channel
as shown in Figure 3.9.
Figure 3.9: Sampling protocol
If a blockade does not last for long enough or does not confirm to the range of approx lower
level average then the blockade is discarded. The entire finite state automaton is described in the
Figure 3.10:τ - Finite State Automaton Flow Chart
The finite state automaton has six states they are
• Reset Begin
• Reset End
• Signal Active
• Signal Complete
• Bad eLevel
• Acquire Signal
Figure 3.11: Signal levels forτ - Finite State Automaton
3.3.1 Reset Begin
In this state the acquired signal is scanned for a proper baseline, it has a counter that scans for a
particular number of samples that satisfies the baseline. When the sample scanned satisfies the
baseline requirement, it decrements the counter baseline-to-reset until it becomes zero. When it
becomes zero, it enters the next state.
3.3.2 Reset End
If the baseline–to-reset is zero then it enters the state reset end, In this state the sample are
scanned do not satisfy this condition then tit remains in this state until the conditions are
satisfied.
3.3.3 Signal Active
In the signal active state it checks for the level-value and the level-range. If the
end-level-range and the end-level-value are below a particular threshold then it updates the
signal_end and the signal_length. After this it checks whether the open channel average is above
a particular threshold. If so it enters the Signal Complete state, if not it checks whether it is less
than the max_length and if max_length is less than the threshold it goes into the state Bad
eLevel. Where as, if it is a bad end level it goes into the state Bad eLevel.
3.3.4 Bad eLevel
In Bad eLevel it checks for a series of conditions like the max_internal, min_internal,
end_level_range etc., and if any set of conditions do not satisfy then it enters the reset end state.
In this state a few values like signal_max and signal_min are updated.
3.3.5 Signal End
In the Signal End state the samples are checked whether it is greater than the minimum length
and it is also less than the max_min internal. If so it enters the state Acquire Signal otherwise it
4. RESULTS
A complete data acquisition system was built in LabVIEW and LabWindows using the above
stated methods. The real time system is optimized by implementing various computational
methods in the data acquisition system.
LabVIEW is a graphical programming language, and due to lack of flexibility in LabVIEW,
LabWindows is used. LabVIEW relies on hefty runtime libraries that may slow the performance.
More over coding large projects in LabVIEW becomes difficult. The code for the initial data
acquisition system is shown in Figure 4.1
LabWindows data acquisition system which is based on TCP and Multithreading architecture is a
very powerful system which facilitates the integration of external code very easily.
The real time data acquisition system built on LabWindows was tested on a 9GC hairpin
molecule as shown in the screen shot below
The LabWindows data acquisition system has a τ - Finite State Automaton integrated to it, once
the FSA detects a blockade it passes the signal data to another subroutine to calculate the length
of the blockade average and the standard duration. The results for a 9GC hairpin data is tabulated
below
Number of
Samples Average
Standard
Deviation Time (ms)
5000 35 2.2 100.0
280 50.3 13.1 5.6
5000 50.4 10 100.0
5000 44.6 8.7 100.0
341 48.7 9.8 6.8
5000 48.8 9.6 100.0
5000 45.7 9.3 100.0
5000 51.5 9.3 100.0
5000 49 9.7 100.0
5000 46.4 9.4 100.0
5000 51.2 9.7 100.0
5000 45.8 9.4 100.0
5000 42.9 7.3 100.0
5000 51.2 9.7 100.0
435 57.5 13 8.7
5000 47.1 9.6 100.0
5000 55.5 7.9 100.0
5000 50 10 100.0
5000 44 8.1 100.0
5. CONCLUSION
A successful real-time data acquisition system was implemented using LabWindows. The τ-FSA
coupled with LabVIEW/LabWindows serves as a powerful tool to analyze data obtained in the
nanopore detector. The main advantage of this approach is the integration of the in-house
software, which can be tailored as per the needs of the experiment. Since the data is obtained on
a streaming real-time basis and the processing of data is also done online, the results can decide
the control and the feedback for the detector. The CCC software developed at UNO’s
Biomedical Informatics and Bioinformatics (BIB) Lab consists of HMM’s and SVM’s, which
when integrated with the data acquisition application can help classify a particular molecule.
Filtering and cleaning of data can also be done online thus shedding more light on the molecule
under investigation. The entire system can be programmed into a FPGA, allowing it to perform
high speed sequencing experiments and data applications.
One of the most promising uses for automated feedback control of the alpha hemolysin nanopore
detector is in its application to immunological screening. It has been observed by our lab that
single antibodies can be captured in the nanopore detector to form a nanopore/antibody detector.
Binding of antigen can then be observed as a change in the blockade current for the composite
antibody-antigen blockade. From observation of the on-off binding kinetics between antigen and
antibody, screening for antibody with high affinity to target antigen (essential to developing a
vaccine) can then be pursued.
Automation of the nanopore detector, with feedback, promises to greatly enhance the potential of
REFERENCES
1. Stephen Winters-Hilt, Wenonah Vercoutere, Veronica S. DeGuzman, David Deamer, Mark Akeson and David Haussler. “Highly Accurate Classification of Watson-Crick Basepairs on Termini of Single DNA Molecules” - Biophysical Journal 84:967-976 (2003)
2. Vercoutere W., S. Winters-Hilt, H. Olsen, D. Deamer, D. Haussler, and M. Akeson. “Rapid discrimination among individual DNA hairpin molecules at single-nucleotide resolution using an ion channel”- Nat Biotechnol. 2001 Mar;19(3):248-52
3. Stephen Winters-Hilt, Matthew Landry, Mark Akeson, Maria Tanase, Charlie McChesney, Iftekhar Amin, Amy Coombs, Eric Morales, Srikanth Sendamangalam, John Millet “Machine Learning based Cheminformatics for Nanopore Biophysical analysis of HIV DNA termini” - MCBIOS 2006 Proceeding, BMC Bioinformatics Supplemental Issue 2006
4. Srikanth Sendamangalam, Carl Baribault, Anil Yelundur, and S. Winters-Hilt “Nanopore Detector Feedback Control using Cheminformatics Methods Integrated with LabVIEW/LabWindows Tools” - Mid South Computational Biology and Bioinformatics Society (MCBIOS) 2006 Conference Proceedings
5. Tanase, M., S. Sendamangalam, M. Landry, M. Akeson, A. Coombs, and S. Winters-Hilt “Nanopore Cheminformatics Analysis of the "sticky" DNA-intercalating behavior of HIV DNA termini” - - Mid South Computational Biology and Bioinformatics Society (MCBIOS) 2006 Conference Proceedings
6. Srikanth N Sendamangalam, Aravinth K Nallusamy , Iftekhar Amin and Stephen Winters – Hilt “Single Molecule Manipulation and Nano – Manufacturing using the Alpha Hemolysin Nanopore Detector” - Mid South Computational Biology and Bioinformatics Society (MCBIOS) 2004 Conference Proceedings
7. “Data Acquisition in the Life Sciences” – National Instruments Corporation (NI Developer Zone)
8. “LabVIEW Performance and Memory Management” – National Instruments Corporation (NI Developer Zone)
9. “An Overview of Accessing DLLs from LabVIEW” –National Instruments Corporation (NI Developer Zone)
VITA
Srikanth Sendamangalam was born in Madras, India and received his B.E. degree in Electronics
and Instrumentation Engineering from Annamalai University. He completed his undergraduate
final project on Control of Dish Alignment using Artificial Neural Networks. He was admitted to
the graduate school of University of New Orleans, New Orleans in January 2004 in the
Department of Electrical Engineering. Then he transferred to the Department of Computer
Science, UNO and worked under the guidance of Dr Stephen Winters – Hilt.
All throughout his studies in the Computer Science department he was working as a Research
Assistant for the Children’s Hospital, New Orleans and also for the Department of Computer