in the population sciences published by the Max Planck Institute for Demographic Research Konrad-Zuse Str. 1, D-18057 Rostock · GERMANY www.demographic-research.org
DEMOGRAPHIC RESEARCH
VOLUME 8, ARTICLE 5, PAGES 107-150
PUBLISHED 12 March 2003
www.demographic-research.org/Volumes/Vol8/5/
DOI: 10.4054/DemRes.2003.8.5
Descriptive Findings
Pathways to Stepfamily Formation in
Europe: Results from the FFS
Alexia Prskawetz
Andres Vikat
Dimiter Philipov
Henriette Engelhardt
1 Introduction 108
2 Data and method 110
3 Results 114
3.1 Partnerships 115
3.1.1 First partnership 115
3.1.2 Second partnership 118
3.1.3 Third partnership 123
3.1.4 Summary 123
3.2 Childbearing 124
3.2.1 Pre-union children at first union formation 124 3.2.2 Pre-union children at second union formation 126 3.2.3 Pre-union children at any union formation 128
3.2.4 Summary 130
3.3 Change over time (birth cohorts) 135
4 Discussion 138
5 Acknowledgement 139
Notes 140
References 141
Appendix Graphical represenation of data from Table 4
Descriptive Findings
Pathways to Stepfamily Formation in Europe:
Results from the FFS
Alexia Prskawetz1
Andres Vikat2
Dimiter Philipov3
Henriette Engelhardt4
Abstract
Increasing proportions of couples are making childbearing decisions in stepfamilies but there has been no general comparative picture across European countries on stepfamily formation. The present paper aims to fill this gap and provides a comparison of European countries using macro-level indicators that describe union formation and dissolution and childbearing. We use the individual-level data files (standard recode files) of Fertility and Family Surveys from 19 European countries. Our results highlight the different pathways to a stepfamily in Europe, and show that in most European countries a considerable proportion of women form a stepfamily in childbearing ages, which needs to be considered in studies of fertility.
1
Max Planck Institute for Demographic Research, Konrad-Zuse-Str. 1, D-18057 Rostock, Germany. Email: [email protected]
2
Max Planck Institute for Demographic Research, Konrad-Zuse-Str. 1, D-18057 Rostock, Germany. Email: [email protected]
3
Max Planck Institute for Demographic Research, Konrad-Zuse-Str. 1, D-18057 Rostock, Germany. Email: [email protected]
4
1. Introduction
Changing family structures together with greater instability of marriages in most industrialized countries have changed the content of the notion of a stepfamily. Pre-marital childbearing and consensual unions are no longer an exception to families in the traditional sense, and childbearing is not restricted to one marital or consensual union (Kiernan 1999a, 1999b). This is of importance in relation to the concept of completed fertility over one’s life course, since union disruption and formation of higher-order unions typically occur during one’s reproductive years. To take into account these changes in family structures, the term stepfamily that was formerly restricted to marriages only, needs to be extended to include consensual unions involving a child of only one partner. This definition of stepfamilies takes into account the fact that an increasing proportion of higher-order unions are consensual unions.
A demographic study of stepfamily fertility integrates research on higher-order unions with the research on higher-order parity progression. While the increasing prevalence of higher-order unions is a characteristic of modern European societies, there has been a considerable decline in higher-order parity progression that in parts of Europe has resulted in ‘lowest low’ fertility (Kohler et al. 2002). Hence, it is of importance to understand the consequences of these opposite trends for European societies.
Recently, a stream of empirical demographic research on stepfamily fertility in various countries (Toulemon & Lapierre-Adamcyk 1995, Thomson 1997, Toulemon 1997, 2001, Vikat et al. 1999, Buber & Prskawetz 2000, Thomson, Hoem, and Godecker 2000, Thomson & Godecker 2000, Henz 2002, and Thomson et al. 2002) has highlighted the importance of stepfamily fertility as an important research topic. Several studies have demonstrated the union commitment effect on fertility, that is, a birth risk is elevated if a couple does not have shared children (Vikat et al. 1999, Buber & Prskawetz 2000, Thomson et al. 2002), which is one of the driving forces of fertility in unions where either partner already has children from a previous union. In addition to the union commitment effect, the first child to a couple may also be motivated by the parenthood effect, that is the desire of the childless partner to become a parent.
ECE Region (FFS) provides to answer these questions. In this respect, our study proceeds in the spirit of the paper by Billari et al. (2001) who use information from different life domains for a cross-European comparison of home leaving, and Andersson & Philipov (2002) who provide a broader comparison across FFS countries, including some indicators relevant for stepfamily formation.
Several comparisons of fertility and household formation patterns between European countries have been presented in the literature. Starting from the study by Lesthaeghe and van de Kaa (1986) and van de Kaa (1987) many of these studies have used the framework of the second demographic transition. These include amongst others the studies by Haskey (1993) and Kiernan (1996,1999a) on partnership formation and cohabitation, the study by Coleman (1996) on fertility patterns and the study by Lesthaeghe and Moors (1996) on living arrangements among young adults. In North and West European countries, with Sweden and Denmark as forerunners, postponement of marriage and childbearing and increasing prevalence of consensual unions have been observed first. Southern Europe followed this demographic pattern with some time lag while in Eastern Europe this demographic change did not take place until the 1990s. However, in the former socialist countries the transition towards low fertility and postponement of marriage and childbearing proceeded at a much faster pace as in other European countries. Nevertheless, in discussions about the convergence of European demographic trends it has been emphasized that in spite of certain similarity in the aggregate-level trends, many differences in demographic behavior between countries are likely to persist (Coleman 1996).
In this study, we suggest a grouping of European countries by patterns of combined union and childbearing careers. In particular, it is important that we are able to base such a description on full-scale life course information on consensual unions, because indicators of formal marriage are decreasingly reflecting the underlying union dynamics. The objectives of this article are
• to study the diversity of stepfamily formation among selected European countries, and more precisely, to find out the share of women of selected cohorts who experience stepfamily formation at an age that leaves time for childbearing in the stepfamily;
• to study the different pathways in terms of women’s union and childbearing careers that can lead to stepfamily formation;
2. Data and method
Our study is based on the 1990s round of the Fertility and Family Surveys (FFS) in Europe. We have used the individual-level data files (standard recode files) available at the Population Activities Unit of the UN Economic Commission for Europe (UN ECE PAU), including in our study all the countries for which the internationally comparable FFS data was available. These countries are Austria, Belgium (representing Flanders), the Czech Republic, Estonia (native population only, Note 1), Finland, France, East Germany, West Germany, Hungary, Italy, Latvia (data on native population used, Note 1), Lithuania, Norway, Poland, Portugal (only data on entry into first unions available), Slovenia, Spain, Sweden, and Switzerland.
Our approach in this article is to describe the outcomes of union and childbearing careers by certain age in a given birth cohort. The words union and partnership are used as synonyms, denoting a coresidential union of married or unmarried partners, as defined in the FFS questionnaires (UN ECE PAU). According to the definition used in the FFS, the start of a union is set equal to the time point when a couple moves together and similarly the end of a union is the date at which the couple moves apart. Our data do not allow to discriminate between unions formed with the same partner as in a previous union, thus some of the higher-order unions may be repeated unions with the same partner.
We count a child born to the respondent at any time before union formation as a pre-union child. In the case of a first union, a pre-union child is a child who was born to the respondent before her first union started. In the case of a second union, a pre-union child could be born before the first union, in the first union, or between the first and second union. By using such a definition we may overestimate the number of stepchildren, since the partner with whom the union is formed may be the biological father of a pre-union child. However, other criteria would also introduce some bias, because we only have information on the dates of childbirth, and union formation and dissolution. By considering only those children who are born twelve months before union formation as pre-union children, which was one of the alternative specification we experimented with, we certainly got lower numbers of pre-union children. However, the relative difference between countries in the percentage of women with pre-union children or partner’s children did not change notably. We also considered the possibility of excluding children born between the first and second union from pre-second-union children. In this case it would not have influenced the results because such children make up less than three percent of the children born to our cohorts before age 35. Hence, we kept our straightforward definition of pre-union children as outlined above.
sequence of life course events is often pre-determined, e.g., only those who have dissolved their first union can enter a second union. Our intention is not, however, to study the intensities of transitions from one status to another, but to focus on the probabilities of certain experiences in a life course. Though we base our calculations on individual level data, we are interested in macro-level differences of the experience of specific life course events (cf. Billari et al. 2001).
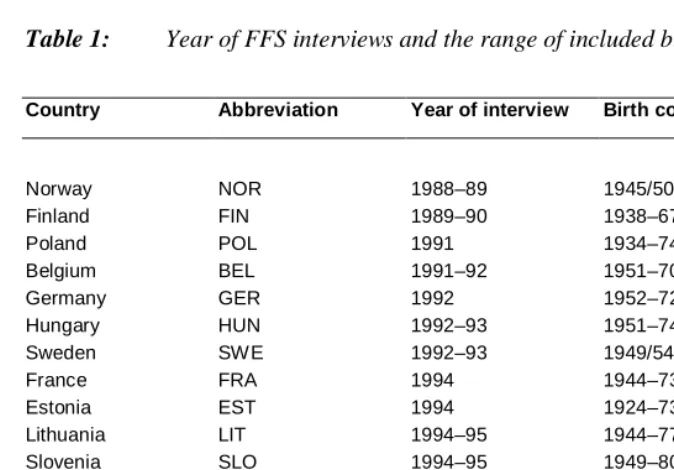
Table 1: Year of FFS interviews and the range of included birth cohorts.
Country Abbreviation Year of interview Birth cohorts included
Norway NOR 1988–89 1945/50/55/60/65/68
Finland FIN 1989–90 1938–67
Poland POL 1991 1934–74
Belgium BEL 1991–92 1951–70
Germany GER 1992 1952–72
Hungary HUN 1992–93 1951–74
Sweden SWE 1992–93 1949/54/59/64/69
France FRA 1994 1944–73
Estonia EST 1994 1924–73
Lithuania LIT 1994–95 1944–77
Slovenia SLO 1994–95 1949–80
Switzerland SUI 1994–95 1944–74
Latvia LAT 1995 1945–77 Spain SPA 1995 1945–77
Austria AUT 1995–96 1941–76
Italy ITA 1995–96 1946–75
Portugal POR 1997 1947–82
Czech Republic CZE 1997 1952–82
Note: If surveys of women and men differed in time or cohort composition this table pertains to the survey on women.
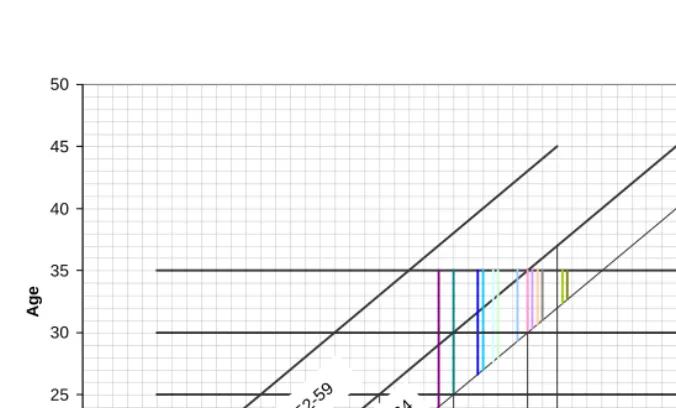
observe most part of the cohort until age 35 (Table 1, Figure 1). For a description of change over time, the indicators were also calculated for three smaller cohorts, born in 1952–1955, 1956–1959, and 1960–1964, respectively. For the youngest cohort, the upper age limit for the experience of an event needed to be restricted to age 30 because of right-censoring at the interview.
Note: The colored vertical lines represent the time when the FFS fieldwork was conducted in each country
Figure 1: The cohort-age range covered for each country in our study.
Since our data imposes truncation of observation at age 35, we are not able to consider the large number of stepfamilies formed after that age (Mazuy and Toulemon 2001). Considering that our focus is on combined histories of union formation and childbearing (i.e. stepfamilies where children could be born), this limitation is less harmful because it concerns only those years of the reproductive age span when fertility is declining. Nevertheless, due to the truncation, our indicators underestimate the proportion of women who form a stepfamily at reproductive age.
15 20 25 30 35 40 45 50
1965 1970 1975 1980 1985 1990 1995 2000 2005 2010
Year Age NOR FIN BEL POL GER HUN SWE EST FRA SWI AUT LIT SLO LAT SPA ITA POR CZE Coh
ort b orn
in 1 95
2-59
Coh ort b
orn in 1
The countries involved in our study had used samples that covered all birth cohorts within a specified range of years, with the exception of Sweden and Norway where the samples focused on certain years of birth (Table 1). To compare with the cohort 1952– 1959, we used data on cohorts born in 1950, 1955, and 1960 from Norway, and on cohorts born in 1949, 1954, and 1959 from Sweden. All the calculations were made both for men and women, but we present the indicators for women only since answers on the number of pre-union children of men are often unreliable (Rendall et al. 1999, Buber and Prskawetz 2000).
In our calculations, we specified certain life course experiences as non-repeatable events and estimated survivor functions based on survival probabilities in single-year age-groups, using the Kaplan-Meier estimator in Stata software (StataCorp. 2001). For the comparative analysis of results we selected cutpoints at ages 20, 25, 30 and 35; for presentation, we chose cutpoints that best described the event in question.
To describe the contribution of the processes of union formation and dissolution in the route to stepfamilies we use percentages of women in a cohort who have formed or dissolved a partnership of certain order by certain age. We also calculate union progression ratios that are defined similarly to the parity progression ratios used in fertility research. For instance, the union progression ratio from first to second union gives the number of second unions in relation to the number of first unions experienced by the specific cohort under consideration. Alternatively, we use a dissolution-based union progression ratio which gives the number of second unions in relation to the number of dissolutions of first unions experienced by the specific cohort under consideration. To gain a better understanding of the difficulty to form a stepfamily we also consider a union progression ratio that is restricted to women that have dissolved the first union and have children.
3. Results
We present our results in four steps. As the first step, we start with a cross-country comparison of union formation and dissolution that can be understood as a measure of the potential for stepfamilies. We calculate the percentage of women (out of the initial cohort of women born in 1952 to 1959) who have entered their first, second and third partnership by certain age. Alternatively, we also calculate a union progression ratio that gives the proportion of those who form a second union among those who have formed at least one union. Similarly, we calculate the percentage of women who have experienced dissolution of the first and second partnership up to selected ages for the initial cohort of women born in 1952 to 1959 and alternatively for women who have formed a first and a second union. Since the number of children born in the first union and the probability of entering a second union after the first dissolves may depend on the type of union (cohabitation versus marriage), we also present the percentage of first unions that were cohabitation throughout. The potential of stepfamilies can then be associated with the prevalence of any union dissolution and the formation of any higher order union. By distinguishing union formation and dissolution by age of the respondent we aim to gain more insight whether, and in which countries, early partnership formation is associated with higher prevalence of union dissolution and higher order union formation.
We describe the entry into first partnership along the two dimensions of the quantum and the tempo of entering a first partnership. We think of the quantum as the proportion of all women in a cohort who ever enter a partnership within reproductive ages and use the percentage of women having entered a first partnership by age 35 as an approximate measure. The tempo is presented by the proportion of a cohort who had entered first partnership by age 20.
In the second step we discuss childbearing histories in relation to union formation histories. We present the experience of union formation when having pre-union children both as the percentage of all those who enter the first or the second union and as the percentage of the entire cohort. Since the pattern of differences between countries varied whether we considered pre-union children at first or at second union formation we summarized the results on pre-union children by considering all unions, including the rare (by age 35) third and higher order unions.
We conclude the presentation of our results in the fourth step by comparing the indicators across the following birth cohorts: 1952–1955, 1956–1959 and 1960–1964. These comparisons will help to highlight any change over time in the pattern of stepfamily formation. Based on our findings we then propose a typology of countries that reflects different pathways to stepfamilies.
To make the country comparison across the various indicators as well as across cohorts easier we proceed from a grouping of countries based on geographical location and social system: Northern Europe (Finland, Norway, Sweden), Western Europe (Austria, Belgium, France, West Germany, Switzerland), Southern Europe (Italy, Portugal, Spain), and former socialist countries (Czech Republic, East Germany, Estonia, Hungary, Latvia, Lithuania, Poland, Slovenia – note that our data pertains to the time before the social and economic transition in those countries). We present our results in bar charts where we either order the countries within these groups by the studied indicator (Figures 2, 3, 4, 7, and 8) or present them in an overall order (Figures 5 and 11).
3.1 Partnerships
3.1.1 First partnership
In the North and West European countries, the percentage of the initial cohort of women who had entered their first partnership by age 35 (Figure 2) ranged from 93% (France and Switzerland) to 96% (Belgium). West Germany was an exception with only 87%. Within this group of countries there was a clear difference in the tempo of entering the first partnership. While in Sweden, Austria and France about 35% to 40% of all women had entered their first partnership by age 20, these numbers ranged between 26% and 29% in Finland, Norway, Belgium and West Germany. The lowest tempo of entering a first union could be observed in Switzerland with only 15% of the initial cohort having entered a first union by age 20.
the tempo and quantum of first partnership formation in Portugal was among the highest observed in our set of countries.
Figure 2: Percentage of women who have entered their first union by age 20 and by age 35, birth cohort 1952–1959.
Within the former socialist countries we could distinguish three groups. In Lithuania and Poland the tempo and quantum of first partnerships were the lowest. About one fifth of the initial cohort had entered a first partnership by age 20 and about 90% by age 35. In Hungary, the Czech Republic and Slovenia women had entered their first partnership earlier, and by age 35 they reached the highest percentages of those who had entered a partnership (from 96% to 97%) among the countries involved in our study. Hungarian women entered their first partnership the earliest, 46% of the cohort
0% 20% 40% 60% 80% 100%
LIT POL LAT GER_E EST SLO CZE HUN SPA ITA POR SUI BEL GER_W FRA AUT FIN NOR SWE
by age 20. Estonia, Latvia, and East Germany lie in between with values close to those of the West European countries.
Figure 3: Percentage of women who have dissolved their first union by age 25 and by age 35, birth cohort 1952–1959.
North European countries have the highest share of women who had experienced dissolution of a first union, at any of the measured age cutpoints (Figure 3). Sweden clearly stood out with already 18% of all women having experienced a first dissolution by age 25 and 35% by age 35. The dissolution of first partnerships was less prevalent in countries of Western Europe, at lower ages in particular (except Switzerland which stays close to Norway and Finland). In Austria and France where entry into first partnership at lower ages was comparable to Sweden, only about 9% and 7%, respectively, of the initial cohort experienced a first dissolution by age 25. However, up
0% 5% 10% 15% 20% 25% 30% 35% 40%
POL SLO LIT CZE GER_E HUN LAT EST ITA SPA BEL GER_W FRA AUT SUI FIN NOR SWE
to age 35, already about 20% of the initial cohort of women experienced first dissolution in most West European countries, except Belgium. In Belgium where entry into first partnership was late but the proportions of women who experienced first partnership by age 35 were high, the experience of dissolution was the lowest in the studied West European countries, 4% by age 25 and 13% by age 35. In South European countries we observed the lowest share of women with a union dissolution experience, 6% by age 35 in Italy and 8% in Spain (Note 2). Later entry and lower prevalence of first partnerships in those countries are likely to have contributed to this.
Among the former socialist countries, the picture of union dissolution was somewhat different from the one on entering the partnership. In Latvia and Estonia, about one third of all women in the initial cohort had experienced a first dissolution by age 35, which is clearly higher than in the other studied former socialist countries and at about the same level as in Sweden. While Lithuania and Poland were both characterized by relatively late entry into partnership and a relatively low percentage of women who had entered a partnership by age 35, a much larger percentage of Lithuanian women had gone through a union dissolution (21%) than in Poland (8%). In the Czech Republic, East Germany and Hungary we observed percentages of women with dissolution experience that are in the size order of those observed in West European countries, while in Slovenia where the indicators of entry into first partnership were close to the mentioned three countries, the percentage of women with dissolution experience was almost as low as in Poland.
3.1.2 Second partnership
dissolution. In the Czech Republic, East Germany and Hungary the experience of second partnerships was in the order of West European countries. In Lithuania, a comparable dissolution rate like in the Western countries, however, did not translate into corresponding numbers of the prevalence of second partnerships. Only about 8% of the initial cohort experienced a second union by age 35 though almost 21% of all women experienced a first dissolution by age 35. On the other hand, in Slovenia and Poland a lower dissolution rate of first partnerships translated into lower prevalence of second union formation.
Figure 4: Percentage of women who have entered a second union by age 25 and by age 35, birth cohort 1952–1959.
0% 5% 10% 15% 20% 25% 30%
POL SLO LIT HUN GER_E CZE LAT EST ITA SPA BEL FRA GER_W AUT SUI FIN NOR SWE
If we group the countries according to second partnerships experienced by age 35 we arrive at a different classification as the one we started off (Figure 5). Sweden is clearly the country with the highest prevalence of second unions and is followed by Estonia and Latvia. South European countries (Italy and Spain) and Poland have the lowest prevalence of second unions. In between, the remaining North, West European countries and former socialist countries form two groups.
Figure 5: Cumulative union history experience of women born in 1952–1959.
0% 20% 40% 60% 80% 100%
ITA POL SPA BEL SLO LIT FRA GER_W HUN AUT GER_E CZE FIN SUI NOR LAT EST SWE
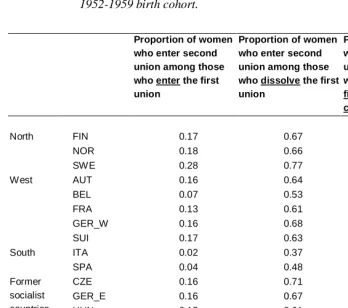
Table 2: Indicators of progression from first to second union by age 35 for the 1952-1959 birth cohort.
Proportion of women
who enter second union among those who enter the first union
Proportion of women who enter second union among those who dissolve the first union
Proportion of women who enter second union among those who dissolved the first union and have children*
North FIN 0.17 0.67 0.55
NOR 0.18 0.66 0.61
SWE 0.28 0.77 0.65
West AUT 0.16 0.64 0.52
BEL 0.07 0.53 0.49
FRA 0.13 0.61 0.51
GER_W 0.16 0.68 0.57
SUI 0.17 0.63 0.46
South ITA 0.02 0.37 0.26
SPA 0.04 0.48 0.39
CZE 0.16 0.71 0.65
GER_E 0.16 0.67 0.65
Former socialist
countries HUN 0.15 0.61 0.55
POL 0.04 0.43 0.39
SLO 0.08 0.69 0.59
EST 0.25 0.73 0.71
LAT 0.21 0.62 0.60
LIT 0.09 0.40 0.39
* This is a progression ratio from status ‘dissolved first union, parity 1+’ to status ‘in second union, parity 1+’. The combined status
‘dissolved first union, parity 1+’ can be attained either when a woman with children separates, or when a separated woman has
her first child.
country classification. Sweden still stands out with 77% of all first dissolutions being followed by a second union by age 35. West and East Germany, the Czech Republic, Slovenia and Estonia come next with 68% to 73% of first dissolutions being followed by a second union. The classification of the remaining countries is not influenced by this alternative measure of union progression. The progression ratio to second union for those women who have dissolved the first union and have children (column 3, Table 2) allows us to assess whether the probabilities of second union formation differ between women with and without children. In all countries, the proportion of women who enter a second union is lower among separated mothers (column 3, Table 2) than among all separated women (column 2, Table 2), which tells us that a woman’s probability of entering a second union is lower when she has children.
Figure 6: Plot of countries by the percentage of dissolved first unions that were cohabitation throughout and the percentage of women who enter a second union by age 35, birth cohort 1952–1959.
LIT LAT
HUN
SLO FRA
EST
ITA SPA BEL
POL
GER_E
GER_W FINNOR
SWE
AUT
SUI CZE
0% 10% 20% 30%
0% 10% 20% 30% 40% 50% 60% 70% Percentage of first unions that were cohabitations throughout,
among all first unions that were dissolved by age 35
The percentage of first unions that were cohabitation throughout shows some positive correlation with the experience of second unions (Figure 6). On the background of this overall pattern we note that in Latvia, Hungary, and the Czech Republic a medium level of second-union experience was reached while only very few first unions were cohabitation throughout in those countries.
3.1.3 Third partnership
The share of women who experienced a third partnership by age 35 exceeded the 5% mark only in the case of Sweden. For the remaining North and West European countries about 1% to 3% of the initial cohort of women experienced a third union with Belgium being again an outlier with only 0.6%. Similarly low and almost negligible numbers as in Belgium were observed in Italy, Spain and Poland. In the former socialist countries only 1% to 2% of women had experienced a third union by age 35. The pattern across countries of the prevalence of third unions therefore follows closely the pattern we already observed in case of second partnerships.
3.1.4 Summary
3.2 Childbearing
3.2.1 Pre-union children at first union formation
The highest proportion of women who had children when they formed their first union, 32%, was observed in East Germany (Figure 7). Slovenia and Austria followed next with 13%. In all the other studied countries the share of women with at least one child at first union formation was below 10%. In Belgium, Italy and Spain this share was the lowest, below 3%.
* Information on partner’s pre-union children not available.
Figure 7: Percentage of women’s first unions with own and partner’s pre-union children at union formation. First unions up to age 35, birth cohort 1952–1959.
0% 10% 20% 30% 40% 50%
HUN EST* CZE POL LIT LAT SLO GER_E SPA ITA POR BEL* SUI FRA GER_W AUT SWE* FIN NOR*
Woman had children
The extraordinarily high percentage of first unions with pre-union children in East Germany warranted us to take a closer look at the timing of the birth of the pre-union children in relation to the starting time of the first union. About half of the children born before the first union were born within twelve months before the union, and this share does not show much variation among the countries with a sizable proportion of pre-first-union children. It is indeed likely that a considerable proportion of the children born within the twelve-month period that immediately preceded union formation are biological children of both partners who form the union (for East Germany, see Huinink and Konietzka 2000). However, even after we restrict the definition of pre-union children to children who were born more than twelve months before union, East Germany still stands out and the relative differences between countries in the percentage of women with pre-union children or partner's children do not change notably.
3.2.2 Pre-union children at second union formation
The whole group of the former socialist countries had higher proportion of women who had children at their second union formation (Figure 8). It ranged from 65% in Slovenia to 85% in Latvia. Among the other countries, the variation did not follow our country grouping in any systematic manner. The proportion of women with children at second union formation ranged from 42% in Sweden to 61% in Spain, with Switzerland as an outlier with 29%.
* Information on partner’s pre-union children not available.
Figure 8: Percentage of women’s second unions with own and partner’s pre-union children at union formation. Second unions up to age 35, birth cohort 1952–1959.
0% 10% 20% 30% 40% 50% 60% 70% 80% 90% 100% SLO
HUN POL CZE GER_E EST* LIT LAT ITA SPA SUI GER_W AUT FRA BEL* SWE* FIN NOR*
Woman had children
Considering the contribution of man’s pre-union children, that is, second unions of the woman where the man did and the woman did not have children at union formation, did not essentially alter the picture (Figure 8). In Finland and Switzerland, considering those unions increased the proportion of woman’s second unions starting with pre-union children from 48% to 59%, and from 29% to 38%, respectively. In other countries that contribution was smaller.
Figure 9: Plot of countries by the percentage of dissolved first unions that were cohabitations throughout and the percentage of women’s second unions with pre-union children at union formation, birth cohort 1952–1959.
The type of the first dissolved union is generally associated with the share of women who have children when they enter a second union (Figure 9). The higher the percentage of first unions that were cohabitations throughout the lower the percentage
CZE
SUI AUT
SWE NOR
FIN GER_W GER_E
POL
BEL SPA
ITA
EST
FRA SLO HUN
LAT LIT
0% 10% 20% 30% 40% 50% 60% 70% 80% 90%
0% 10% 20% 30% 40% 50% 60% 70%
Percentage of first unions that were cohabitation throughout among first unions dissolved before age 35
Percentage of women who have children when they enter a
of women who have children when they enter a second union. Estonia and Switzerland deviate from this pattern. In Estonia, a relatively high share of non-marital unions is accompanied with a very high share (83%) of women with children at entry into second union, while in Switzerland where non-marital unions make up about the same share of dissolved first unions, only 29% of women have children when they enter a second union. Interestingly, the catholic countries do not form a pattern.
3.2.3 Pre-union children at any union formation
Figure 10: Experience of any union formation by age 35 where the woman already had own pre-union children and the contribution of first unions to this, birth cohort 1952–1959.
0% 10% 20% 30% 40% 50%
ITA SPA BEL POL SUI FIN FRA GER_W LIT HUN SWE NOR CZE SLO AUT LAT EST GER_E
First unions
The experience of entering any union with pre-union children was highest in East Germany, 38% (Figure 10). The bulk of these cases were first unions with prior children. A high share of first unions with pre-union children also contributes to the relatively high share of overall union experience with pre-union children in Austria, 19%.
3.2.4 Summary
Figure 11: Plot of countries by the percentage of women with pre-union children at second union formation of all second unions formed before age 35, and the percentage of women who enter a second union by age 35, birth cohort 1952–1959.
Altogether we could distinguish six patterns of combined union and childbearing careers. One dividing line was that between the two social systems that prevailed in Europe during the reproductive ages of our cohorts. All the former socialist countries were characterized by a universal prevalence of pre-union children – more than 70% of women who enter a second union already had a child (Figure 11). However, there was
CZE
SUI AUT
SWE NOR
FIN GER_W GER_E
POL
BEL SPA ITA
EST
FRA SLO
HUN LAT LIT
0% 10% 20% 30% 40% 50% 60% 70% 80% 90% 100%
0% 5% 10% 15% 20% 25% 30%
Percentage of women who had formed a second union by age 35
Percentage of women who have children when they enter a
considerable variation in dissolution and repartnering rates between those countries, and we can distinguish three groups among them. The highest experience of a stepfamily before age 35 of all countries was reached in Estonia and Latvia where the high prevalence of children in first unions was accompanied with relatively high rates of separation and repartnering (first pattern). The Czech Republic, East Germany and Hungary constitute an intermediate group (second pattern), while Poland and Lithuania (third pattern) form a group with few second unions and few stepfamilies.
Table 3: Data presented in the map in Figure 12.
Region Country Percentage of women from the
entire cohort who had experienced a second union formation by age 35 where the woman already had own pre-union children, birth cohort 1952–1959
North FIN 7.6
NOR 9.1
SWE 11.4
West AUT 7.8
BEL 4.2
FRA 7.3
GER_W 6.1
SUI 4.7
South ITA 1.1
SPA 2.4
CZE 12.6
GER_E 12.1
Former socialist
countries HUN 9.8
POL 2.6
SLO 5.1
EST 19.5
LAT 16.8
Figure 12: Map of studied countries by the experience of a second union formation by age 35 where the woman already had own pre-union children, birth cohort 1952-1959 (data from Table 3).
Footnote: The cutpoints for the differently colored country groups were obtained by dividing the distance between the maximum and minimum value into five equal intervals.
> 15.8% (2)
< 15.8% (2) < 12.1% (3)
< 8.4% (6)
3.3 Change over time (birth cohorts)
Table 4: Percentage of women from the entire cohort who enter a second union, and percentage of women with pre-union children at second union formation of all second unions by age and birth cohort.
Experience by age 30 Experience by age 35
Percentage of
women in the cohort who entered a second union by age 30
Percentage of women with pre-union children at second union formation of all second unions formed before age 30
Percentage of women in the cohort who entered a second union by age 35
Percentage of women with pre-union children at second union formation of all second unions formed before age 35 Birth cohort: 1952-55 1956-59 1960-64 1952-55 1956-59 1960-64 1952-55 1956-59 1952-55 1956-59
Country
FIN 8.7 13.2 a 46.2 34.6 a 14.0 a 52.8 a
NOR 6.6b 12.9c a 67.5b 48.3c a 11.0b a 71.1b a
SWE 14.7d 19.1e 27.7f 56.2d 41.5e 27.1f 20.6d 26.7e 56.1d 44.9e
AUT 9.8 9.9 13.2 56.0 41.3 41.7 14.5 14.9 63.6 43.4
BEL 4.6 3.7 8.6 56.8 53.6 44.0 7.7 6.3 65.7 53.1
FRA 9.8 7.7 12.7 56.4 49.3 32.5 13.4 11.7 57.0 59.2
GER_W 9.5 10.4 12.0 34.8 22.5 47.4 12.6 14.8 46.5 44.0
SUI 8.9 10.4 14.0 34.3 16.7 22.6 15.2 17.2 37.2 21.9
ITA 0.9 0.9 1.7 52.7 47.8 32.1 1.7 2.4 55.4 49.4
SPA 2.0 2.5 4.1 41.4 55.6 41.0 3.0 4.8 55.6 65.1
CZE 8.8 10.0 12.5 60.9 94.2 59.7 14.9 15.9 63.4 93.0
GER_E 10.8 8.9 14.5 76.1 81.7 78.3 14.6 14.8 79.8 84.6
HUN 10.3 9.5 12.1 58.6 68.6 67.9 14.9 12.8 66.8 73.8
POL 1.8 1.7 1.7 63.7 50.3 80.0 3.3 3.7 80.0 73.4
SLO 6.8 5.6 5.9 57.6 63.8 69.7 7.8 8.2 60.1 69.5
EST 18.9 15.2 17.8 78.0 86.5 75.6 23.0 24.4 78.7 86.7
LAT 10.5 13.0 8.8 79.0 80.0 75.0 18.8 20.4 85.3 85.1
LIT 5.0 4.4 5.9 61.2 85.6 62.9 9.1 7.6 81.0 87.4
a
In Table 4, the prevalence of second unions starting with pre-union children is presented for three consecutive birth cohorts of 1952–1955, 1956–1959 and 1960– 1964, by ages 30 and 35 (for a graphical representation see Appendix Figure A). We observe second partnerships that have been formed by age 30 for all three cohorts, while second partnerships by age 35 could be obtained for the first two cohorts only.
Table 5: Percentage of women from the entire cohort who had experienced a second union formation by age 35 where the woman already had own pre-union children, birth cohorts 1952–1955 and 1956–1959.
Cohort born
in 1952–1955
Cohort born in 1956–1959
North FIN 7.4 7.6
NOR 7.8 9.1
SWE 11.5 12.0
West AUT 9.2 6.4
BEL 5.0 3.3
FRA 7.7 6.9
GER_W 5.9 6.5
SUI 5.6 3.8
South ITA 0.9 1.2
SPA 1.7 3.1
Former CZE 9.5 14.8
socialist GER_E 11.6 12.5
countries HUN 9.9 9.5
POL 2.6 2.7
SLO 4.7 5.7
EST 18.1 21.1
LAT 16.0 17.4
LIT 7.3 6.7
4. Discussion
A life history survey like the FFS is very useful in presenting the patterns of demographic life courses and comparing them across countries and cohorts. With very little variation, the definition of a coresidential partnership was comparable across the countries and that permitted us to compare the indicators combined from union and birth histories. However, also various problems emerged, like those of the differences in the time the surveys were taken, and the cohorts involved in the surveys. From the point of view of our study, it was also a shortcoming that children could not explicitly be linked to certain partnerships. It is possible that some of the pre-union children at first union formation are biological children of both partners. This is the reason why we had to stick to the description of the prevalence of stepfamilies mainly by referring to second partnerships (see Figure 12). Again, we may overestimate the share of women who enter their second partnership with pre-union children since part of these pre-union children may already be biological children of the partner with whom the second union was formed. However, the bias may be much less as compared to first partnerships. As the sequencing of demographic events (such as the birth of children and union formation) becomes more complex over time surveys need to be adjusted to capture these more complicated biographies and to obtain more clear cut results on questions like the prevalence of stepfamilies as considered in this paper.
In addition to the above discussed distinction between countries of different social systems, our results also reflected differentials in second-union experience determined by first-union dissolution and repartnering. Sweden with its historical tradition of non-marital cohabitation has been pointed out as a forerunner in many demographic trends, and the pattern of high prevalence of consensual unions, in particular the relatively high prevalence of those consensual unions that are not converted to marriage at any stage, and the high dissolution and repartnering rates showed up distinctly in our results too. Despite the fact that the dissolved first unions of Swedish women were among the least likely to have offspring, Sweden was still among the countries with high stepfamily experience. Among the former socialist countries, Estonia and Latvia had union formation and dissolution indicators pretty close to Sweden, and when accompanied with the childbearing context of the socialist system there, it resulted in the highest stepfamily experience among our observed countries.
Second-union experience in the former socialist countries of Central Europe (the Czech Republic, East Germany, and Hungary), in Western Europe and in Finland and Norway was pretty much the same, but the three former socialist countries had high stepfamily experience since most of the women in second unions had children from first unions. Notably, women in these three former socialist countries had the same stepfamily experience as in Sweden, though the underlying patterns of demographic behavior were largely different. Countries with the lowest prevalence of second unions – Lithuania, Poland, Italy, Spain, and Belgium – all share a relatively strong influence of the Catholic Church.
Our results highlight the different pathways to a stepfamily in Europe, and show that in most European countries a considerable proportion of women enter a stepfamily in childbearing ages, which needs to be considered in studies of fertility.
5. Acknowledgement
Notes
1. Estonian data was available only for the native population. For Latvia we decided to use only data for ethnic Latvians to enhance comparability of these two populations whose behavioral patterns are close to each other. Almost a third of the population of Estonia and about a half in Latvia are of foreign origin. We know from previous research that the demographic behavior of the native-born and immigrant population differs in those countries (Bondarskaya 1994, Katus 1990, Vikat 1994).
References
Andersson, G., Philipov, D. (2002). Life-table representations of family dynamics in Sweden, Hungary, and 14 other FFS countries: A project of descriptions of demographic behavior. Demographic Research [online] 7, 4. Available at http://www.demographic-research.org/volumes/vol7/4/7-4.pdf
Buber, I., Prskawetz, A. (2000). Fertility in second unions in Austria: Findings from the Austrian FFS. Demographic Research 3, 2. Available at http://www.demographic-research.org/Volumes/Vol3/2
Billari, F.C., Philipov, D., Baizan, P. (2001). Leaving home in Europe: The experience of cohorts born around 1960, International Journal of Population Geography 7: 339-356.
Bondarskaya, G. (1994) Ethnic-territorial differences in marital fertility. In: Lutz, W., Scherbov, S., Volkov, A. (eds.). Demographic Trends and Patterns in the Soviet Union Before 1991. London & New York: IIASA: 71–88.
Coleman, D. (1996). New patterns and trends in European fertility: International and sub-national comparisons. In: Coleman, D. (ed.). Europe's population in the 1990s. Oxford University Press: 1–61.
David, H.P. (ed.) (1999). From Abortion to Contraception: A Resource to Public Policies and Reproductive Behavior in Central and Eastern Europe from 1917 to the Present. Westport, Connecticut/ London: Greenwood Press. Haskey, J.C. (1993). Formation and dissolution of unions in the different countries of
Europe. In: Blum, A., Rallu, J.L. (eds.). European Population. Vol. 2. Demographic Dynamics. Paris: John Libbey Eurotext: 211–229.
Henz, U. (2002). Childbirth in East and West German stepfamilies: Estimated probabilities from hazard rate models. Demogrphic Research [online] 7, 6. Available at http://www.demographic-research.org/Volumes/Vol7/6/7-6.pdf. Huinink, J., Konietzka, D. (2000). Leaving parental home in the Federal Republic of
Germany and the GDR, paper presented at the Workshop on 'Leaving Home - A European Focus', Max Planck Institute for Demographic Research, September 2000. Available at
http://www.demogr.mpg.de/Papers/workshops/000906_paper11.pdf
Kiernan, K. (1996). Partnership behaviour in Europe: Recent trends and Issues. In: Coleman D (ed.). Europe's population in the 1990s. Oxford University Press: 62–91.
Kiernan, K. (1999a). Cohabitation inWestern Europe. Population Trends, 96: 26-32. Kiernan, K. (1999b). Childbearing outside marriage in Western Europe. Population
Trends, 98: 11-22.
Klinger, A. (1991). Les politiques familiales en Europe de l'Est. Population, 46, 3, 511-526
Kohler, H.-P., Billari, F.C., Ortega, J.A. (2002). The emergence of lowest-low fertility in Europe during the 1990s. Population and Development Review, 28(4): 641–680.
Lesthaeghe, R., Moors, G. (1996) Living Arrangements, Socio-Economic Position, and Values Among Young Adults: A Pattern Description for France, West Germany, Belgium, and the Netherlands, 1990, In: Coleman, D. (ed.). Europe's population in the 1990s. Oxford University Press: 163-221.
Lesthaeghe, R., van de Kaa, D.J. (1986). Twee Demografische Transities? (Two Demographic Transitions?). In: van de Kaa, D.J., Lesthaeghe, R. (eds.). Bevolkning: Groei en Krimp (Population: Growth and Decline). Deventer: van Loghem Slaterus: 19-68.
Mazuy M., Toulemon L. (2001) Étude de l'histoire familiale : premiers résultats de l'enquête en ménages. Ined, coll. Dossiers et recherches, n° 93, 83 pages. Rendall, M.S., Clarke, L., Peters, H.E., Ranjit, N., Verropoulou, G. (1999). Incomplete
reporting of men's fertility in the United States and Britain: a research note. Demography 36, 1: 135-144.
StataCorp (2001). Stata Statistical Software: Release 7.0. College Station, TX: Stata Corporation.
Thomson, E., Godecker, A.L. (2000). Intended and unintended stepfamily fertility. Paper presented at the annual meeting of the Population Association of America, Los Angeles, March 23–25, 2000.
Thomson, E., Hoem, J.M., Vikat, A., Prskawetz, A., Buber, I., Toulemon, L., Henz, U., Godecker, A.L., Kantorova, V. (2002). Childbearing in stepfamilies: How parity matters. In: Klijzing, E., Corijn,M. (eds.). Fertility and Partnership in Europe: Findings and Lessons from Comparative Research. Volume II. Geneva/New York: United Nations: forthcoming.
Thomson, E. (1997). Her, His and Their Children: Influences on Couple Childbearing Decisions. National Survey of Families and Households Working Paper #76, Center for Demography and Ecology, University of Wisconsin-Madison, Madison, WI, 1997.
Toulemon, L. (1997). The Fertility of Step-families: The Impact of Childbearing before the Current Union. Paper presented at the Annual Meeting of the Population Association of America, Washington, DC, 1997.
Toulemon, L., Lapierre-Adamcyk, É. (1995). Demographic Patterns of Motherhood and Fatherhood in France. Paper presented at the IUSSP Anthropology and Demography Committee Seminar on Fertility and the Male Life Cycle in the Era of Fertility Decline, Zacarecas, November 1995.
Toulemon, L. (2001). Men’s fertility and family size as compared to women’s, XXIVth meeting of the IUSSP, Brazil, 2001.
UN ECE PAU. FFS model questionnaire for women. Available at
http://www.unece.org/ead/pau/ffs/design22.htm
Van de Kaa, D. (1987). Europe’s Second Demographic Transition. Population Bulletin 41, 1
Vikat, A. (1994). Family Formation in Estonia. Publications of the Finnish Demographic Society, 15. Helsinki: Finnish Demographic Society.
Vikat, A., Hoem, J.M., Thomson, E. (1999). Stepfamily fertility in contemporary Sweden: The impact of childbearing before the current union. Population Studies 53: 211–225.
Appendix: Graphical represenation of data from Table 4
Figure A: Plot of countries by the percentage of women with pre-union children at second union formation of all second unions formed before age 30 / by age 35, and the percentage of women who enter a second union by age 30 / by age 35, birth cohort 1952–1955, 1956-59, 1960-64.
A1: Cohort born in 1952–1955, by age 30
CZE
SUI
AUT SWE
NOR
FIN
GER_W GER_E
POL
BEL
SPA ITA
EST
FRA SLO HUN
LAT
LIT
0% 10% 20% 30% 40% 50% 60% 70% 80% 90% 100%
0% 5% 10% 15% 20% 25% 30%
Percentage of women who had formed a second union by age 30
Percentage of women who have children when they enter a
second union among those who had formed a second union by
A2: Cohort born in 1956–1959, by age 30 LIT
LAT
HUN SLO
FRA
EST
ITA SPABEL POL
GER_E
GER_W FIN
NOR
SWE AUT
SUI CZE
0% 10% 20% 30% 40% 50% 60% 70% 80% 90% 100%
0% 5% 10% 15% 20% 25% 30%
Percentage of women who had formed a second union by age 30
Percentage of women who have children when they enter a
second union among those who had formed a second union by
LIT LAT
HUN SLO
FRA
EST
ITA
SPA BEL
POL GER_E
GER_W
SWE AUT
SUI CZE
0% 10% 20% 30% 40% 50% 60% 70% 80% 90% 100%
0% 5% 10% 15% 20% 25% 30%
Percentage of women who had formed a second union by age 30
Percentage of women who have children when they enter a
second union among those who had formed a second union by
age 30
A4: Cohort born in 1952–1955, by age 35 CZE
SUI AUT
SWE NOR
FIN GER_W GER_E POL
BEL
SPA ITA
EST
FRA SLO
HUN LAT LIT
0% 10% 20% 30% 40% 50% 60% 70% 80% 90% 100%
0% 5% 10% 15% 20% 25% 30%
Percentage of women who had formed a second union by age 35
Percentage of women who have children when they enter a
second union among those who had formed a second union by
A5: Cohort born in 1956–1959, by age 35
Notes:
Finland is missing from graphs A3 and A5 because of the earlier time of the survey: the 1956–1959 cohort could not be observed until age 35 and the 1960–1964 cohort was not observed until age 30.
Norway is represented by the 1950 cohort in graphs A1 and A4 and the 1955 cohort in graph A2; not represented in graphs A3 and A5 because of the early time point of the survey.
Sweden is represented by the 1949 cohort in graphs A1 and A4, the 1954 cohort in graphs A2 and A5, and the 1959 cohort in graph A3.
LIT
LAT
HUN SLO
FRA
EST
ITA SPA
BEL POL
GER_E
GER_W SWE
AUT
SUI CZE
0% 10% 20% 30% 40% 50% 60% 70% 80% 90% 100%
0% 5% 10% 15% 20% 25% 30%
Percentage of women who had formed a second union by age 35
Percentage of women who have children when they enter a
second union among those who had formed a second union by
Figure B: Change from cohort 1952–1955 to 1956-1959 in the country position by women’s experience of second unions and the percentage of second unions with pre-union children.
Corresponds to change from plot A4 to plot A5 in Figure A.
Note: Because of earlier time point of the survey, the 1956–1959 cohort could not be observed until age 35 in Finland, the same applies to the 1955 and 1960 cohorts in Norway.
HUN BEL CZE LIT SWE SUI POL ITA SWE AUT BEL FRA GER_E GER_W SUI ITA SPA CZE HUN POL SLO EST LAT LIT FRA EST LAT GER_E SPA SLO GER_W AUT 0% 10% 20% 30% 40% 50% 60% 70% 80% 90% 100%
0% 5% 10% 15% 20% 25% 30%
Percentage of women who had formed a second union by age 35
Percentage of women who have children when they enter a