Application of Artificial Neural Network and Genetic
Algorithm for Predicting three Important Parameters in
Bakery Industries
H. Abbasi1*; Z. Emam-Djomeh2; S. M. Seyedin3
1: Department of Food Science and Technology, Khorasgan (Isfahan) Branch, Islamic Azad University, Isfahan, Iran
2:Department of Food Science and Engineering, Faculty of Biosystem Engineering, Campus of Agriculture and Natural Resources, University of Tehran, Karaj, Iran
3:Department of Food Science and Technology, Faculty of Agriculture and Natural Resources, Science and Research Branch, Islamic Azad University, Tehran, Iran
Received: November, 3, 2011 Accepted: June, 9, 2012
ABSTRACT
Farinograph is the most frequently used equipment for empirical rheological measurements of dough. It’s useful to illustrate quality of flour, behavior of dough during mechanical handling and textural characteristics of finished products. The percentage of water absorption and the development time of dough are the most important parameters of farinography for bakery industries during production. However, farinograph quality number is also a profitable factor for rapid evaluation of flour. Our purpose in present research is to apply artificial neural networks (ANNs) for predicting three important parameters of farinograph from simple measurable physicochemical properties of flour. Genetic algorithm (GA) was also applied in the training phase for optimizing different parameters of ANN’s structure and inputs. Sensitivity analyses were also conducted to explore the ability of inputs in predicting the networks outputs. Two neural networks were developed; the first for modeling water absorption and dough development time and the second for modeling farinograph quality number. Both developed ANNs using GA have excellent potential in predicting the farinograph properties of dough. In developed models, gluten index and Zeleny, suitable parameters for qualitative measurements of samples, played the most important role for predicting dough farinograph characterisations.
Keywords: Artificial Neural Network; Genetic Algorithm; Water Absorption; Dough Development Time;
Farinogrph Quality Number
* Correspondence Author Email: [email protected]; [email protected]
INTRODUCTION
The rheological characteristics of dough are important for obtaining useful information about quality of flour; behavior of dough during handling such as dividing and rounding; textural characteristics of the products; and also process efficiency (Dobraszczyk & Morgenstern, 2003). Bakery industries usually receive raw materials with variable quality and complicate effects on dough and products quality (Gaines et al., 2006; Bettge et al., 1989; Rashed et al., 2007). Therefore, In order to satisfy consumer demands, designe standard and reliable procedures for controlling product quality and safety are necessary. Rheological measurements of every batch in the production line are very useful, but usually impractical because of time, experience and equipments requirements. In contrast, assessment of the physicochemical properties of flour is feasible. In the other hand, wheat-milling industries can easily supply this data to bakers. Therefore, predicting dough rheological properties from simple measurable factors enables online process control and helps modify subsequent process conditions for preventing economic loss and deterioration of product quality.
In the literature, there are several researches that applied different mathematical modeling methods for extrapolating the range of conditions that dough experiences during processes from rheological measurements made under simple, well-defined laboratory conditions (Scott & Richardson, 1997; Binding et al., 2003; Fan et al., 1994). Nonetheless, prediction of dough rheological properties has historically proved to be complex because of a consequence of special viscoelastic characteristics of dough with gas-retaining ability and its dependency to various parameters with linear or non-linear interactions (Ruan et al., 1995). In recent years, various multivariate statistical regression methods have become standard tools in food researches such as cereal industry. For instance, partial least squares regression (PLS) use to predict bread properties (Andersson et al., 1994; Sahlstrom et al., 1998; Engelsen et al., 2001; Magnus et al., 2000), regression methods have also been used to classify and predict wheat quality (Baker et al., 1999). While these methods can be applicable in examining especial problems, they are not profitable for many others.
ANNs have recently been applied in different fields of food science, such as simulating processes like drying behavior of different agricultural materials (Erenturk & Erenturk,
2007; Kerdpiboon et al., 2006; Martynenko & Yang, 2006; Movagharnejad & Nikzad, 2007; Momenzadeh et al., 2011), osmotic dehydration (Trelea et al., 1997) and cross-flow microfiltration (Dornier et al., 1995). They have also been used in other fields of food science, such as classification (Jacobsen et al., 2001), prediction (Alvarez, 2009; Shankar & Bandyopadhyay, 2007) and food-quality evaluation (Goyache et al., 2001; Broyart & Trystram, 2003).
Genetic algorithm is a randomized method that is based on survival of the fittest generation by applying special operations similar to the natural phenomena such as selection, genetic operation and replacement. Reproduction operator selects an individual to survive by copying itself directly into the next generation, crossover creates two new chromosomes from two existing chromosomes by randomly choosing and exchanging a crossover point of the parents and mutation operator produces new chromosomes by randomly changing the genes of existing chromosomes. In GA process, an initial population of randomly generated chromosomes is selected as parents to generate offspring by genetic operations. Chromosomes with multiple genes work in parallel to represent the best solution to a problem. The fitness of the offspring is evaluated and the individuals with the higher fitness in the population are selected as parents and produce new individuals for the next generation. Therefore, during successive iterations, the initial chromosomes advance to stronger ones. The best population chromosomes become a highly evolved and superior solution to the problem (Saxena & Saad, 2007; Gosselin et al. 2009).
GA is a significantly efficient method for optimizing the most important parameters of neural network structures that have significant influence on performance efficiency of ANNs such as hidden layers number, the processing elements number (PE), the learning rates and the momentum coefficients (Kim et al., 2004; Majdi & Beiki, 2010; Saemi et al., 2007; Mohebbi et al., 2008).
53
Application of Artificial Neural Network and Genetic Algorithm for Predicting three Important Parameters in …
MATERIALS AND METHODS Sample preparation and properties
One hundred and twenty samples of white flour (18% partially debranned flour) were collected from different provinces of Iran. The purpose was to examine samples with extensive variations of physiochemical and rheological properties, in order to develop applicable predictive models to a wide variety of industry requirements.
Seven easily measurable physicochemical properties of samples with notable effects on dough qualities and bakery industries were selected from literature as the neural network’s inputs: total protein content, total ash content, wet gluten, gluten index, falling number, Zeleny and particle size. These properties were evaluated according to the approved methods: 46-19, 08-01, 56-81B, 38-12A, 56-60 and 50-10 respectively (AACC, 1995).
Rheological properties of samples were evaluated with the Brabender farinograph (Brabender, Duisburg, Germany) according to the approved methods 54-21 (AACC, 1995). Each measurement was carried out three times and the results were averaged.
Artificial neural network model
One hundred and twenty patterns were normalized and randomly divided into 85, 15 and 20 data sets for training, validating and testing networks respectively. In other to improve the accuracy of the developed models, two neural networks were designed: the first for modeling water absorption of flour and development time of dough and the second for modeling farinograph quality number. The inputs of both networks were seven physicochemical properties of flour. A multi-layered perceptron (MLP) and a generalized feed-forward (GFF) artificial neural networks with a back-propagation (BP) training algorithm – the most common architectures for predicting different procedures – were applied for modeling each network and the best results are reported. Multilayer perceptron networks often have one input layer, one or more hidden layers, along with an output layer of neurons. Multiple layers of neurons except the input neurons have transfer functions that allow the network to learn linear or non-linear relationships between input and output vectors (Karray & Silva, 2004). Moreover the usual neurons connections in MLP, the generalized feed-forward networks have special connections that jump over one or more layers. In theory, a MLP can solve any problem that a generalized feed-forward network can solve. In practice, however, generalized
feed-forward networks sometime solve the problem much more efficiently.
In stage of developing networks, three and four layer neural networks with one and two hidden layer respectively were applied and the ones with the best performance are reported. Artificial neural networks need a relatively simple structure that can keep their errors within tolerance limits. An ANN with too few neuron numbers in the hidden layer cannot properly learn the input and output variables in the training stage. But more increasing the number of nodes enhances structural complexities, connection extends and size of the network. Therefore, the required time for training and computing process is raised. This situations sometimes improves network performance; but sometimes not (Saemi et al., 2007). Therefore, in other to develop the neural network with the best performance, neuron numbers of hidden layers were changed from 1 to 3x (where x is the number of input neurons) (Kim
et al., 2004) in increments of 1 neuron. Genetic algorithms (GAs) were applied in training phase for optimizing the ANN structure and its parameters (input parameters, numbers of neurons in the hidden layer, coefficient of learning rate and momentum). In this procedure, an initial population of networks with different sets of parameters (genes) is randomly created. These parameters were automatically tuned through GA training by each chromosome of population. All chromosomes in the population pool had at least one different neural-network parameter value in ANN’s structure. Some experiments were carried out to achieve an initial setting of GA parameters such as genetic operator rates, number of generation, population size, etc. The achieved values are based on literature review and computational experiences (Javadi et al., 1999; Majdi et al., 2010; Podgorelec & Kokol. 2002). The range of neuron numbers in the hidden layers, the quantities of step size and momentum were set 1-21, 0-1 and 0-1 in 1, 0.1 and 0.1 increments respectively.
used for extracting chromosomes from the current population and creating an intermediate population. The reproduction operator of this study was roulette-wheel selection based on a ranking algorithm: the chromosomes were ranked in order of their fitness with the roulette-wheel operator, selecting according to their relative fitness and placing them into the intermediate population. By applying the one-point crossover and uniform mutation with adjusted probability to 0.9 and 0.01 respectively, the next generation was formed and the newly created chromosomes were evaluated. This procedure for evaluation and reproduction of all chromosomes was repeated
until the completion criteria (achieving 10,000 epochs, or didn’t improving in cross-validation’s MSE during 200 epochs) were satisfied. The fitness of the population usually improves with each new generation and eventually evolving a solution close to the optimal. The optimal configuration network with the minimum mean square error in the cross-validation data set was selected for testing. Mean square error (MSE) and mean absolute error (MAE), used as criteria for evaluating ANN performance (Erenturk & Erenturk, 2007). They were calculated using Eq. (1) and Eq. (2) respectively:
ni D P
X
X
n
MSE
1
2
)
(
1
(1)
ni
P D
X
X
n
MAE
1
1
(2)
Where n is the number of data points, and XD
and XP are the desired and predicted values of
parameters, respectively. The procedures of networks designing were managed in NeuroSolutions environment (version number 5.07). This software gives users the ability to train a neural network, and test its performance directly.
Identification of sensitive input variables This section looks at how changing the physicochemical properties of flour can affect the farinograph-measured properties of dough made from it. For identification-sensitive input variables (sensitivity about the mean), the developed network outputs were computed by
varying the first input between the mean ± one standard deviation, while all other inputs were fixed at their respective means. This process was repeated for each input and generated the variation of each output with respect to the variation of each input.
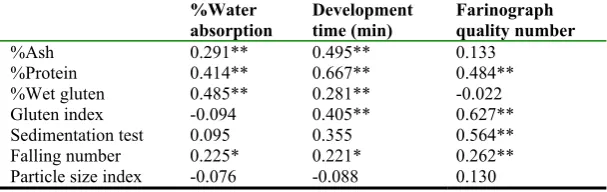
RESULTS AND DISCUSSION Correlation coefficient
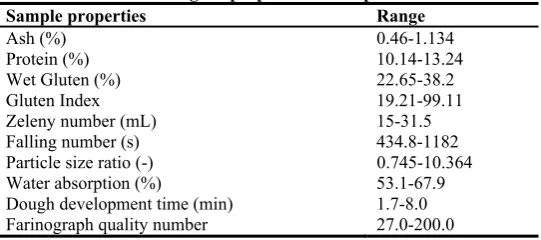
The minimum-maximum values of physicochemical and three important farinograph-measured properties of samples and correlation coefficients of them were expressed in table 1 and 2 respectively.
Table 1: Minimum-maximum values of physicochemical and
rheological properties of samples Sample properties Range
Ash (%) 0.46-1.134 Protein (%) 10.14-13.24 Wet Gluten (%) 22.65-38.2 Gluten Index 19.21-99.11 Zeleny number (mL) 15-31.5 Falling number (s) 434.8-1182 Particle size ratio (-) 0.745-10.364 Water absorption (%) 53.1-67.9 Dough development time (min) 1.7-8.0 Farinograph quality number 27.0-200.0
Water absorption is a very important factor in the bakery industry. Dough-handling properties and quality of baked products' are influenced to water absorption of flour (Larsen & Greenwood, 1991). Flour with sufficient water-absorption
55
Application of Artificial Neural Network and Genetic Algorithm for Predicting three Important Parameters in …
between flour ash content and water absorption of flour. Complex carbohydrates, such as hemicelluloses in bran increase flour's water absorption. This result is supported by research in 2006 that reported the range of water absorption of different extracted rate flours with different ash contents in the 56 to 66% (Azizi et al., 2006). Total ash content also has significant effects on other properties of farinography. Flour with higher ash content contains larger amounts of bran and dietary fiber; these materials are
considered to disturb the continuous gluten network structure in dough (Maeda & Morita, 2001). The effect of ash content on dough development time is due to the presence of increased bran particles, which may interfere to the quick development of gluten and the hydration of endosperm; therefore, additional time is required for all components of flour to completely absorb water (Vetrimani et al., 2005).
Table 2: Correlation coefficients between inputs and outputs of networks Farinograph quality number Development time (min) %Water absorption 0.133 0.495** 0.291** %Ash 0.484** 0.667** 0.414** %Protein -0.022 0.281** 0.485** %Wet gluten 0.627** 0.405** -0.094 Gluten index 0.564** 0.355 0.095 Sedimentation test 0.262** 0.221* 0.225* Falling number 0.130 -0.088 -0.076 Particle size index
* = Significant P<0.05 ** = Significant P<0.01
Water absorption, development time and farinograph quality number have a positive significant correlation with total protein content of flour. Increasing wet gluten has also significant positive effects on water absorption and dough-development time. (Mueen-ud-din, 2009; Robertson & Cao, 2001).
Gluten index and sedimentation tests are the usual criteria for evaluating protein quality (Hrušková et al., 2000; Curic et al., 2001). Both factors have significant positive correlations with development time and farinograph quality number.
Falling number is an indicator of amylase activity of flour. According to the table 2, with increasing amylase activity of flour, water absorption, development time and farinograph quality number of dough are decreased. This is due to the weakening of mixed dough in the presence of low-molecular-weight dextrins, which are produced from damaged starches by amylase hydrolysis (Maeda & Morita, 2003; Kim
et al., 2006).
Particle size of flour is influenced by the milling process conditions and the structural characteristics of wheat. During milling, the weak protein bonds in wheat endosperm can easily break and produce small particles but strong protein bonds are not easily broken. Therefore, serious middling reduction produces fine flour with a high level of damaged starch that affect rheological properties of dough. In present
research, the higher index of particle size indicates the flour with smaller particles but in the evaluated extent of particle size of flours, there are not significant effects of measured-farinograph properties.
ANN modeling performance
According to the results of preliminary experiments by trial and error, selecting three farinograph parameters as outputs of a neural network reduce convergence rate and prediction accuracy of the developed models. Therefore, in order to improve precision of the model, we dedicate water absorption and dough development time as outputs of a network and farinograph quality number as an output of the other one. The input parameters of both network into the first layer of the ANNs were total protein content, total ash content, wet gluten, gluten index, sedimentation number, falling number and particle size index.
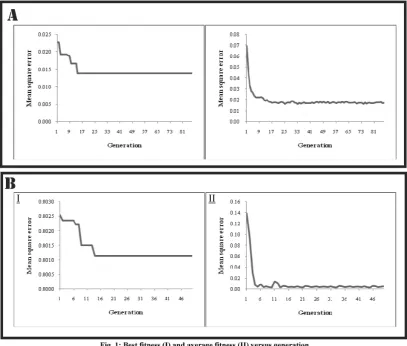
during training ANN-GA. The best and the average fitness value versus the number of
generations are demonstrated in Figures 1 (A).
Table 3: Cross-validation error obtained from trained networks with genetic algorithm
Table 3 also summarizes the minimum MSE, the generation when minimum MSE was obtained and the final MSE for the best and average fitness.
The best network would be the one that had the lowest training error and the highest fitness and the average fitness is the average of the minimum MSE taken across all of the networks within the
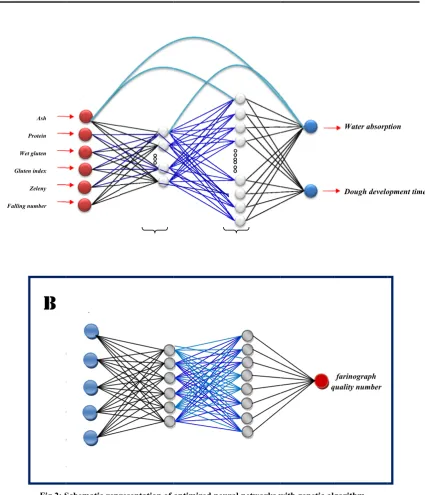
corresponding generation. The optimal network is a four layer generalized feed forward neural network with seven nodes in the first hidden layer and twelve neurons in the second hidden. Figure 2 (A) displays the topology of the best neural network for predicting present factors and table 4 demonstrates other structural parameters of it.
Optimization Summary Best Fitness Average Fitness
Generation 14 10
N In F S O In F In Applic Table 4 Neurons nput layer irst hidden laye econd hidden la Output layer
nput - Second h irst hidden - Ou nput - Output
For e in test
Fa
cation of Artifici
Prot Wet glu Gluten ind Zele Particle s
B
Fig.2: S4: Structural p N ne
6
er 7 ayer 12
2 hidden -
utput - -
evaluating the phase, test d
Ash Protein Wet gluten Gluten index Zeleny alling number
ial Neural Netw
tein uten dex eny size Schematic repr parameters of Number of
eurons T
- H 2 H B - - -
e performance data set that
ork and Genetic
resentation of the developed Transfer functi Hyperbolic tang Hyperbolic tang Bias
e of the netwo had never be
c Algorithm for P
optimized neu
network for p
ion Mom(Syna
- gent 0.057 gent 0.992 0.372 0.278 0.174 0.761 ork
een entra
Predicting three
ural networks w
redicting wate mentum rate apse) 7 2 2 8 4 1 ncountered t aining fed to
Important Param
q
with genetic alg
er absorption a Step size (Synapse) - 0.214 0.984 0.133 0.588 0.244 0.015
o the netw o the develop
meters in …
farinograph quality number gorithm and developme Momentum rate (Axon - 0.135 0.986 0.557 - - - work during ped network Water absorp Dough develo 57 ent time m
n) Step size(Axon)
outputs were predicted. The measured water absorption and dough development time in laboratory were compared with the predicted ones and useful parameters for evaluating the network performance were computed. The
performance of the model on data test were evaluated by suitable criteria such as MAE, NMSE, MSE, correlation coefficients (r) and other beneficial parameters and the results are reported in Table 5.
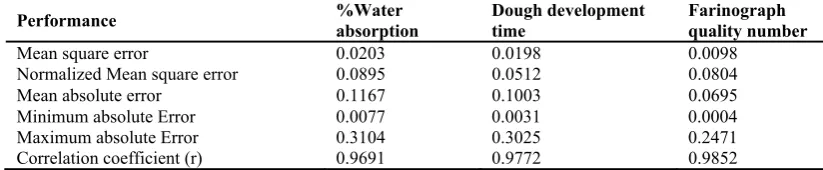
Table 5: Performance of the developed ANN-GA models in predicting outputs
Performance %Water absorption Dough development time Farinograph quality number
Mean square error 0.0203 0.0198 0.0098 Normalized Mean square error 0.0895 0.0512 0.0804 Mean absolute error 0.1167 0.1003 0.0695 Minimum absolute Error 0.0077 0.0031 0.0004 Maximum absolute Error 0.3104 0.3025 0.2471 Correlation coefficient (r) 0.9691 0.9772 0.9852
According to the mathematical expressions of r, MAE, and NMSE for ANNs, predictions of an ANN are optimum if r, MAE, NMSE and MSE are close to 1, 0, 0 and 0, respectively. The developed network with GA strategy was very successful in predicting water absorption and dough development time. Average of mean square error and correlation coefficient between measured and predicted water absorption and dough development time were 0.0201 and 0.9732 respectively.
The second network was design for predicting farinograph quality number. After planning and creating presupposition networks, they were trained using GA approach. The optimal network with the lowest error was designated after 14
generations during training ANN-GA. Mean square error of it were 0.0011 for validating data set. The best and the average fitness value versus the number of generations are displayed in Figures 1 (B) and summarizations of them are demonstrated in table 6.
The optimal network was a four layer multilayer perceptron with six neurons in the first hidden layer and eight neurons in the second hidden layer. Figure 2 (B) demonstrates the topology of the developed ANN-GA for predicting the farinograph quality number and table 7 illustrates structural parameters of it.
Table 6: Cross-validation error obtained from trained networks with genetic algorithm
Table 7: Structural parameters of the developed network for predicting farinograph quality number
Neurons Number of neurons Transfer function Momentum rate (Synapse) (Synapse) Step size Momentum rate (Axon) Step size (Axon)
Input layer 5 - - - -
First hidden layer 6 Hyperbolic tangent 0.211 0.718 0.037 0.600 Second hidden layer 8 Hyperbolic tangent 0.987 0.486 0.253 0.209 Output layer 1 Linear 0.317 0.154 0.783 0.378
After testing the developed network, suitable factors for valuating network performance were computed and present in Table 5. Farinograph quality number can predict with mean square error and correlation coefficient of 0.0098 and 0.9852 respectively. In figure 3 experimented test
data sets that had never been fed into the networks during genetic training were depicted versus predicted ones. Results of predicting water absorption, development time and farinograph quality number are illustrated in the first, second and the third figures respectively.
Optimization Summary Best Fitness Average Fitness
Generation 14 10
59
Application of Artificial Neural Network and Genetic Algorithm for Predicting three Important Parameters in …
In literature, there are several studies about using ANN in prediction of different parameters of dough rheologicl properties. Ruan in 1995 developed a neural network for predicting dough rheology according to the mixing properties. The acquired mixer torque curve and the measured rheological properties such as farinograph peak, extensibility and maximum resistance to
extension were used as inputs and outputs of a network respectively. The average absolute error of predicted farinograph peak (BU) was 23.6 (Ruan et al., 1995).
parameters of their farinograph-measured properties as outputs of a network. They trained an ANN by trial and error (Razmi-Rad et al., 2007). Prediction accuracy of this study was significantly lower than the results of current research. For example coefficient of determination, R2, of the linear regression line
between the predicted water absorption of flour from the neural network model and the desired output was 0.6157.
Greater prediction accuracy of present research than the results of previous studies is illustrated GA’s ability as more powerful techniques than trial and error in training an ANN for optimizing structural parameters of it, even with less number of data set. Furthermore, selecting useful input and output variables for a network also significantly improved the performance of ANNs. Generally, ANN-GA is a powerful method in estimating farinograph properties of dough. Developed models has significant potential to be used in industries for evaluating and improving technological performance of dough during production and prohibiting economical loss due to increasing product quality.
Sensitivity analyses
Sensitivity analyses were carried out to select factors with the largest contribution to the network and measures the relative importance of the ANN's inputs. They illustrate how the optimised model affects outputs in response to variations of each input. It is very important for selecting effective parameters in the future studies on modeling of dough rheological properties. The results of sensitivity test are demonstrated in Figure 4. The first and second figures show the sensitivity of water absorption and dough development time to the inputs in the developed network for them and the last one demonstrate the sensitivity of farinograph quality number to the inputs in the developed network for it.
Particle size of flour, as the least important input of the developed ANN-GA for prediction water absorption and dough development time was removed from the structure of ANN. Therefore, sensitivity analyses were performed on the other six inputs. The sedimentation value was the most sensitive variable on water absorption in the developed ANN. Gluten index and total protein content of flour are the second sensitive variables. Amylase activity of flour that is represented by falling number is partially sensitive variable with positive effects on water absorption (Kim et al., 2006). Other inputs such as wet gluten and total ash content are the least
sensitive variables with respect to water absorption.
Dough development time have the most sensitivity to variations of gluten index and sedimentation value. Wet gluten is the next sensitive variables and other parameters such as total protein content, falling number and total ash content of flour are the least sensitive variables respectively.
Gluten index is the most sensitive variable in developed ANN for predicting farinograph quality number. The sensitivity of other parameters almost is the same.
Generally, applied variables for evaluating qualitative properties of flour such as gluten index and Zeleny are the most sensitive inputs in developed models for predicting outputs.
CONCLUSION
In present work, neural networks with error back-propagation learning algorithms were applied for predicting three important farinograph properties of dough (water absorption, dough development time and farinograph quality number) as profitable rheological parameters for evaluating technological aspects in bakery industries that affected by physicochemical properties of flour. Seven important physicochemical properties were used as inputs: total protein content, total ash content, wet gluten, gluten index, amylase activity, Zeleny and particle size. Two neural networks were developed, the first for modeling water absorption and dough development time and the second for modeling farinograph quality number. The ANNs were trained using GA for determining network topology (neuron number of hidden layers, momentum and step size) in less time with acceptable performance. Further, for deducing prediction errors of ANN, GA optimise inputs with deleting negligible inputs in modeling outputs. The optimised ANNs-GA can potentially predict outputs with credible performance. The farinograph quality number was the best predictable parameter with developed ANN-GA.
We could also determine the sensitivity of each input on outputs. Of the seven investigated inputs, changes in quantity of gluten index and also Zeleny of flour have the most effect on changing every parameter of outputs in developed models.
ACKNOWLEDGMENTS
61
Application of Artificial Neural Network and Genetic Algorithm for Predicting three Important Parameters in …
REFERENCES
Approved methods of the American Association of Cereal Chemists (AACC) (1995) Method 46-19, 08-01, 56-81B, 38-12A, 56-60, 50-10 and 54-21 (9th ed). St. Paul, MN: American Association of Cereal Chemists, Inc.
Alvarez, R. (2009). Predicting average regional yield and production of wheat in the Argentine Pampas by an artificial neural network approach. European Journal of Agronomy., 30, 70-77.
Andersson, R., Hamalainen, M., Aman, P. (1994). Predictive modeling of the bread-making performance and dough properties of wheat Journal of Cereal Science., 20, 129-138.
Azizi, M. H., Sayeddin, S. M., Payghambardoost, S. H. (2006). Effect of flour extraction rate on flour composition, dough rheology characteristics and quality of flat breads. Journal of Agriculture Science and Technology., 8, 323-330.
Baker, S., Herrman, T. J., Loughin, T. (1999). Use of regression and discriminant analyses to develop a quality classification system for hard red winter wheat. Cereal Chemistry., 76, 890-893.
Bettge, A., Rubenthaler, G. L., Pomeranz, Y. (1989). Alveograph algorithms to predict functional properties of in bread and cookie baking. Cereal Chemistry., 66, 81-86. Binding, D. M., Couch, M. A., Sujatha, K.
S.,Webster, M. F. (2003). Experimental and numerical simulation of dough kneading in filled geometries. Journal of Food Engineering., 58, 111-123.
Broyart, B., Trystram, G. (2003). Modelling of Heat and Mass Transfer Phenomena and Quality Changes During Continuous Biscuit Baking Using Both Deductive and Inductive (Neural Network) Modelling Principles.
Food and Bioproducts Processing., 81, 316-326.
Curic, D., Karlovic, D., Tusak, D., Petrovic, B., Dugum, J. (2001). Gluten as a standard of wheat flour quality. Food Technology and Biotechnology., 39, 353-361.
Dobraszczyk, B. J., Morgenstern, M. (2003). Rheology and the breadmaking process.
Journal of Cereal Science., 38, 229-245. Dornier, M., Decloux, M., Trystram, G., Lebert,
A. (1995). Dynamic modeling of cross-flow microfil tration using neural networks.
Journal of Membrane Science., 98, 263-273.
Engelsen, S. B., Jensen, M. K., Pedersen, H. T., Norgaard, L., Munck, L. (2001). NMR-baking and multivariate prediction of instrumental texture parameters in bread.
Journal of Cereal Science., 33, 59-69. Erenturk, S., Erenturk, K. (2007). Comparison
of genetic algorithm and neural network approaches for the drying process of carrot.
Journal of Food Engineering., 78, 905-912. Fan, J., Mitchell, J. R., Blanshard, J. M. V.
(1994). A computer simulation of the dynamics of bubble growth and shrinkage during extrudate expansion. Journal of Food Engineering., 23, 337-356.
Gaines, C. S., Fregeau Reid, J., Vander Kant, C., Morris, C. F. (2006). Comparison of Methods for Gluten Strength Assessment.
Cereal Chemistry., 83, 284-286.
Goyache, F., Bahamonde, A., Alonso, J., Lopez, S., del Coz, J. J., Quevedo, J. R., Ranilla, J., Luaces, O., Alvarez, I., Royo, L. J., Diez, J. (2001). The usefulness of artificial intelligence techniques to assess subjective quality of products in the food industry. Trends in Food Science & Technology., 12, 370-381.
Gosselin, L., Tye-Gingras, M., Mathieu-Potvin, F. (2009). Review of utilization of genetic algorithms in heat transfer problems.
International Journal of Heat and Mass Transfer.,52, 2169-2188.
Hrušková, M., Hanzliková, K., Varáček, P. (2000). Wheat and flour quality relations in a commercial mill. Czech Journal of Food Science., 19, 189-195.
Jacobsen, S., Nesic, L., Petersen, M.,Sondergaard, I. (2001). Classification of wheat varieties: Use of two-dimensional gel electrophoresis for varieties that can not be classified by matrix assisted laser desorption/ionization-time of flight-mass spectrometry and an artificial neural network. Electrophoresis., 22, 1242-1245. Javadi, A. A., Farmani, R., Toropov, V. V.,
Snee, C. P. M. (1999). Identification of parameters for air permeability of shotcrete tunnel lining using a genetic algorithm.
Computers and Geotechnics., 25, 1-24. Karray, F. O., Silva, C. D. (2004).
Fundamentals of artificial neural networks. In Soft Computing and Intelligent Systems Design (Theory, Tools and Applications)., 223-248.
63
Application of Artificial Neural Network and Genetic Algorithm for Predicting three Important Parameters in …
a function of fractal dimension and moisture content. Food Research International., 39, 1110-1118.
Kim, G. H., Yoon, H. E., An, S. H., Cho, H. H. Kang, K. I. (2004). Neural network model incorporating a genetic algorithm in estimating construction costs. Building and Environment 39, 1333-1340.
Kim, J. H., Maeda, T., Morita, N. (2006). Effect of fungal alpha-amylase on the dough properties and bread quality of wheat flour substituted with polished flours. Food Research International., 39, 117-126. Larsen, N. G., Greenwood, D. R. (1991). Water
addition and the physical properties of mechanical dough development doughs and breads. Journal of Cereal Science., 13, 195-205.
Maeda, T., Morita, N. (2001). Effect of quality of hard-type polished-graded flour on breadmaking. Journal of Applied Glycoscience., 48, 63-70.
Maeda, T., Morita, N. (2003). Flour quality and pentosan prepared by polishing wheat grain on breadmaking. Food Research International., 36, 603-610.
Magnus, E. M., Brathen, E., Sahlstrom, S., Vogt, G., Faergestad, E. M. (2000). Effects of flour composition, physical dough properties and baking process on hearth loaf properties studied by multivariate statistical methods. Journal of Cereal Science., 32, 199-212.
Majdi, A., Beiki, M. (2010). Evolving neural network using a genetic algorithm for predicting the deformation modulus of rock masses. International Journal of Rock Mechanics and Mining Sciences., 47, 246-253.
Martynenko, A. I., Yang, S. X. (2006). Biologically inspired neural computation for ginseng drying rate. Biosystems Engineering., 95, 385-396.
Mohebbi, A., Taheri, M., Soltani, A. (2008). A neural network for predicting saturated liquid density using genetic algorithm for pure and mixed refrigerants. International Journal of Refrigeration-Revue Internationale Du Froid., 31, 1317-1327.
Momenzadeh, L., Zomorodian, A., Mowla, D. (2011). Experimental and theoretical investigation of shelled corn drying in a microwave-assisted fluidized bed dryer using Artificial Neural Network. Food and Bioproducts Processing., 89, 15-21.
Movagharnejad, K., Nikzad, M. (2007). Modeling of tomato drying using artificial
neural network. Computers and Electronics in Agriculture., 59, 78-85.
Mueen-ud-din, G. (2009). Effect of wheat flour extraction rates on physico-chemical characteristics of sourdough flat bread. In
National institute of food science and thechnology., Vol. Doctor of Philosophy In Food Technology: University of Agriculture Faisalabad-Pakistan.
Podgorelec, V., Kokol, P. (2002). Evolutionary induced decision trees for dangerous software modules prediction. Information Processing Letters., 82, 31-38.
Rashed, M. A., Abou-Deif, M. H., Sallam, M. A. A., Rizkalla, A. A., Ramada, W. A. (2007). Identification and Prediction of the Flour Quality of Bread Wheat by Gliadin Electrophoresis. Journal of Applied Sciences Research., 3, 1393-1399.
Razmi-Rad, E., Ghanbarzadeh, B., Mousavi, S. M., Emam-Djomeh, Z., Khazaei, J. (2007). Prediction of rheological properties of Iranian bread dough from chemical composition of wheat flour by using artificial neural networks. Journal of Food Engineering., 81, 728-734.
Robertson, G. H., Cao, T. K. (2001). Farinograph responses for wheat flour dough fortified with wheat gluten produced by cold-ethanol or water displacement of starch. Cereal Chemistry., 78, 538-542. Ruan, R., Almaer, S., Zhang, J. (1995).
Prediction of dough rheological properties using neural networks. Cereal Chemistry., 72, 308-311.
Saemi, M., Ahmadi, M., Varjani, A. Y. (2007). Design of neural networks using genetic algorithm for the permeability estimation of the reservoir. Journal of Petroleum Science and Engineering., 59, 97-105.
Sahlstrom, S., Brathen, E., Lea, P., Autio, K. (1998). Influence of starch granule size distribution on bread characteristics.
Journal of Cereal Science., 28, 157-164. Saxena, A., Saad, A. (2007). Evolving an
artificial neural network classifier for condition monitoring of rotating mechanical systems. Applied Soft Computing., 7, 441-454.
Scott, G., Richardson, P. (1997). The application of computational fluid dynamics in the food industry. Trends in Food Science & Technology., 8, 119-124.
Simon, S. J. (1987). More wheat with superior baking quality is needed. Cereal Foods World 32, 323-326.
Trelea, I. C., RaoultWack, A. L., Trystram, G. (1997). Application of neural network modelling for the control of dewatering and impregnation soaking process (osmotic
dehydration). Food Science and Technology International., 3, 459-465.
Vetrimani, R., Sudha, M. L., Rao, P. H. (2005). Effect of extraction rate of wheat flour on the quality of vermicelli. Food Research International., 38, 411-416.