IJPAR |Vol.4 | Issue 3 | Jul-Sep-2015 Journal Home page: www.ijpar.com
Research article Open Access
FORMULATION AND
IN-VITRO
EVALUATION OF MICROSPHERES
EMBEDDED WITH CAPECITABINE
*V.Shivani, C.Radhika, V.Uma Maheshwar Rao
CMR College of Pharmacy, Kandlakoya (V), Rangareddy District, Hyderabad, Telangana 501401
*Corresponding Author: V.ShivaniEmail Id: [email protected]
ABSTRACT
Recent drug discovery using advanced techniques such as genomics, combinatorial chemistry, high throughput screening and in silico three dimensional drug design has yielded drug candidates with low water solubility and thus an inherently low mucosal permeability which makes the development of pharmaceutical formulations difficult. To overcome these, particulate systems like micro particles have been used as a physical approach to alter and improve the pharmacokinetic and pharmacodynamics properties of various types of drug molecules. They have been used in vivo to protect the drug entity in the systemic circulation, restrict access of the drug to the chosen sites and to deliver the drug at a controlled and sustained rate to the site of action. Various polymers have been used in the formulation of micro particles for drug delivery research to increase therapeutic benefit, while minimizing side effects. The review embraces various aspects of micro particle formulations, characterization, effect of their characteristics and their applications in delivery of drug molecules and therapeutic genes.
KEY WORDS: Micro particles, absorption, low solubility.
INTRODUCTION
For many decades, medication of an acute disease or a chronic illness has been accomplished by delivering drugs to the patients via various pharmaceutical dosage forms like tablets, capsules, pills, creams, ointments, liquids, aerosols, injectables and suppositories as carriers. To achieve and then to maintain the concentration of drug administered within the therapeutically effective range needed for medication, it is often necessary to take this type of drug delivery systems several times a day. This results in a fluctuated drug level and consequently undesirable toxicity and poor
efficiency. This factor as well as other factors such as repetitive dosing and unpredictable absorption leads to the concept of controlled drug delivery systems. The objective of controlled release drug delivery includes two important aspects namely spatial placement and temporal delivery of drug. Spatial placement relates to targeting a drug to a specific organ or tissue, while temporal delivery refers to controlling the rate of drug delivery to the target tissue. An approximately designed controlled release drug delivery system can be a major advance towards solving these two problems. Due to this reason that the science and technology responsible for development of controlled release pharmaceuticals
have been and continue to be the focus of a great deal of attention in both industrial and academic laboratories. Controlled release systems include any drug delivery system that “achieves slow release of the drug over an extended period of time.” If the system can provide some control weather this is of a temporal or spatial nature, in other words, if the system is successful in maintaining predictable and reproducible kinetics in the target tissue or cell, it is considered as a controlled release system.
MICROENCAPSULATION
Microencapsulation is a rapidly expanding technology. As a process, it is a means of applying relatively thin coatings to small particles of solids or droplets of liquids and dispersions. Microencapsulation is arbitrarily differentiated from macro coating techniques in that the former involves the coating of particles ranging dimensionally from several tenths of a micron to 5000 microns in If the system only extends the duration of release without reproducible kinetics it is considered as a prolong release system.
APPLICATIONS
• Improved patient convenience and compliance due to less frequent drug administration.
• Reduction in fluctuation in steady-state levels and therefore better control of disease condition and reduced intensity of local or systemic side effects. • Increased safety margin of high potency drugs due
to better control of plasma levels.
• Maximum utilization of drug enabling reduction in total amount of dose administered.
• Reduction in health care costs through improved therapy, shorter treatment period, less frequency of dosing and reduction in personnel time to dispense, administer and monitor patients.
MICROENCAPSULATION BY IONOTROPIC GELATION TECHNIQUE
In this method strong spherical beads with a narrow particle size distribution and low friability could be prepared with high yield and a drug content approaching 91.25 %. The flow properties of micronized or needle like drug crystals were significantly improved by this agglomeration technique when compared with non-agglomerated drug crystals. The ionic character of the polymers
results from pH dependent disintegration of the beads. The objective of controlled release drug delivery includes two important aspects namely spatial placement and temporal delivery of drug.
Spatial placement relates to targeting a drug to a specific organ or tissue, while
Temporal delivery refers to controlling the rate of drug delivery to the target tissue.
MUCOADHESION / BIOADHESION
Mucoadhesive drug delivery system are the systems which utilizes the property of bio adhesion of certain polymers which become adhesive on hydration and can be used for targeting a drug to a particular region of the body for extended periods of time.
The term “mucoadhesion” was coined for the adhesion of the polymers with the surface of the mucosal layer. Bio adhesions are a phenomenon in which two materials at least one of which is biological and are held together by means of interfacial forces. In biological systems, bio adhesion can be classified into 3 types:
1. Adhesion between two biological phases, for example, platelet aggregation and wound healing 2. Adhesion of a biological phase to an artificial substrate, for example, cell adhesion to culture dishes and bio film formation on prosthetic devices and inserts
3. Adhesion of an artificial material to a biological substrate, for example, adhesion of synthetic hydrogels to soft tissues and adhesion of sealants to dental enamel.
ADVANTAGES OF MUCOADHESIVE
SYSTEMS
Mucoadhesive systems have three distinct advantages when compared to conventional dosage forms.
Readily localized in the region applied to improve and enhance the bioavailability of drugs. E.g. testosterone & its esters, vasopressin, dopamine, insulin and gentamycin etc.
Prolong residence time of the dosage form at the site of application and absorption to permit once or twice a day dosing.
AIM AND OBJECTIVES
Aim of the study is to formulate Capacetabine microspheres using different polymers by ionotropic gelation method. The objective of the present study is To conduct preformulation studies by analytical methods.
To develop dosage forms whose bio availabilities of drugs are significantly greater than those observed from conventional solid forms such as tablets and capsules.
To formulate the Capacetabine microspheres using different polymers like sodium alginate, HPMC, Carbopol 940, Guar gum, Xanthum gum in different ratios.
To evaluate the prepared mucoadhesive microspheres.
To choose the better formulation among the prepared formulations based on better release.
METHODOLOGY
Capectibine was mixed with all excipients, used in the formulation in different ratios and subjected to Physical observation/FTIR.
DRUG-EXCIPIENT COMPATIBILITY STUDY (FTIR)
A proper design and formulation of a dosage form requires considerations of the physical, chemical and biological characteristics of both drug and excipients used in fabrication of the product. Compatibility must be established
between the active ingre-dient and other excipients to produce a stable,
efficacious, attractive and safe product. If the excipient(s) are new and if no previous literature regarding the use of that particular excipient with an active ingredient is available, then compatibility studies are of paramount importance. Hence, before producing the actual formulation, compa-tibility of Capcetabine with different polymers and other excipients was tested using the Fourier Transform Infrared Spectroscopy (FT-IR) technique.
ESTIMATION OF CAPECTABINE
STANDARD GRAPH OF CAPECITABINE CONSTRUCTION OF STANDARD GRAPH OF CAPECITABINE (0.1 N HCL)
PREPARATION OF STOCK SOLUTION Accurately weighed amount of 100 mg was transferred into a 100ml volumetric flask. Few ml of water was added to dissolve the drug and volume was made up to 100 ml with 0.1 N HCl. The resulted solution had the concentration of 1mg/ml which was labeled as „stock‟.
PREPARATION OF WORKING STANDARD SOLUTION
From this stock solution 10ml was taken and diluted to 100 ml with 0.1 N HCl which has given the solution having the concentration of 100mcg/ml.
PREPARATION OF SERIAL DILUTIONS FOR STANDARD CALIBRATION CURVE
Necessary dilutions were made by using the standard solution to give the different concentrations of Capecitabine (0-60mcg/ml) solutions. The absorbances of above solutions were recorded at max (303nm) of the drug using double beam UV-Visible spectrophotometer. Standard graph was plotted between the concentration (on X-axis) and absorbance (on Y-axis).
CONSTRUCTION OF STANDARD GRAPH OF CAPECITABINE (PH6.8 BUFFER)
PREPARATION OF STOCK SOLUTION Accurately weighed amount of 100 mg was transferred into a 100ml volumetric flask. Few ml of water was added to dissolve the drug and volume was made up to 100 ml with pH6.8 buffer. The resulted solution had the concentration of 1mg/ml which was labeled as „stock‟.
PREPARATION OF WORKING STANDARD SOLUTION
From this stock solution 10ml was taken and diluted to 100 ml with pH6.8 buffer which has given the solution having the concentration of 100mcg/ml.
PREPARATION OF SERIAL DILUTIONS FOR STANDARD CALIBRATION CURVE
absorbances of above solutions were recorded at max (303nm) of the drug using double beam UV-Visible spectrophotometer. Standard graph was plotted between the concentration (on X-axis) and absorbance (on Y-axis).
METHOD OF PREPARATION
IONOTROPIC GELATION METHOD
Batches of microspheres were prepared by ionotropic gelation method which involved reaction between sodium alginate and polycationic ions like calcium to produce a hydrogel network of calcium alginate. Sodium alginate and the mucoadhesive polymer were dispersed in purified water (50 ml) to form a homogeneous polymer mixture. The API, Capcetabine were added to the polymer premix and mixed thoroughly with a stirrer to form a viscous dispersion. The resulting dispersion was then added through a 22G needle into calcium chloride (2% w/v) aqueous solution. The addition was done with continuous stirring at 200rpm. The added droplets were retained in the calcium chloride solution for 30 minutes to complete the curing reaction and to produce rigid spherical microspheres. The microspheres were collected by decantation, and the product thus separated was washed repeatedly with purified water to remove excess calcium impurity deposited on the surface of microspheres and then air-dried.
EVALUATION OF MICROSPHERES
PERCENTAGE YIELD
The percentage of production yield was calculated from the weight of dried microspheres recovered from each batch and the sum of the initial weight of starting materials. The percentage yield was calculated using the following formula:
Yield = Practical mass (Microspheres) / Theoretical mass (Polymer + Drug x100)
DRUG ENTRAPMENT EFFICIENCY
Microspheres equivalent to 200mg of the drug Capcetabine were taken for evaluation. The amount of drug entrapped was estimated by crushing the microspheres. The powder was transferred to a 100 ml volumetric flask and dissolved in 10ml of methanol and the volume was made up using 0.1N
HCl. After 24 hours the solution was filtered through Whatmann filter paper and the absorbance was measured after suitable dilution spectrophotometrically at 212 nm. The amount of drug entrapped in themicrospheres was calculated by the following formula,
% Drug Entrapment Efficiency = Experimental Drug Content / Theoretical Drug Content × 100
PARTICLE SIZE ANALYSIS
Samples of the microparticles were analyzed for particle size by optical microscope. The instrument was calibrated and found that 1unit of eyepiece micrometer was equal to 12.5μm. Nearly about 100 Microparticles sizes were calculated under 45 x magnifications.
The average particle size was determined by using the Edmondson‟s equation:
Dmean = nd / n Where,
n – Number of microspheres observed d – Mean size range
SWELLING STUDY
Swelling ratio of different dried microspheres were determined gravimetrically in 0.1N HCl at 4th hr.The microspheres were removed periodically from the solution, blotted to remove excess surface liquid and weighed on balance. Swelling ratio (% w/v) was determined from the following relationship:
Swelling ratio = (Wt – W0) / (W0) × 100
Where W0 & Wt are initial weight and Final weight of microspheres respectively
EVALUATION OF MUCOADHESIVE
PROPERTY
The mucoadhesive property of microspheres was evaluated by an in vitro adhesion testing method known as wash-off method. Freshly excised pieces of goat stomach mucous were mounted on to glass slides with cotton thread. About 20 microspheres were spread on to each prepared glass slide and immediately thereafter the slides were hung to USP II tablet disintegration test, when the test apparatus was operated, the sample is subjected to slow up and
stopped and number of microspheres still adhering to mucosal surface was counted.
% Mucoadhesion= Number of microspheres adhered / Number of microspheres applied ×100
IN VITRO DRUG RELEASE STUDY
The dissolution studies were performed in a fully calibrated eight station dissolution test apparatus (37 ± 0.50C, 100 rpm) using the USP type – I rotating basket method in 0.1N HCl (900ml). A quantity of accurately weighed microspheres equivalent to 200 mg Capcetabine each formulation was employed in all dissolution studies. Aliquots of sample were withdrawn at predetermined intervals of time and analyzed for drug release by measuring the absorbance at 212nm. At the same time the volume withdrawn at each time intervals were replenished immediately with the same volume of fresh
pre-warmed 0.1N HCl maintaining sink conditions throughout the experiment.
IN-VITRO DRUG RELEASE KINETICS
The release data obtained was fitted into various mathematical models. The parameters „n‟ and time component „k‟, the release rate constant and „R‟,the regression coefficient were determined by Korsmeyer-Peppas equation to understand the release mechanism. To examine the release mechanism of Capcetabine from the microspheres, the release data was fitted into Peppa‟s equation,
Mt / M∞ = Ktn
Where, Mt / M∞ is the fractional release of drug, „t‟ denotes the release time, „K‟ repr-esents a constant incorporating structural and geometrical characteristics of the device, „n‟ is the diffusional exponent and characterize the type of release mechanism during the release process.
Table no 1: In-Vitro Drug release kinetics
If n < 0.5, the polymer relaxation does not affect the molecular transport, hence diffus-ion is Fickian. If n > 0.5, the solid transport will be non-fickian and will be relaxation controlled.
OTHER EQUATIONS TO STUDY THE
DRUG RELEASE KINETICS FROM
DOSAGE FORMS
ZERO ORDER % R = kt
This model represents an ideal release in order to achieve prolonged pharmacologiclaction. This is applicable to dosage forms like transdermal systems, coated forms, osmotic systems, as well as Matrix tablets containing low soluble drugs.
FIRST ORDER
log (fraction unreleased) = kt/2.303
The model is applicable to hydrolysis kinetics and to study the release profiles of pharmaceutical dosage
forms such as
those containing water soluble drugs in porous matrices.
MATRIX (HIGUCHI MATRIX) % R = kt 0.5
This model is applicable to systems with drug dispersed in uniform swellable polymer matrix as in case of matrix tablets with water soluble drug.
PEPPAS KORSMEYER EQUATION % R = kt n
log % R = logk + nlogt
This model is widely used when release mechanism is well known or when more than one type of release phenomenon could be involved.
STABILITY STUDIES
Release exponent (n) Drug transport mechanism Rate as a function of time
0.5 Fickian diffusion t-0.5
0.5<n<1.0 Anomalous transport or non-Fickian tn-1
1.0 Case-II transport Zero-order release
Stability studies were carried out according to ICH guidelines by exposing the Formulations in their final packing mode to the temperature 40±2°C and relative humidity 75±5 % in programmable environmental test chamber (CHM-10S, Remi Instruments Ltd., Mumbai, India). Aliquot were withdrawn at 30 and 60 days and analyzed for change in drug content and IN-VITRO dissolution profile. Selected Formulation was subjected to stability studies as per ICH guidelines. Following conditions were used for Stability Testing:
[1]. 21˚C/45% RH analyzed every month for
period of three months.
[2]. 25˚C/60% RH analyzed every month for period of three months.
[3]. 30˚C/70% RH analyzed every month for period of three months.
RESULTS AND DISCUSSION
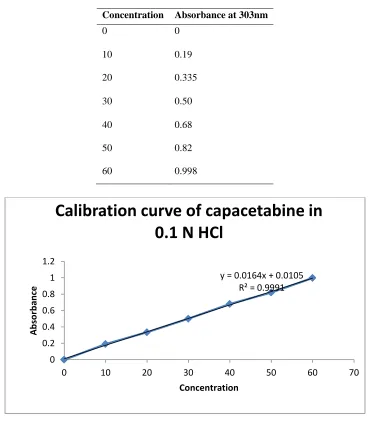
STANDARD GRAPH OF CAPECITABINE (0.1 N HCL)
The standard graph of capecitabine has shown good linearity with R2 values 0.9991 in 0.1 N Hcl and which suggests that it obeys the “Beer-Lambert‟s law”.
Table No 2:- Standard values of capecitabine in 0.1N Hcl
Concentration Absorbance at 303nm
0 0
10 0.19
20 0.335
30 0.50
40 0.68
50 0.82
60 0.998
Fig No 1:- Calibration curve for Capecitabine in 0.1N HCl at 303nm y = 0.0164x + 0.0105
R² = 0.9991
0 0.2 0.4 0.6 0.8 1 1.2
0 10 20 30 40 50 60 70
A
b
sor
b
an
ce
Concentration
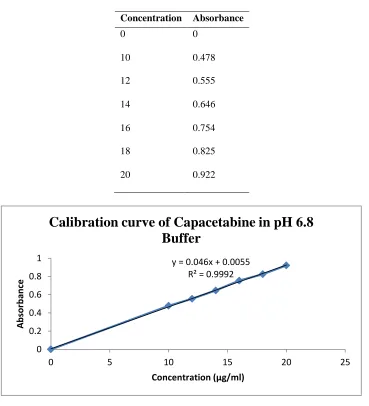
STANDARD GRAPH OF CAPECITABINE IN 6.8PH PHOSPHATE BUFFER
The standard graph of Capecitabine has shown good linearity with R2 values 0.9992 and which suggests that it obeys the “Beer-Lambert‟s law”.
Table No 3:- Standard values of capecitabine in 6.8pH phosphate buffer
Concentration Absorbance
0 0
10 0.478
12 0.555
14 0.646
16 0.754
18 0.825
20 0.922
Fig No 2:- calibration curve for capecitabine in 6.8pH phosphate buffer at 304nm y = 0.046x + 0.0055
R² = 0.9992
0 0.2 0.4 0.6 0.8 1
0 5 10 15 20 25
A
b
sor
b
an
ce
Concentration (µg/ml)
COMPATIBILITY STUDIES
Fig No 3:- FTIR spectra of Capecitabine pure drug
Fig No 4:- FTIR Spectra of optimized formulation
EVALUATION AND
CHARACTERISATION MICROSPHERES PERCENTAGE YIELD
It was observed that as the polymer ratio in the formulation increases, the product yield also increases. The low percentage yield in some
alginate along with carbopol 940 and HPMC as copolymers, around 90.1% for microspheres containing sodium alginate along with Xanthum gum as copolymer and 95.1% for microspheres containing sodium alginate along with Guar gum as copolymer.
DRUG ENTRAPMENT EFFICIENCY
The drug entrapment efficiency of the prepared microspheres increased progressively with an increase in proportion of the respective polymers.
Increase in the polymer concentration increases the viscosity of the dispersed phase. The particle size increases exponentially with viscosity. The higher viscosity of the polymer solution at the highest polymer concentration would be expected to decrease the diffusion of the drug into the external phase which would result in higher entrapment efficiency. The % drug entrapment efficiency of the prepared microspheres is displayed in Table 7, and displayed in Figure 10.
Table no 4:-Percentage yield and percentage drug entrapment efficiency of the prepared Microspheres
DISCUSSION
Formulation F3 containing blend of carbapol and HPMC K100maximum percentage of drug loading about 91.8%.Formulation F1 contianing carbapol
percentage of drug loading about 70% because these microspheres are small in size which results more loss of drug from surface during washing of microspheres.
Figure No 5:- Graphical representation of percentage yield of formulations F1-F10 82
84 86 88 90 92 94 96 98
F1 F2 F3 F4 F5 F6 F7 F8 F9 F10
%
YIE
LD
FORMULATION CODE
S.No. Formulation code % yield %Drug entrapment efficiency % Muco adhesion
1 F1 93.8 70.1 68.6
2 F2 87.6 83.4 88.1
3 F3 94.8 91.8 90.6
4 F4 95.0 90.4 92.4
5 F5 90.1 71.7 80.5
6 F6 95.1 64.3 74.8
7 F7 96.9 73.6 83.5
8 F8 95.1 91.8 90.2
9 F9 94.2 90.6 93.6
Figure No 6: Graphical representation of percentage drug entrapment efficiency of formulations F1-F10
SCANNING ELECTRON MICROSCOPY The SEM photography revealed that the drug loaded microsphere are spherical .Microspheres prepared containing higher amount of polymer exhibited smoother surface than those prepared with a low amount of polymer Irregular surfaces and large sizes
of microspheres were observed for those prepared with the lower amount of polymer >This has greatly affected the Morphological Characteristics of the microspheres. As the drug –to-polymer ratio was increased, more spherical microspheres with smooth surfaces were obtained.
Figure No 7:- SEM of Capecitabine 0
10 20 30 40 50 60 70 80 90 100
F1 F2 F3 F4 F5 F6 F7 F8 F9 F10
D
R
UG
EN
TRAP
M
EN
T
EFFI
CIE
N
CY
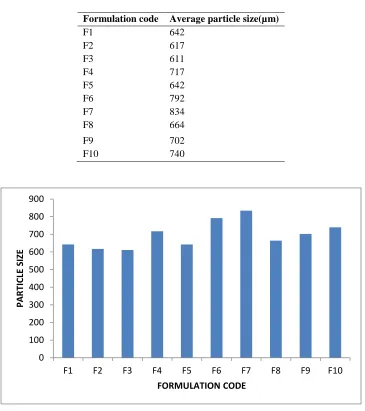
PARTICLE SIZE ANALYSIS
The mean particle size and size distribution of the mucoadhesive microspheres of capecitabine with different drug/polymer ratio were studied and found to be in the range of 642µm - 740µm. The mean size increased with increasing polymer concentration
which is due to a significant increase in the viscosity, thus leading to an increased droplet size and finally a higher microspheres size. The particle size as well as % drug entrapment efficiency of the microspheres increased with increase in the polymer concentration.
Table No 5:- Average Particle Size analysis for formulation F1-F10
Formulation code Average particle size(µm)
F1 642
F2 617
F3 611
F4 717
F5 642
F6 792
F7 834
F8 664
F9 702
F10 740
Figure No 8:- Graphical representation of average particle size for formulations F1-F10
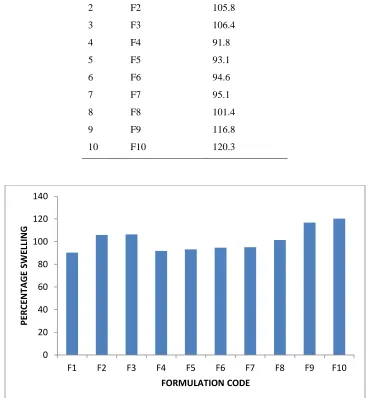
SWELLING STUDY
The swelling ratio is expressed as the percentage of water in the hydrogel at any instant during swelling. Swell ability is an important characteristic as it affects mucoadhesion as well as drug release profiles of polymeric drug delivery systems. Swell ability is an indicative parameter for rapid availability
of drug solution for diffusion with greater flux. Swell ability data revealed that amount of polymer plays an important role in solvent transfer. It can be concluded from the data shown in Table that with an increase in polymer concentration, the percentage of swelling also increases. Thus we can say that amount of polymer directly affects the swelling ratio..The 0
100 200 300 400 500 600 700 800 900
F1 F2 F3 F4 F5 F6 F7 F8 F9 F10
PA
R
TICL
E
SIZE
percentage swelling of the prepared microspheres is displayed in Fig.11. The effect of drug to polymer
ratio on percentage swelling is displayed in Figure 11.
Table no 6:- Percentage Swelling of the Prepared Microspheres
S.NO. FORMULATION CODE
PERCENTAGE SWELLING
1 F1 90.3
2 F2 105.8
3 F3 106.4
4 F4 91.8
5 F5 93.1
6 F6 94.6
7 F7 95.1
8 F8 101.4
9 F9 116.8
10 F10 120.3
Figure No 9:- Graphical representation of Percentage swelling index of formulations F1-F10
IN-VITRO DRUG RELEASE STUDIES
The invitro release studies of all the extended release Tablets formulated (F1-F10) were performed using USP II dissolution apparatus at 37.5±0.5 in 0.1N HCL and samples were withdrawn and analyzed by using UV spectrophotometry at 304nm. The results were shown in Table No 11 to 12 and figs 12 to 13.
0 20 40 60 80 100 120 140
F1 F2 F3 F4 F5 F6 F7 F8 F9 F10
PE
R
CE
N
TA
GE
S
WE
LLI
N
G
RELEASE STUDIES OF CAPECITABINE
MUCOADHESIVE MICROSPHERES
FORMULATIONS F1-F10
The release profile of formulations F1-F10 comprising various polymers like Carbopol, HPMC K 100,Xanthum gum, sodium alginate with different l concentrations were shown in Table 10, 11 and fig 15,16. Formulations F1, F2, F3 and F4 exhibits
release rates of 88.7%, 85.4%, 91.0% , 90.0%,86.0% ,69.1%,87.6%,88.0%,85.1%,72.6%. The results of the in-vitro dissolution studies of formulations F1 to F10 and shown in Table no.11-12.The plots of Cumulative percentage drug release Vs Time. Figure 15-16 shows the comparison of % CDR for formulations F1 to F10.
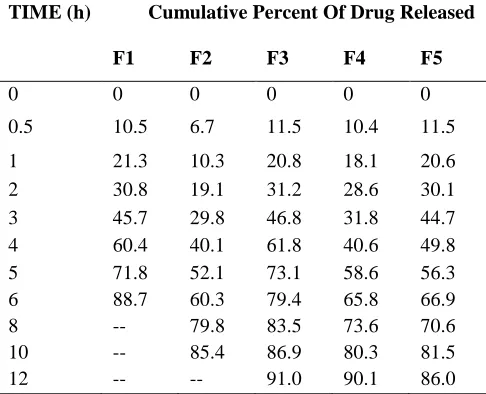
Table No 7:- In-Vitro drug release data of Capecitabine microspheres
TIME (h) Cumulative Percent Of Drug Released
F1 F2 F3 F4 F5
0 0 0 0 0 0
0.5 10.5 6.7 11.5 10.4 11.5
1 21.3 10.3 20.8 18.1 20.6
2 30.8 19.1 31.2 28.6 30.1 3 45.7 29.8 46.8 31.8 44.7 4 60.4 40.1 61.8 40.6 49.8 5 71.8 52.1 73.1 58.6 56.3 6 88.7 60.3 79.4 65.8 66.9 8 -- 79.8 83.5 73.6 70.6 10 -- 85.4 86.9 80.3 81.5
12 -- -- 91.0 90.1 86.0
DISCUSSION
Among all the formulations F3 Containing carbopol, HPMC and sodium alginae showed maximum release at 12hrs.This shows that more sustained release was observed with the increase in percentage of polymers.As the polymer to drug ratio was increased the extent of drug release decreased.A significant decrease in the rate and extent of drug
Figure No 10:- Comparision of In-Vitro drug release profile of Capecitabine microspheres (F1 – F5)
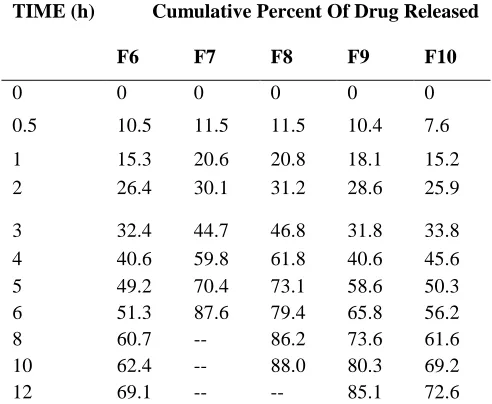
Table No 8:- In-Vitro drug release data of Capecitabine microspheres
TIME (h) Cumulative Percent Of Drug Released
F6 F7 F8 F9 F10
0 0 0 0 0 0
0.5 10.5 11.5 11.5 10.4 7.6
1 15.3 20.6 20.8 18.1 15.2
2 26.4 30.1 31.2 28.6 25.9
3 32.4 44.7 46.8 31.8 33.8 4 40.6 59.8 61.8 40.6 45.6 5 49.2 70.4 73.1 58.6 50.3 6 51.3 87.6 79.4 65.8 56.2 8 60.7 -- 86.2 73.6 61.6 10 62.4 -- 88.0 80.3 69.2
12 69.1 -- -- 85.1 72.6
0 10 20 30 40 50 60 70 80 90 100
0 2 4 6 8 10 12 14
CUM
UL
A
TIV
E
%
D
R
UG
R
ELE
A
SE
TIME IN HRS
F1
F2
F3
F4
Figure No 11:- Comparision of In-Vitro drug release profile of Capecitabine microspheres (F6-F10)
IN-VITRO DRUG RELEASE KINETICS
The invitro dissolution data for best formulation F3 were fitted in different kinetic models i.e, zero order, first order, Higuchi and korsmeyer-peppas equation. Optimized formulation F3 shows R2 value 0.902. In optimised formulation,the higher values of the linear regression curves in the zero order plot than first order plot showed that the drug release followed zero order kinetics.The mechanism of drug release is further confirmed by the korsmeyer and peppas plot, if n = 0.45 it is called Case I or Fickian
diffusion, 0.45 < n < 0.89 is for anomalous behavior or non – Fickian transport, n = 0.89 for case II transport and n > 0.89 for Super case II transport. The release exponent value n=0.536 indicates that dominant mechanism of drug release from the matrix of optimised formulation was swelling and erosion which is always associated with diffusion mechanism.It can be anomalous transportation i.e., non fickian kinetics.The release kinetics for the optimised formula were shown in Table.
Table No 9:- Release Kinetics Studies Of the Prepared Formulations
ZERO FIRST HIGUCHI PEPPAS
% CDR Vs T Log % Remain Vs T %CDR Vs √T Log C Vs Log T
Slope 8.274488491 -0.14046354 31.43943102 1.37238628 Intercept 9.643606138 2.20149929 -12.2709975 0.703967511 Correlation 0.950160504 -0.92487055 0.966554763 0.876716503 R 2 0.902804983 0.855385541 0.93422811 0.768631826
0 10 20 30 40 50 60 70 80 90 100
0 2 4 6 8 10 12 14
CUM
UL
A
TIV
E
%
D
R
UG
R
ELE
A
SE
TIME IN HRS
F6
F7
F8
F9
Figure No 12:- Zero order kinetics graph
Figure No 13:- First order kinetics graph y = 8.2745x + 9.6436
R² = 0.9028
0 20 40 60 80 100 120
0 2 4 6 8 10 12 14
%
C
D
R
TIME IN HRS
ZERO ORDER
y = -0.1405x + 2.2015 R² = 0.8554
0 0.5 1 1.5 2 2.5
0 2 4 6 8 10 12 14
LOG
%
D
R
UG
R
EM
A
INE
D
TIME
Figure No 14:- Peppas plot
Figure No 15:- Higuchi plot
STABILITY STUDIES
y = 1.3724x + 0.704 R² = 0.7686
0 0.5 1 1.5 2 2.5
0 0.2 0.4 0.6 0.8 1 1.2
L O G
%
C
D
R
LOG TIME
PEPPAS
y = 31.439x - 12.271 R² = 0.9342
-20 0 20 40 60 80 100 120
0 1 2 3 4
%
C
D
R
SQUARE ROOT OF TIME
HIGUCHI PLOT
Time Assay Cumulative % drug release at 12 hrs
25±20c and 65±5%RH 40±20c and 75±5%RH 25±20c and 65±5%RH 40±20c and 75±5%RH
First day 100 97 90.3 90.5
30days 101.88 99.18 89.8 89.1
SUMMARY AND CONCLUSION
In the present work, microspheres of Capecitabine using Sodium alginate along with Carbopol 934, HPMC as copolymers were formulated to deliver Capecitabine via oral route. Details regarding the preparation and evaluation of the formulations have been discussed in the previous chapter. From the study following conclusions could be drawn:-
The results of this investigation indicate that ionic cross linking technique Ionotropic gelation method can be successfully employed to fabricate Capecitabine microspheres. The technique provides characteristic advantage over conventional microsphere method, which involves an “all-aqueous” system, avoids residual solvents in microspheres. Other methods utilize larger volume of organic solvents, which are costly and hazardous because of the possible explosion, air pollution, toxicity and difficult to remove traces of organic solvent completely.
FT-IR spectra of the physical mixture revealed that the drug is compatible with the polymers and copolymers used.
Micromeritic studies revealed that the mean particle size of the prepared optimized microspheres was in the size range of 611µm and are suitable for microspheres for oral administration.
Increase in the polymer concentration lead to increase in % Drug entrapment efficiency, Particle size, % swelling.
The invitro drug release decreased with increase in the polymer and copolymer concentration. Analysis of drug release mechanism showed that the drug release from the formulations followed first order kinetics with higuchis model of drug release.
Based on the results of evaluation tests formulati on coded F3 was concluded as best formulation.
BIBLIOGRAPHY
[1]. Ahmad Al –Maaieh, douglas R Flanagan. (2005). New drug salt formation of biodegradable microspheres,
International journal of pharmaceutics 303,153-159.
[2]. Akihiro Matsumoto, et al., (2008) A novel preparation method for PLGA microspheres using microspheres using non- halogenated solvents Journal of controlled release 129, 223-227.
[3]. Akiyama, Y.; Nagahara. (1999) N.Novel formulation approaches to oral mucoadhesive drug delivery systems, in: Mathiowitz, E. Chickering III, D.E.Lehr, C.-M. (Eds.), Bioadhesive Drug Delivery Systems, Marcel Dekker, New York, 177-83.
[4]. Andhimathi M. G. and T. K. Ravi. (2003) “Determination of Repaglinide in pharmaceutical formulation by HPLC with UV spectroscopy” Analytical Sci., (19), 1675-1676.
[5]. Ankita Raizada. (2010) Polymers In Drug Deliverey : A Review Ijprd/Pub/Arti/Vov-2/Issue-8/Oct/002 Issn 0974 – 9446.
[6]. Arpita Bhattacharya, Parna Maitra and Mukherjee A., (2003). "Alginate-based Nanocapsular Antineoplastic Drug Delivery System by Pneumatic Nebulization". Indian J. Pharm. Sci., 65(5), 477-481.
[7]. Arul B. and R. Kothai. (2003). “Formulation and evaluation of chitosan microspheres containing isoniazid”,
Ind. J. Pharm. Sci., 66 (5), 640.
[8]. Banker G.S. and Anderson N.R. (1991). "Kinetic Principles and Stability Testing", in the Theory and Practice of Industrial Pharmacy', by Lachman, et al., 3rd edition, 760-769.
[9]. Bhalla H. l. and Kusha A. V. (1988). “Controlled release indomethacin”. Indian Drugs, 26(4),154-157 by Ionotropic Gelation". Ind. J. Pharm. Sci., 57(2), 56-60.
[10].Canefe. (2008). “Indomethacin-Loaded Micro spheres: Preparation Characterization And In-vitro Evaluation regarding ethylcellulose matrix material” Turkey Turk Journal of. Pharmaceutical Science. 5(3), 129-142. [11].Chavanpatil, M. Jain, P.Chaudhari, S. (2006). Novel sustained release, swellable and bioadhesive
gastroretentive drug delivery system for Oflaxacin. Int. J. Pharm., 316, 86-92.