R E S E A R C H
Open Access
Test-retest reliability and construct validity of the
ENERGY-child questionnaire on energy
balance-related behaviours and their potential
determinants: the ENERGY-project
Amika S Singh
1*, Froydis N Vik
2, Mai JM Chinapaw
1, Léonie Uijtdewilligen
1, Maïté Verloigne
3,
Juan M Fernández-Alvira
4, Sarolta Stomfai
5, Yannis Manios
6, Marloes Martens
7and Johannes Brug
8Abstract
Background:Insight in children’s energy balance-related behaviours (EBRBs) and their determinants is important to inform obesity prevention research. Therefore, reliable and valid tools to measure these variables in large-scale population research are needed.
Objective:To examine the test-retest reliability and construct validity of the child questionnaire used in the ENERGY-project, measuring EBRBs and their potential determinants among 10-12 year old children.
Methods:We collected data among 10-12 year old children (n = 730 in the test-retest reliability study; n = 96 in the construct validity study) in six European countries, i.e. Belgium, Greece, Hungary, the Netherlands, Norway, and Spain. Test-retest reliability was assessed using the intra-class correlation coefficient (ICC) and percentage
agreement comparing scores from two measurements, administered one week apart. To assess construct validity, the agreement between questionnaire responses and a subsequent face-to-face interview was assessed using ICC and percentage agreement.
Results:Of the 150 questionnaire items, 115 (77%) showed good to excellent test-retest reliability as indicated by ICCs > .60 or percentage agreement≥75%. Test-retest reliability was moderate for 34 items (23%) and poor for one item. Construct validity appeared to be good to excellent for 70 (47%) of the 150 items, as indicated by ICCs > .60 or percentage agreement≥75%. From the other 80 items, construct validity was moderate for 39 (26%) and poor for 41 items (27%).
Conclusions:Our results demonstrate that the ENERGY-child questionnaire, assessing EBRBs of the child as well as personal, family, and school-environmental determinants related to these EBRBs, has good test-retest reliability and moderate to good construct validity for the large majority of items.
Keywords:child questionnaire, self-report, psychometric, physical activity, sedentary behaviour, soft drinks, fruit juice, active transport, breakfast
Background
Energy balance-related behaviours (EBRBs), i.e. lack of physical activity, excess sedentary behaviour and unhealthy dietary patterns are considered to be impor-tant contributors to the obesity epidemic [1]. In order
to adequately inform prevention and intervention research on lifestyle behaviours, the assessment of EBRBs and their personal and environmental correlates and potential determinants is of utmost importance.
Large-scale observational and intervention studies most often have to rely on questionnaires to assess life-style behaviours and their potential determinants: ques-tionnaire assessments are inexpensive, easy to administer and are widely accepted by study participants * Correspondence: [email protected]
1
VU University Medical Center, EMGO Institute for Health and Care Research, Dpt. of Public and Occupational Health, Amsterdam, the Netherlands Full list of author information is available at the end of the article
Singhet al.International Journal of Behavioral Nutrition and Physical Activity2011,8:136 http://www.ijbnpa.org/content/8/1/136
[2,3]. However, questionnaire assessments rely on self-report that may be prone to recall and social desirability bias [4].
In a recent review Lubans et al. [5] concluded that self-report measures can provide reliable estimates of screen time in children and adolescents. However, the validity of these questionnaires remains largely untested. A review of physical activity questionnaires in young people by Chinapawet al. [6] concluded that there was no physical activity questionnaire with both acceptable validity as well as reliability. Thus, more high-quality research is required into the measurement properties of measurement instruments of sedentary behaviour and physical activity in young people [6].
No gold standard exists for the assessment of dietary intake in large research populations. The commonly used methods in larger populations include food records, food frequency questionnaires, or 24-hour recalls all relying on self-report. All of these suffer from bias due to over- or underreporting and little is known to what extent factors like for example age, cognition, social background and complexity of questions influence the outcomes of the dietary assessment in children [7,8]. Even less research has been conducted on the psycho-metric characteristics of measures of determinants of EBRBs [9]. Moreover, most questionnaires regarding energy-balance behaviours and potential behavioural determinants have been developed for administration in specific countries, while, especially in Europe, cross country studies and comparisons are now common and
supported by the European Commission’s framework
programs.
It can be concluded that reliable and valid question-naires in the area of potential drivers of childhood over-weight and obesity are scarce, especially those covering a range of energy balance-related behaviours that can be used in large-scale studies across countries.
The ENERGY-project is a European Commission funded cross-European project to gain more insight in EBRBs and their potential behavioural determinants, and to inform and test a school-based and family-involved obesity prevention intervention scheme [10]. As part of the ENERGY-project a cross-sectional survey among more than 7000 children, their parents, and schools was conducted in seven countries representing different regions of Europe. This survey used questionnaires among children, parents, and school staff, as well as observations in the school and school environments [11].
However, for the survey no established valid and reli-able measures that could be administered in large popu-lations in different countries across Europe were available. Therefore, we developed a child and parent questionnaire to assess a range of EBRBs and potential
individual and environmental behavioural determinants, and examined the test-retest reliability and construct validity of these two main questionnaires used in the ENERGY cross-sectional survey. The results of the par-ent questionnaire reliability and validity study are pub-lished in a separate paper [Singh et al: Test-retest reliability and construct validity of the ENERGY-parent questionnaire on parenting practices, energy balance-related behaviours and their potential behavioural deter-minants: the ENERGY-project. submitted for publica-tion]. In the current paper, the methods and results of the child questionnaire test-retest reliability and con-struct validity study are presented and discussed.
Methods
Energy-child questionnaire
The ENERGY-child questionnaire was developed in order to assess EBRBs of the child as well as personal, and family and school-environmental determinants related to these EBRBs. The questionnaire was divided in eight sections, i.e. (A) Demographic characteristics; (B) Soft drinks and spending pocket money on soft drinks; (C) Fruit juices; (D) Breakfast behaviour; (E) Phy-sical activity behaviour; (F) Screen viewing behaviour; and (G) Dieting behaviour. In the current study we assessed the test-retest reliability and construct validity
of all sections (150 items), except ‘demographic
characteristics’.
Most concepts were measured by only one or two items due to practical constraints with regard to the length of the questionnaire. The questionnaire was developed from existing measures or such existing mea-sures were adapted for the behaviours included in the ENERGY-child questionnaire [12-14]. More details on the development of the questionnaire, the pre-testing, and translation procedures are described elsewhere [11]. The ENERGY-child questionnaire is available via the ENERGY-website in English and all languages in which the questionnaire was administered: http://www.projec-tenergy.eu.
Study population: recruitment and data collection In the current paper, the data of the test-retest reliability and construct validity study from six out of seven coun-tries that participated in the cross-sectional study of the ENERGY-project [10] (i.e. Belgium, Greece, Hungary, the Netherlands, Norway, and Spain) are presented. Due to deviations from the study protocol Slovenian data were excluded from the current study. Data collection, data cleaning, and data analyses were performed accord-ing to a standardized protocol and are described hereafter.
March-July 2010. Children were recruited in five phases: (1) we called schools and after a short explanation of the study we asked if the school was interested in participation in the study. (2) If the school showed interest, a letter with more information on the background, goals, and meth-ods of the study was sent. (3) A second phone call fol-lowed after one week. During this phone call, the dates on which the measurements would take place, were agreed upon. Schools were asked to select one class of children aged 10-12 years to participate in the study. (4) A second letter or email was sent to the school to con-firm the dates. The letter also contained practical infor-mation on the measurements. (5) We provided schools with an information letter, which was sent to the par-ents of the children of the selected class. This letter contained an active/passive informed consent and detailed information on the background, goals, and methods of the study.
In countries where ethical approval was necessary for such non-intervention studies this was obtained from the relevant ethical committee and informed consent of the child and/or parents was obtained prior to the study; in the other countries a declaration of‘No objec-tion’ was obtained from the ethical committees. In Greece, both the Ministry of Education and the ethical committee approved the study protocol.
Test-retest reliability study
We visited the school and children were asked to fill in the ENERGY-child questionnaire in the classroom under the supervision of the researcher/research assis-tant. Exactly one week later, the researcher/research assistant returned and the children were asked to fill in the questionnaire for a second time. We planned the second measurement at the same part of the day as the first measurement (e.g. morning or afternoon). We col-lected data by ID number to be able to merge the ques-tionnaires from the test and re-test.
Construct validity study
For the construct validity study a cognitive interview was conducted among approximately three children of each participating class. Before the study started, we asked the teacher to select three children representative for the class. These children were asked to volunteer for a cognitive interview with the researcher/research assis-tant about the same subjects as the questionnaire.
Children who participated in the construct validity study were asked to fill in the ENERGY-child question-naire together with the other children in the class (first measurement of the test-retest reliability study) and were subsequently interviewed by a researcher/research assistant. The interview was performed using a standard question route - considering the course of the child’s day from getting up until going to sleep. The interviews were sound-recorded and transcribed. Based on the
transcribed interview, a second researcher/research assistant (i.e. other than the one doing the interview) filled in a second identical child questionnaire without knowledge of the answers to the first questionnaire of the children. Data of children that participated in the construct validity study were excluded from the test-ret-est reliability study.
Data management
A standard data management protocol was developed to ensure missing and ambiguous values were handled consistently.
Double data entry
For both the test-retest reliability study and the validity study a randomly selected 5% of the questionnaires were re-entered in SPSS (double data entry) to check for typ-ing errors and misinterpretation. A difference of less than 3% was accepted. In case there was a difference of more than 3%, the cases had to be re-entered in the ori-ginal data set and the procedure was repeated. Across the countries, the rate of disagreement in the test-retest reliability and construct validity studies ranged from 0.0% - 1.7% and 0.0% - 2.3%, respectively.
Data definition
The data definition process consisted of adding variable labels, value labels and missing value definitions to the original data files.
Data cleaning
During the data cleaning original data was checked for duplicate records, system-missing values, out-of-range values and logical inconsistencies.
Statistical analyses Descriptives
We calculated means and standard deviations for the participant characteristics and medians, 25th, and 75th percentiles values for the EBRBs.
Test-retest reliability and construct validity
For both test-retest reliability and construct validity we assessed agreement at the individual item level. The agreement of categorical items (mostly Likert-type scales), continuous, and dichotomous items was ana-lysed with a two-way random effects single measure intraclass correlation coefficient (ICC 2.1); ICCs were classified as follows:‘excellent’(≥ .81),‘good’(.61 - .80),
‘moderate’(.41 - .60), ‘poor’(≤.40) [3,15-17].
Because the calculation of the ICC depends on the existence of the variability in answering categories, we also calculated percentage agreement, with criteria established as ‘excellent’ (90% - 100%), ‘good’(75% -89%), ‘moderate’ (60%-74%), or ‘poor’(< 60%). If ICC values were lower than .40/.60/.80 but the percentage agreement was higher than 60%/75%/90%, we reported the percentage agreement [18].
Singhet al.International Journal of Behavioral Nutrition and Physical Activity2011,8:136 http://www.ijbnpa.org/content/8/1/136
Gender-specific analyses did not show meaningful dif-ferences between boys and girls, both in the test-retest reliability and the construct validity study. Therefore, results are presented for both boys and girls combined.
All statistical tests were performed using SPSS version 15.0 (SPSS Inc., Chicago, IL).
Results
General
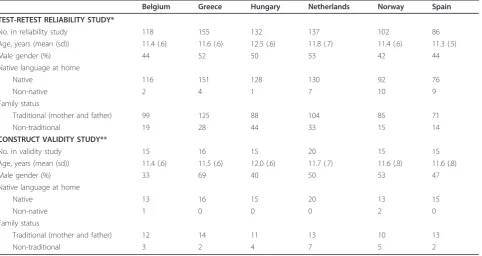
The characteristics of the children that participated in the test-retest reliability and construct validity study are shown in table 1.
Completion of the 157-item questionnaire took about 30-60 minutes. The cognitive interviews took 35-60 minutes.
Test-retest reliability
There were 793 children who filled in the questionnaire for the first time. At the retest, 63 did not fill in the questionnaire and were therefore excluded from the cur-rent analysis (dropout rate: 7.9%).
In this study, we included test-retest reliability data from 730 children across the six countries. The number of participants ranged from 86 (Spain) to 155 (Greece). The mean age (standard deviation (sd)) of the children participating in the test-retest reliability study ranged from 11.3 (.5) years (Spain) to 12.5 (.6) years (Hungary). The majority of the children reported to speak the native language of the country at home.
Construct validity
There were 98 children who filled in the questionnaire. Two children did not show up at the interview and were therefore excluded from the current analysis (drop-out rate: 3.0%).
In this study, we included construct validity data from 96 children across the six countries. All but two coun-tries included 15 children; Greece included 16, and the Netherlands 20 children. The mean age (standard devia-tion (sd)) of the children participating in the test-retest reliability study ranged from 11.4 (.6) years (Belgium) to 12.0 (.6) years (Hungary). In Belgium, the majority of the children participating in the construct validity study were girls (67%), whereas in Greece the majority (69%) of the children were boys. In all countries, most children reported to speak the native language of the country at home.
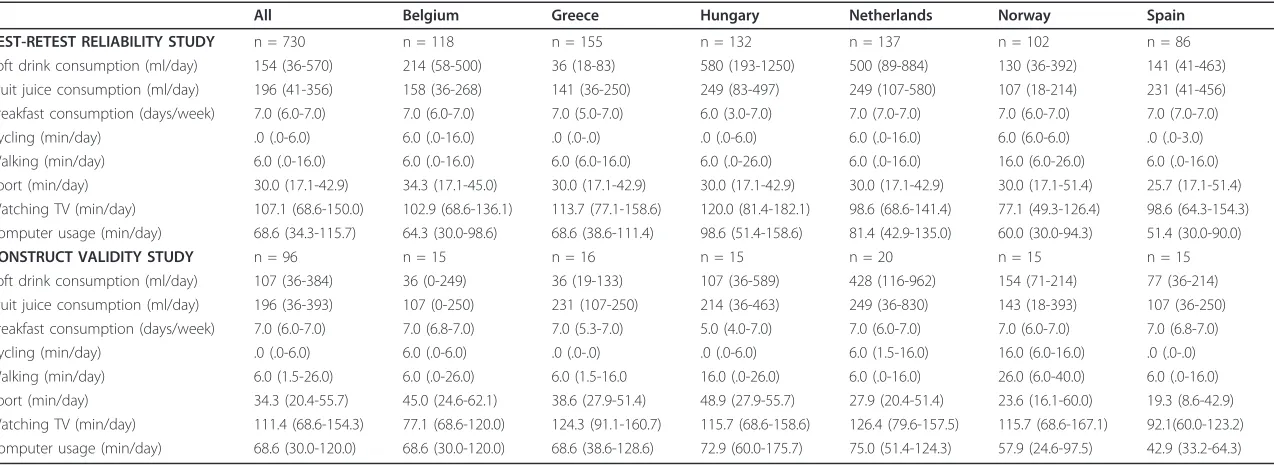
Energy balance-related behaviours (EBRBs)
Table 2 presents the descriptives of the EBRBs, as assessed by the first completion of the questionnaire.
General findings test-retest reliability and construct validity study
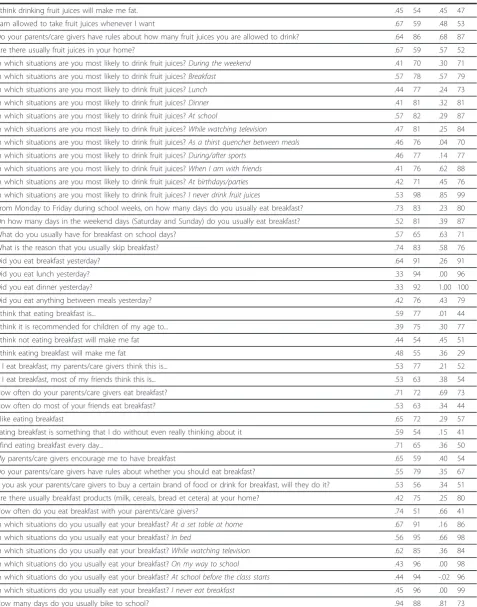
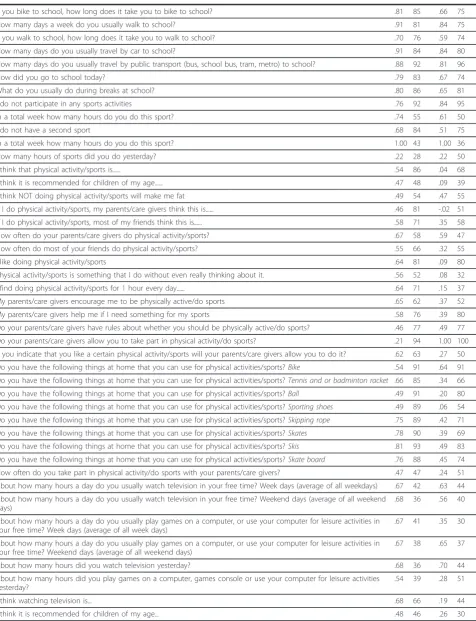
Table 3 shows the questionnaire items, their ICC values, and percentage agreement for all countries combined, for both the test-retest reliability and construct validity study. Table 4 summarises these findings per category of the ENERGY-child questionnaire.
Table 1 Descriptive statistics of the children that participated in the test-retest reliability and construct validity study.
Belgium Greece Hungary Netherlands Norway Spain
TEST-RETEST RELIABILITY STUDY*
No. in reliability study 118 155 132 137 102 86
Age, years (mean (sd)) 11.4 (.6) 11.6 (.6) 12.5 (.6) 11.8 (.7) 11.4 (.6) 11.3 (.5)
Male gender (%) 44 52 50 53 42 44
Native language at home
Native 116 151 128 130 92 76
Non-native 2 4 1 7 10 9
Family status
Traditional (mother and father) 99 125 88 104 85 71
Non-traditional 19 28 44 33 15 14
CONSTRUCT VALIDITY STUDY**
No. in validity study 15 16 15 20 15 15
Age, years (mean (sd)) 11.4 (.6) 11.5 (.6) 12.0 (.6) 11.7 (.7) 11.6 (.8) 11.6 (.8)
Male gender (%) 33 69 40 50 53 47
Native language at home
Native 13 16 15 20 13 15
Non-native 1 0 0 0 2 0
Family status
Traditional (mother and father) 12 14 11 13 10 13
Non-traditional 3 2 4 7 5 2
Table 2 Energy balance-related behaviours of children participating in the test-retest reliability and construct validity study. All values are medians (25th -75thpercentile.)
All Belgium Greece Hungary Netherlands Norway Spain
TEST-RETEST RELIABILITY STUDY n = 730 n = 118 n = 155 n = 132 n = 137 n = 102 n = 86
Soft drink consumption (ml/day) 154 (36-570) 214 (58-500) 36 (18-83) 580 (193-1250) 500 (89-884) 130 (36-392) 141 (41-463) Fruit juice consumption (ml/day) 196 (41-356) 158 (36-268) 141 (36-250) 249 (83-497) 249 (107-580) 107 (18-214) 231 (41-456) Breakfast consumption (days/week) 7.0 (6.0-7.0) 7.0 (6.0-7.0) 7.0 (5.0-7.0) 6.0 (3.0-7.0) 7.0 (7.0-7.0) 7.0 (6.0-7.0) 7.0 (7.0-7.0) Cycling (min/day) .0 (.0-6.0) 6.0 (.0-16.0) .0 (.0-.0) .0 (.0-6.0) 6.0 (.0-16.0) 6.0 (6.0-6.0) .0 (.0-3.0) Walking (min/day) 6.0 (.0-16.0) 6.0 (.0-16.0) 6.0 (6.0-16.0) 6.0 (.0-26.0) 6.0 (.0-16.0) 16.0 (6.0-26.0) 6.0 (.0-16.0) Sport (min/day) 30.0 (17.1-42.9) 34.3 (17.1-45.0) 30.0 (17.1-42.9) 30.0 (17.1-42.9) 30.0 (17.1-42.9) 30.0 (17.1-51.4) 25.7 (17.1-51.4) Watching TV (min/day) 107.1 (68.6-150.0) 102.9 (68.6-136.1) 113.7 (77.1-158.6) 120.0 (81.4-182.1) 98.6 (68.6-141.4) 77.1 (49.3-126.4) 98.6 (64.3-154.3) Computer usage (min/day) 68.6 (34.3-115.7) 64.3 (30.0-98.6) 68.6 (38.6-111.4) 98.6 (51.4-158.6) 81.4 (42.9-135.0) 60.0 (30.0-94.3) 51.4 (30.0-90.0)
CONSTRUCT VALIDITY STUDY n = 96 n = 15 n = 16 n = 15 n = 20 n = 15 n = 15
Soft drink consumption (ml/day) 107 (36-384) 36 (0-249) 36 (19-133) 107 (36-589) 428 (116-962) 154 (71-214) 77 (36-214) Fruit juice consumption (ml/day) 196 (36-393) 107 (0-250) 231 (107-250) 214 (36-463) 249 (36-830) 143 (18-393) 107 (36-250) Breakfast consumption (days/week) 7.0 (6.0-7.0) 7.0 (6.8-7.0) 7.0 (5.3-7.0) 5.0 (4.0-7.0) 7.0 (6.0-7.0) 7.0 (6.0-7.0) 7.0 (6.8-7.0) Cycling (min/day) .0 (.0-6.0) 6.0 (.0-6.0) .0 (.0-.0) .0 (.0-6.0) 6.0 (1.5-16.0) 16.0 (6.0-16.0) .0 (.0-.0) Walking (min/day) 6.0 (1.5-26.0) 6.0 (.0-26.0) 6.0 (1.5-16.0 16.0 (.0-26.0) 6.0 (.0-16.0) 26.0 (6.0-40.0) 6.0 (.0-16.0) Sport (min/day) 34.3 (20.4-55.7) 45.0 (24.6-62.1) 38.6 (27.9-51.4) 48.9 (27.9-55.7) 27.9 (20.4-51.4) 23.6 (16.1-60.0) 19.3 (8.6-42.9) Watching TV (min/day) 111.4 (68.6-154.3) 77.1 (68.6-120.0) 124.3 (91.1-160.7) 115.7 (68.6-158.6) 126.4 (79.6-157.5) 115.7 (68.6-167.1) 92.1(60.0-123.2) Computer usage (min/day) 68.6 (30.0-120.0) 68.6 (30.0-120.0) 68.6 (38.6-128.6) 72.9 (60.0-175.7) 75.0 (51.4-124.3) 57.9 (24.6-97.5) 42.9 (33.2-64.3)
Singh
et
al
.
Internati
onal
Journal
of
Behavioral
Nutrition
and
Physical
Activity
2011,
8
:136
http://ww
w.ijbnpa.org/
content/8/1/1
36
Page
5
of
Table 3 Agreement (per questionnaire item) between questionnaires (test-retest reliability) and questionnaire and interview responses (construct validity) as indicated by intraclass correlation coefficients (ICC) and percentage agreement (agree).
Item reliability validity
ICC agree ICC agree
How many times a week do you usually drink fizzy drinks and fruit squash? .71 55 .59 55 On a day that you drink fizzy drinks and fruit squash, how many glasses, cans or bottles do you drink on such a day?
Glasses or small bottles (250 ml)
.59 55 .24 58
On a day that you drink fizzy drinks and fruit squash, how many glasses, cans or bottles do you drink on such a day?
Cans (330 ml)
.53 73 .44 71
On a day that you drink fizzy drinks and fruit squash, how many glasses, cans or bottles do you drink on such a day?
Bottles (500 ml)
.58 77 -.01 81
How many fizzy drinks or fruit squash did you drink yesterday?Glasses or small bottles (250 ml) .58 88 .48 64 How many fizzy drinks or fruit squash did you drink yesterday?Cans (330 ml) .53 82 .21 86 How many fizzy drinks or fruit squash did you drink yesterday?Bottles (500 ml) .55 84 .10 92
I think that drinking fizzy drinks or fruit squash is... .68 65 .28 38
I think drinking fizzy drinks or fruit squash will make me fat .55 49 .42 45
If I drink fizzy drinks or fruit squash, my parents/care givers think this is... .53 66 .51 51 If I drink fizzy drinks or fruit squash, most of my friends think this is... .63 65 .40 48 How often do your parents/care givers drink fizzy drinks or fruit squash? 1.00 60 1.00 51
How often do most of your friends drink fizzy drinks or fruit squash? .57 62 .42 60
I like the taste of fizzy drinks or fruit squash .67 68 .32 58
Drinking fizzy drinks or fruit squash is something that I do without even really thinking about .59 47 .25 34
I find drinking no fizzy drinks or fruit squash... .59 55 .22 32
If I ask my parents/care givers for a fizzy drink or fruit squash, I get one .62 54 .54 44
I am allowed to take fizzy drinks or fruit squash whenever I want .68 52 .30 43
Do your parents/care givers have rules about how many fizzy drinks or fruit squash you are allowed to drink? .60 80 .49 75 If you ask your parents/care givers to buy a certain brand of fizzy drinks or fruit squash, will she do it? .65 55 .42 33
Are there usually fizzy drinks or fruit squash at your home? .74 61 .52 46
In which situations do you usually drink fizzy drinks or fruit squash?During the weekend .54 80 .31 63 In which situations do you usually drink fizzy drinks or fruit squash?Breakfast .42 94 -.01 98 In which situations do you usually drink fizzy drinks or fruit squash?Lunch .54 83 .32 88 In which situations do you usually drink fizzy drinks or fruit squash?Dinner .59 85 .30 80 In which situations do you usually drink fizzy drinks or fruit squash?At school .64 91 .19 92 In which situations do you usually drink fizzy drinks or fruit squash?While watching television .56 81 .35 81 In which situations do you usually drink fizzy drinks or fruit squash?As a thirst quencher between meals .50 82 .27 86 In which situations do you usually drink fizzy drinks or fruit squash?During/after sports .60 84 .36 80 In which situations do you usually drink fizzy drinks or fruit squash?When I am with friends .48 74 .28 65 In which situations do you usually drink fizzy drinks or fruit squash?At birthdays/parties .45 83 .27 72 In which situations do you usually drink fizzy drinks or fruit squash?I never drink fizzy drinks or fruit squash .56 97 .32 95 How often do you spend your own money on fizzy drinks or fruit squash? .65 67 .32 53 If the price of fizzy drinks and fruit squash were doubled, I would buy less fizzy drinks or fruit squash from my own
money
.61 56 .42 42
How many times a week do you usually drink fruit juices? .64 48 .69 52
On a day that you drink fruit juices, how many glasses or cartons do you drink on such a day?Glasses or small cartons (250 ml)
.54 60 .54 51
On a day that you drink fruit juices, how many glasses or cartons do you drink on such a day?Regular cartons (330 ml) .52 73 .20 78 How many fruit juices did you drink yesterday?Glasses or small cartons (250 ml) .48 53 .65 63 How many fruit juices did you drink yesterday?Regular cartons (330 ml) .35 84 .17 83
I think that drinking fruit juices is... .62 65 .19 50
Table 3 Agreement (per questionnaire item) between questionnaires (test-retest reliability) and questionnaire and interview responses (construct validity) as indicated by intraclass correlation coefficients (ICC) and percentage
agree-ment (agree).(Continued)
I think drinking fruit juices will make me fat. .45 54 .45 47
I am allowed to take fruit juices whenever I want .67 59 .48 53
Do your parents/care givers have rules about how many fruit juices you are allowed to drink? .64 86 .68 87
Are there usually fruit juices in your home? .67 59 .57 52
In which situations are you most likely to drink fruit juices?During the weekend .41 70 .30 71 In which situations are you most likely to drink fruit juices?Breakfast .57 78 .57 79
In which situations are you most likely to drink fruit juices?Lunch .44 77 .24 73
In which situations are you most likely to drink fruit juices?Dinner .41 81 .32 81
In which situations are you most likely to drink fruit juices?At school .57 82 .29 87 In which situations are you most likely to drink fruit juices?While watching television .47 81 .25 84 In which situations are you most likely to drink fruit juices?As a thirst quencher between meals .46 76 .04 70 In which situations are you most likely to drink fruit juices?During/after sports .46 77 .14 77 In which situations are you most likely to drink fruit juices?When I am with friends .41 76 .62 88 In which situations are you most likely to drink fruit juices?At birthdays/parties .42 71 .45 76 In which situations are you most likely to drink fruit juices?I never drink fruit juices .53 98 .85 99 From Monday to Friday during school weeks, on how many days do you usually eat breakfast? .73 83 .23 80 On how many days in the weekend days (Saturday and Sunday) do you usually eat breakfast? .52 81 .39 87
What do you usually have for breakfast on school days? .57 65 .63 71
What is the reason that you usually skip breakfast? .74 83 .58 76
Did you eat breakfast yesterday? .64 91 .26 91
Did you eat lunch yesterday? .33 94 .00 96
Did you eat dinner yesterday? .33 92 1.00 100
Did you eat anything between meals yesterday? .42 76 .43 79
I think that eating breakfast is... .59 77 .01 44
I think it is recommended for children of my age to... .39 75 .30 77
I think not eating breakfast will make me fat .44 54 .45 51
I think eating breakfast will make me fat .48 55 .36 29
If I eat breakfast, my parents/care givers think this is... .53 77 .21 52
If I eat breakfast, most of my friends think this is... .53 63 .38 54
How often do your parents/care givers eat breakfast? .71 72 .69 73
How often do most of your friends eat breakfast? .53 63 .34 44
I like eating breakfast .65 72 .29 57
Eating breakfast is something that I do without even really thinking about it .59 54 .15 41
I find eating breakfast every day... .71 65 .36 50
My parents/care givers encourage me to have breakfast .65 59 .40 54
Do your parents/care givers have rules about whether you should eat breakfast? .55 79 .35 67 If you ask your parents/care givers to buy a certain brand of food or drink for breakfast, will they do it? .53 56 .34 51 Are there usually breakfast products (milk, cereals, bread et cetera) at your home? .42 75 .25 80
How often do you eat breakfast with your parents/care givers? .74 51 .66 41
In which situations do you usually eat your breakfast?At a set table at home .67 91 .16 86
In which situations do you usually eat your breakfast?In bed .56 95 .66 98
In which situations do you usually eat your breakfast?While watching television .62 85 .36 84 In which situations do you usually eat your breakfast?On my way to school .43 96 .00 98 In which situations do you usually eat your breakfast?At school before the class starts .44 94 -.02 96 In which situations do you usually eat your breakfast?I never eat breakfast .45 96 .00 99
How many days do you usually bike to school? .94 88 .81 73
Singhet al.International Journal of Behavioral Nutrition and Physical Activity2011,8:136 http://www.ijbnpa.org/content/8/1/136
Table 3 Agreement (per questionnaire item) between questionnaires (test-retest reliability) and questionnaire and interview responses (construct validity) as indicated by intraclass correlation coefficients (ICC) and percentage
agree-ment (agree).(Continued)
If you bike to school, how long does it take you to bike to school? .81 85 .66 75
How many days a week do you usually walk to school? .91 81 .84 75
If you walk to school, how long does it take you to walk to school? .70 76 .59 74
How many days do you usually travel by car to school? .91 84 .84 80
How many days do you usually travel by public transport (bus, school bus, tram, metro) to school? .88 92 .81 96
How did you go to school today? .79 83 .67 74
What do you usually do during breaks at school? .80 86 .65 81
I do not participate in any sports activities .76 92 .84 95
In a total week how many hours do you do this sport? .74 55 .61 50
I do not have a second sport .68 84 .51 75
In a total week how many hours do you do this sport? 1.00 43 1.00 36
How many hours of sports did you do yesterday? .22 28 .22 50
I think that physical activity/sports is... .54 86 .04 68
I think it is recommended for children of my age... .47 48 .09 39
I think NOT doing physical activity/sports will make me fat .49 54 .47 55
If I do physical activity/sports, my parents/care givers think this is... .46 81 -.02 51 If I do physical activity/sports, most of my friends think this is... .58 71 .35 58
How often do your parents/care givers do physical activity/sports? .67 58 .59 47
How often do most of your friends do physical activity/sports? .55 66 .32 55
I like doing physical activity/sports .64 81 .09 80
Physical activity/sports is something that I do without even really thinking about it. .56 52 .08 32
I find doing physical activity/sports for 1 hour every day... .64 71 .15 37
My parents/care givers encourage me to be physically active/do sports .65 62 .37 52
My parents/care givers help me if I need something for my sports .58 76 .39 80
Do your parents/care givers have rules about whether you should be physically active/do sports? .46 77 .49 77 Do your parents/care givers allow you to take part in physical activity/do sports? .21 94 1.00 100 If you indicate that you like a certain physical activity/sports will your parents/care givers allow you to do it? .62 63 .27 50 Do you have the following things at home that you can use for physical activities/sports?Bike .54 91 .64 91 Do you have the following things at home that you can use for physical activities/sports?Tennis and or badminton racket .66 85 .34 66 Do you have the following things at home that you can use for physical activities/sports?Ball .49 91 .20 80 Do you have the following things at home that you can use for physical activities/sports?Sporting shoes .49 89 .06 54 Do you have the following things at home that you can use for physical activities/sports?Skipping rope .75 89 .42 71 Do you have the following things at home that you can use for physical activities/sports?Skates .78 90 .39 69 Do you have the following things at home that you can use for physical activities/sports?Skis .81 93 .49 83 Do you have the following things at home that you can use for physical activities/sports?Skate board .76 88 .45 74 How often do you take part in physical activity/do sports with your parents/care givers? .47 47 .24 51 About how many hours a day do you usually watch television in your free time? Week days (average of all weekdays) .67 42 .63 44 About how many hours a day do you usually watch television in your free time? Weekend days (average of all weekend
days)
.68 36 .56 40
About how many hours a day do you usually play games on a computer, or use your computer for leisure activities in your free time? Week days (average of all week days)
.67 41 .35 30
About how many hours a day do you usually play games on a computer, or use your computer for leisure activities in your free time? Weekend days (average of all weekend days)
.67 38 .65 37
About how many hours did you watch television yesterday? .68 36 .70 44
About how many hours did you play games on a computer, games console or use your computer for leisure activities yesterday?
.54 39 .28 51
I think watching television is... .68 66 .19 44
Test-retest reliability study
For the total sample across all countries, the test-retest reliability was good to excellent in 115 (76.6%) items and moderate in 34 (22.7%) items. For one item (’How many hours of sports did you do yesterday?’) we found an ICC-value of .22, indicating poor test-retest reliabil-ity. Eleven response items did not show enough
variabil-ity, resulting in ICCs ≤ .60, but a high (≥90%)
percentage agreement (table 3). The test-retest reliability was comparable across all countries. Country-specific values can be found in additional file 1.
Construct validity study
Construct validity appeared to be good to excellent for 70 out of 150 items (46.7%), as indicated by ICCs > .60 or
percentage agreement≥75%. For the remaining part, the ICCs of 39 items (26.0%) indicated moderate construct validity and 41 items (27.3%) indicated poor construct validity.
Constructs that showed consistently poor values across most of the EBRBs were
- general attitude (e.g. ‘I think watching television is....’)
- automaticity (e.g.‘Drinking fizzy drinks or fruit squash is something I do without even really thinking about’)
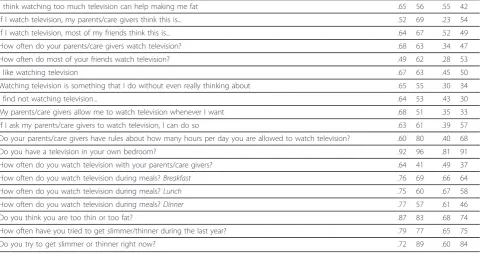
- parental and peer subjective norm (’If I watch tele-vision my parents/care givers think it is...’or ‘If I do Table 3 Agreement (per questionnaire item) between questionnaires (test-retest reliability) and questionnaire and interview responses (construct validity) as indicated by intraclass correlation coefficients (ICC) and percentage
agree-ment (agree).(Continued)
I think watching too much television can help making me fat .65 56 .55 42
If I watch television, my parents/care givers think this is... .52 69 .23 54
If I watch television, most of my friends think this is... .64 67 .52 49
How often do your parents/care givers watch television? .68 63 .34 47
How often do most of your friends watch television? .49 62 .28 53
I like watching television .67 63 .45 50
Watching television is something that I do without even really thinking about .65 55 .30 34
I find not watching television... .64 53 .43 30
My parents/care givers allow me to watch television whenever I want .68 51 .35 33
If I ask my parents/care givers to watch television, I can do so .63 61 .39 57
Do your parents/care givers have rules about how many hours per day you are allowed to watch television? .60 80 .40 68
Do you have a television in your own bedroom? .92 96 .81 91
How often do you watch television with your parents/care givers? .64 41 .49 37
How often do you watch television during meals?Breakfast .76 69 .66 64
How often do you watch television during meals?Lunch .75 60 .67 58
How often do you watch television during meals?Dinner .77 57 .61 46
Do you think you are too thin or too fat? .87 83 .68 74
How often have you tried to get slimmer/thinner during the last year? .79 77 .65 75
Do you try to get slimmer or thinner right now? .72 89 .60 84
Results are presented for all countries combined.
Table 4 Overview of the results per section of the ENERGY child-questionnaire for both test-retest reliability and construct validity study, combined for all countries (test-retest reliability study: n = 730; construct validity study: n = 96).
test-retest reliability construct validity
section of the ENERGY-child questionnaire
# items
range excellent n (%)
good n (%)
moderate n (%)
poor n (%)
range excellent n (%)
good n (%)
moderate n (%)
poor n (%) soft drinks 34 .42 - 1.00 4 (11.8) 22 (64.7) 8 (23.5) - .10 - 1.00 5 (14.7) 7 (20.6) 14 (41.2) 8 (23.5) fruit juices 22 .35 - .67 1 (4.5) 14 (63.6) 7 (31.8) - .04 - .85 1 (4.5) 12 (54.5) 7 (31.8) 2 (9.1) breakfast 30 .33 - .74 8 (26.7) 13 (43.3) 9 (30.0) - .00 - 1.00 7 (23.3) 11 (36.7) 2 (6.7) 10 (33.3) physical activity behaviour 37 .21 - 1.00 11 (29.7) 19 (51.4) 6 (16.2) 1 (2.7) .04 - 1.00 7 (18.9) 10 (27.0) 9 (24.3) 11 (29.7) screen viewing behaviour 24 .48 - .92 1 (4.2) 19 (76.2) 4 (16.7) - .23 - .81 2 (8.3) 5 (20.8) 7 (29.2) 10 (41.7)
dieting behaviour 3 .72 - .87 1 (33.3) 2 (66.7) - - .60 - .68 - 3 (100) -
-Overall 150 .21 - 1.00 26 (17.3) 89 (59.3) 34 (22.7) 1 (.7) .00 - 1.00 22 (14.7) 48 (32.0) 39 (26.0) 41 (27.3) Singhet al.International Journal of Behavioral Nutrition and Physical Activity2011,8:136
http://www.ijbnpa.org/content/8/1/136
physical activity/sports, most of my friends think it is...’)
Nine response items did not show enough variability, resulting in ICCs ≤ .40, but high (≥ 90%) percentage agreement (table 3).
The construct validity was comparable across all countries, except for Greece and the Netherlands. Greek data showed higher ICCs and percentages agreement (see additional file 2). The construct validity in Greece was excellent in about two thirds (68.0%) of the items, good in 19.3%, moderate in 10.7%, and poor in 2.0% of the items. Dutch data showed lower ICCs and percen-tages agreement. The construct validity in the Nether-lands was excellent to good in 46.7% of the items, moderate in 26.0%, and poor in 27.3% of the items.
Discussion
The current study assessed the test-retest reliability and construct validity of the ENERGY-child questionnaire in 10-12 year old children from six countries in Europe. The ENERGY-child questionnaire, assessing EBRBs of the child as well as potential personal, family, and school-environmental correlates of these EBRBs, showed good test-retest reliability and moderate to good con-struct validity.
In the light of the scarcity of the published reliable and valid instruments that simultaneously assess both sides of the energy balance, the results of the current study should be helpful for future research.
Test-retest reliability
More than three quarter of all items (n = 115 out of 150) of the ENERGY-child questionnaire showed good to excellent test-retest reliability.
Exceptions on these findings are the questions in which children were asked about‘yesterday’(e.g. ‘About how many hours did you watch television yesterday?’). Here we find lower values especially on items like con-sumption of soft drinks, television watching and sports participation. Lower ICCs or percentage agreement are to be expected regarding such a question, because chil-dren will have larger variety in activities engaged in yes-terday compared to on a usual day.
With comparable results across all countries, our results show that the ENERGY-child questionnaire has good test-retest reliability in the six European countries that participated in the current study.
Construct validity
Values for the construct validity were somewhat lower than those for the test-rest reliability. A closer examina-tion of the quesexamina-tions showed that across all EBRBs, sev-eral constructs had consistently lower scores (i.e. gensev-eral
attitude, habit strength, parental and peer subjective norm). The lower validity for the habit strength ques-tions is consistent with the findings of the ENERGY-parent questionnaire, where we also found lower values for the habit strength questions [Singhet al: Test-retest reliability and construct validity of the ENERGY-parent questionnaire on parenting practices, energy balance-related behaviours and their potential behavioural deter-minants: the ENERGY-project. submitted for publica-tion]. These findings indicate that the use of single questions out of the original habit strength index [19] is not to be advised, and other habit strength question-naire items should be considered in future research.
All items that have poor values should be reconsid-ered and in interpreting research results based on these items the lack of construct validity should be noted.
Some differences between countries were observed, i.e. Greece and the Netherlands, but because the number of cases per country was relatively small (Greece: n = 16 and the Netherlands: n = 20), we believe that more value should be attached to the combined data set.
However, for future interpretation of results of the ENERGY-study, these country-specific values might be helpful, explaining cross-country differences.
Comparison with other studies
Only few studies have reported on the psychometric properties of child questionnaires assessing a range of EBRBs. The psychometric properties of the Health Behaviours in School Children (HBSC) questionnaire has been reported in two different papers [20,21]. Ver-eeckenet al. [20] reported on the reliability and validity of questionnaire items aiming to assess a number of food items from the HBSCquestionnaire (HBSC FFQ) -among which soft drinks. Test-rest reliability for soft drink consumption was comparable to the values we found: in 11-12 year olds, Vereeckenet al. [20] report a weighed kappa of .66 (percentage agreement: 53%). Similar to our results, the score for validity was some-what lower. It is noteworthy, that Vereeckenet al. [20] mention that overestimation is very likely when measur-ing food items such as soft drinks.
had acceptable reliability, with values for children with a mean age of 13.7 years ranging between .36 - .44 (fre-quency) and .22 - .26 (duration).
There are at least two other studies that are worth com-paring our results to, i.e. a study among children of the same age range, focusing on energy intake [22] and another cross-European study focussing on fruit and vege-table consumption [14]. Wilsonet al. [22] examined the psychometric properties of a questionnaire among 10-12 year olds. The authors conclude that this 54-item ques-tionnaire is to be a reliable and valid tool to assess dietary patterns and food behaviours, attitudes and environments in Australian school children [22]. Similar to the ENERGY-child questionnaire, Wilsonet al. [22] assessed intake of sweetened beverages and found similar values for both reliability (.59) and validity (.34). The range of ICC values of the ENERGY-child questionnaire was somewhat broader than those reported by Wilsonet al. [22]. This might be due to the fact that Wilsonet al. present the ICCs for sum scores instead of single items, as we did. The fact that their study population for the test-retest reliability was much smaller (n = 134 versus 730) and that they examined a questionnaire focusing on energy intake and its determinants prohibits further comparison.
Comparing our study to other studies that assessed validity, it should be considered that both Vereeckenet al. [20] and Wilson et al. [22] compared their question-naires to 7-day food diaries, whereas in our study we conducted an interview assessing construct validity. Comparison to food records assesses the relative validity of the questionnaire and may be regarded as a more rig-orous test of validity.
De Bourdeaudhuij et al. [14] examined the reliability and validity of a questionnaire assessing personal, social and environmental correlates of fruit and vegetable intake in schoolchildren in five European countries. The authors conclude that the questionnaire is a reliable and valid tool for 10-11 year-olds. Comparable to our study, they report good to very good test-retest reliability for the majority of the items. Again, detailed comparison with the results of the present validity study is not pos-sible, because de Bourdeaudhuij et al. [14] examined predictive validity instead of construct validity.
Strengths and limitations
The test-retest study has several strengths, covering both the data collection and handling phase (i.e. large sample size, standardised protocol, centralised data management) and a questionnaire covering a large vari-ety of children’s EBRBs as well as potential personal, family, and school-environmental determinants, available for administration in nine languages.
However, also some limitations should be mentioned when interpreting our results. The study sample of the
construct validity study was relatively small and therefore not fully representative of the total population of children across the countries represented, limiting the generaliz-ability of the findings of the construct validity study.
The lack of a‘gold standard’in the validation study must be considered as a major limitation; such gold standards are just not available for assessment of most EBRBs or potential behavioural determinants. We chose to investi-gate construct validity of the questionnaire by comparing the answers of the questionnaire to the answers given in a face-to-face interview. The method of comparing ques-tionnaires to interviews has been previously used to vali-date parent questionnaires on children’s physical activity correlates [23]. Using interviews also enabled us to learn whether the respondents interpreted the questions as we intended. We therefore think that the use of face-to-face interviews was a strength of the current study, adding important feedback and gaining more insight into the par-ticipants’answers. Three shortcomings of this method for the validation of the questionnaire should be mentioned. First, the interpretation of the responses in the interview might lead to bias. We attempted to minimise this bias by following a strict data entry protocol, i.e. the face-to-face interviewer was another person as the one who filled in a second questionnaire based on the interview results. A second shortcoming lies within the fact that both data, i.e. from the questionnaire and the interview, were based on self-report, making it likely that there is correlated error between both measures. A third and general shortcoming of subjective reporting is that answers are more likely to be given in a social desirable direction, and a face-to-face interview is likely to increase this bias. We aimed to mini-mise this form of bias by clearly indicating the importance of honest answers instead of social desirable answers before the interview.
When interpreting the results, it should be considered that in the current study protocol, data were not col-lected on Mondays, to make sure that the questions referring to ‘yesterday’did not cover a weekend day. Most probably, recalling activities on weekend days is more difficult for children, when compared to weekdays, since the latter tend to be more structured [5].
The current study examined the test-retest reliability and construct validity of the ENERGY-child question-naire. Internal consistency was not assessed because most constructs were assessed by only one or two items. Future studies need to establish other aspects of validity
and reliability such as content validity and
responsiveness.
Conclusion
Our results demonstrate that the ENERGY-child ques-tionnaire, assessing EBRBs of the child as well as perso-nal, family, and school-environmental determinants
Singhet al.International Journal of Behavioral Nutrition and Physical Activity2011,8:136 http://www.ijbnpa.org/content/8/1/136
related to these EBRBs, has good test-retest reliability and moderate to good construct validity.
Being able to validly and reliably assess EBRBs and several potential determinants of those EBRBs in differ-ent languages and countries will enable future observa-tional and intervention research regarding childhood overweight and its drivers.
Additional material
Additional file 1: Table. Country-specific results of the test-retest reliability study of the ENERGY-child questionnaire: agreement (per questionnaire item) between questionnaires as indicated by intraclass correlation coefficients (ICC) and percentage agreement (agree). Country-specific results of the test-retest reliability study of the ENERGY-child questionnaire.
Additional file 2: Table. Country-specific results of the construct validity study of the ENERGY-child questionnaire: agreement (per questionnaire item) between questionnaire and interview as indicated by intraclass correlation coefficients (ICC) and percentage agreement (agree).
Author details
1VU University Medical Center, EMGO Institute for Health and Care Research, Dpt. of Public and Occupational Health, Amsterdam, the Netherlands. 2University of Agder, Department of Public Health, Sport and Nutrition, Kristiansand, Norway.3Ghent University, Department of Movement and Sport Sciences, Gent, Belgium.4GENUD (Growth, Exercise, NUtrition and
Development) Research Group, Escuela Universitaria de Ciencias de la Salud, Universidad de Zaragoza, Zaragoza, Spain.5University of Pécs, Department of Paediatrics, Pecs, Hungary.6Harokopio University, Department of Nutrition and Dietetics, Athens, Greece.7ResCon, Amsterdam, the Netherlands.8VU University Medical Center, EMGO Institute for Health and Care Research, Amsterdam, the Netherlands.
Authors’contributions
ASS, MJMC, MM and JB developed the measurement instrument. ASS developed the study protocol, coordinated and supervised the international data collection. ASS, FNV, MV, JMFA, SS and YM contributed to or supervised the national data collection procedures. LU conducted the data analyses under supervision of ASS and MJMC. FNV conducted the data analyses under supervision of ASS and LU. ASS drafted the manuscript. All authors read and approved the final manuscript.
Funding
The ENERGY-project is funded by the Seventh Framework Programme (CORDIS FP7) of the European Commission, HEALTH (FP7-HEALTH-2007-B). The content of this article reflects only the authors’views and the European Community is not liable for any use that may be made of the information contained therein.
Competing interests
The authors declare that they have no competing interests.
Received: 5 June 2011 Accepted: 9 December 2011 Published: 9 December 2011
References
1. World Health Organization:Diet, nutrition, and prevention of chronic diseases, Joint WHO/FAO Expert Consultation, Geneva, 28 Jan - 1 Feb 2002.WHO technical report series 916Geneva, Switzerland; 2003. 2. Wendel-Vos GC, Schuit AJ, Saris WH, Kromhout D:Reproducibility and
relative validity of the short questionnaire to assess health-enhancing physical activity.J Clin Epidemiol2003,56:1163-1169.
3. Kohl HW, Fulton JE, Caspersen CJ:Assessment of physical activity among children and adolescents: A review and synthesis.Preventive Medicine
2000,31:S54-S76.
4. Mcmurray RG, Ring KB, Treuth MS, Welk GJ, Pate RR, Schmitz KH,et al: Comparison of two approaches to structured physical activity surveys for adolescents.Med Sci Sports Exerc2004,36:2135-2143.
5. Lubans DR, Hesketh K, Cliff DP, Barnett LM, Salmon J, Dollman J,et al:A systematic review of the validity and reliability of sedentary behaviour measures used with children and adolescents.Obes Rev2011,12:781-799. 6. Chinapaw MJ, Mokkink LB, Van Poppel MN, van Mechelen W, Terwee CB:
Physical activity questionnaires for youth: a systematic review of measurement properties.Sports Med2010,40:539-563.
7. Collins CE, Watson J, Burrows T:Measuring dietary intake in children and adolescents in the context of overweight and obesity.Int J Obes (Lond)
2010,34:1103-1115.
8. Tourangeau R, Rips LJ, Rasinski K:The Psychology of Survey Response
Cambridge: Cambridge University Press; 2000.
9. Brown H, Hume C, Chinapaw M:Validity and reliability of instruments to assess potential mediators of children’s physical activity: A systematic review.J Sci Med Sport2009,12:539-548.
10. Brug J, Te Velde SJ, Chinapaw MJ, Bere E, De Bourdeaudhuij I, Moore H,
et al:Evidence-based development of school-based and family-involved prevention of overweight across Europe: the ENERGY-project’s design and conceptual framework.BMC Public Health2010,10:276.
11. van Stralen MM, Te Velde SJ, Singh AS, De Bourdeaudhuij I, Martens MK, van der Sluijs M,et al:EuropeaN Energy balance Research to prevent excessive weight Gain among Youth (ENERGY) project: Design and methodology of the ENERGY cross-sectional survey.BMC Public Health
2011,11:65.
12. van der Horst K, Oenema A, van de Looij-Jansen , Brug J:The ENDORSE study: research into environmental determinants of obesity related behaviors in Rotterdam schoolchildren.BMC Public Health2008,8:142. 13. Singh AS, Chin A Paw JM, Kremers SP, Visscher TL, Brug J, Van Mechelen W:
Design of the Dutch Obesity Intervention in Teenagers (NRG-DOiT): Systematic development, implementation and evaluation of a school-based intervention aimed at the prevention of excessive weight gain in adolescents.BMC Public Health2006,6:304.
14. De Bourdeaudhuij I, Klepp KI, Due P, Rodrigo CP, de Alemeida M, Wind M,
et al:Reliability and validity of a questionnaire to measure personal, social and environmental correlates of fruit and vegetable intake in 10-11-year-old children in five European countries.Public Health Nutr2005, 8:189-200.
15. Landis JR, Koch GG:The measurement of observer agreement for categorical data.Biometrics1977,33:159-174.
16. Mcgraw KO, Wong SP:Forming inferences about some intraclass correlation coefficients.Psychological Methods1996,1:30-46. 17. Nunnally JC, Bernstein IH:Psychometric theory.3 edition. New York:
McGraw-Hill; 1994.
18. Saelens BE, Frank LD, Auffrey C, Whitaker RC, Burdette HL, Colabianchi N: Measuring Physical Environments of Parks and Playgrounds: EAPRS Instrument Development and Inter-Rater Reliability.Journal of Physical Activity and Health2006,3:S190-S207.
19. Verplanken B, Orbell S:Reflections on past behavior: A self-report index of habit strength.Journal of Applied Social Psychology2003,33:1313-1330. 20. Vereecken CA, Maes L:A Belgian study on the reliability and relative
validity of the Health Behaviour in School-Aged Children food-frequency questionnaire.Public Health Nutrition2003,6:581-588.
21. Booth ML, Okely AD, Chey T, Bauman A:The reliability and validity of the physical activity questions in the WHO health behaviour in
schoolchildren (HBSC) survey: a population study.British Journal of Sports Medicine2001,35:263-267.
22. Wilson AM, Magarey AM, Mastersson N:Reliability and relative validity of a child nutrition questionnaire to simultaneously assess dietary patterns associated with positive energy balance and food behaviours, attitudes, knowledge and environments associated with healthy eating.Int J Behav Nutr Phys Act2008,5:5.
23. McMinn AM, Van Sluijs EM, Harvey NC, Cooper C, Inskip HM, Godfrey KM,
et al:Validation of a maternal questionnaire on correlates of physical activity in preschool children.Int J Behav Nutr Phys Act2009,6:81.
doi:10.1186/1479-5868-8-136
Cite this article as:Singhet al.:Test-retest reliability and construct validity of the ENERGY-child questionnaire on energy balance-related behaviours and their potential determinants: the ENERGY-project.