Http://www.ijetmr.com©International Journal of Engineering Technologies and Management Research [208]
A TOOLBOX DESIGN FOR LABORATORY APPLICATION OF
ELECTRONIC NOSE USING VIRTUAL INSTRUMENTATION
Mohammad Ayub Khan *1, Prakash Chandras 2, Pratibha Mishra 3, Rajansh Sinha 4 *1, 4
Electronics and Communication, Anand Engineering College, Agra, India 2
Electronics and Communication, SIET, Greater Noida, India
3
Electronics and Communication, RKGEC, Pilkhuwa, Ghaziabad, India Abstract:
The tool consists of several virtual instrumentation allowing the implantation of the different measurement technique that are commonly used in this research field. What follows describes an integrated system that automatically controls the composition of the mixture under analysis, provides set up for both the virtual instrumentation and customs electronics, and performs the selected class algorithms for features extraction, data dimensionality reduction and classification. Assisting perspective task to virtual instrumentation controlling the entire system gives us the possibility to avoid the presence of error due to human control. Such systems, and in particular those designed for research application, utilize a large number of sub system for chemical sampling control, for signal generation and acquisition, and for data manipulation. This paper describes a tool box of virtual instrumentation developed for research purposes and based on a laboratory electronics nose.
Keywords: Electronic Nose; Sno2 Sensor; Virtual Instrumentation.
Cite This Article: Mohammad Ayub Khan, Prakash Chandras, Pratibha Mishra, and Rajansh Sinha. (2018). “A TOOLBOX DESIGN FOR LABORATORY APPLICATION OF
ELECTRONIC NOSE USING VIRTUAL INSTRUMENTATION.” International Journal of
Engineering Technologies and Management Research, 5(2:SE), 208-215. DOI:
https://doi.org/10.29121/ijetmr.v5.i2.2018.646.
1. Introduction
Http://www.ijetmr.com©International Journal of Engineering Technologies and Management Research [209] compare their characteristics with a data base of known smells. WITNESSING THE SWIFT ADVANCES in the electronic means of seeing and hearing, scientists and engineers scent a market for systems mimicking the human nose. . The harnessing of electronics to measure smell is greatly to be desired. Human panels backed by gas chromatography and mass spectrometry (CCIhlS) are helpful in quantifying smells, but they are time-consuming, expensive, and seldom performed in real time in the field. So it is usefull that other methods give way to a fast procedure using an electronic nose composed of gas sensors.
2. Gas Sensor
A quantitative model of the gas-sensing processes occurring at the surface of tin-dioxide thick and porous layers is presented. The model accepts the conduction mechanism as being governed by the Schottky potential barriers at the junctions between adjoining grains. The potential barrier heights are modulated by the surface coverage of the SnO2 grains with negatively charged chemisorbed oxygen species. To describe the interaction of reducing gas molecules with the chemisorbed oxygen, a method, of “conditioned adsorption”, has been developed. The central idea was to assume that the reducing gas molecules are “adsorbed” (i.e. react) only on pre-adsorbed oxygen. The SnO2 in an n-type semiconductor. The donor states are usually associated with the oxygen bulk vacancies [1]-[3]. The first step of the sensing mechanism is the "sensitizing" chemisorption of oxygen. The oxygen molecules are adsorbed in various sites on the tin dioxide surface:
O2↔ 2Oadsz (1)
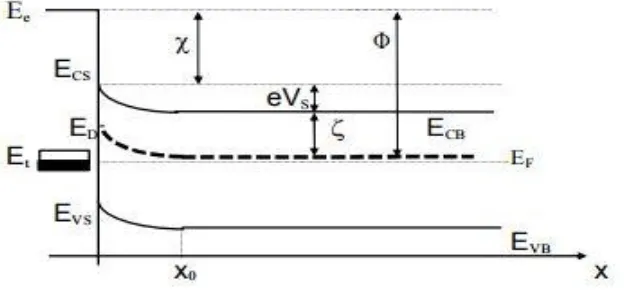
As in the SnO2 lattice, the oxygen appears as O 2- , the oxygen adsorption creates surface acceptor states O/O - and O- /O 2- on which conduction electrons will be trapped [1]- [3]. These electronic states are placed on the band diagram bellow the Fermi level (Figure 1)
Oads+ e- O –ads
Http://www.ijetmr.com©International Journal of Engineering Technologies and Management Research [210] Figure 1: Surface Schottky-barrier profile with pinned Fermi level
Further on, we will also assume that two conduction electrons are trapped on all the adsorbed oxygen species, in other words that all chemisorbed oxygen from the SnO2 surface became O 2-ions. The effect of the decreasing gas is to reduce the chemisorbed oxygen. As a consequence, the surface net charge is lowered and the trapped electrons are released back to the conduction band. The reaction corresponding to this process is:
R + O 2- ↔ RO + 2e – (3)
Further on we will use the following notations:
N- Surface density of negatively - charged chemisorbed oxygen. The chemisorbed oxygen carries a 2e negative charge due to the capture of conduction electrons
NS - Density of surface adsorption sites for oxygen.
n -bulk concentration of conduction electrons.
ND - volume concentration of donors (oxygen vacancies) We have then, for the surface density of the chemisorbed oxygen the relation:
N -= NS (1-ѲR) (4)
We assumed that when the oxygen is reduced, two electrons are injected back to the conduction band.
The net surface charge density will be given by:
(5)
By introducing this formula, one obtains, for the surface Schottky-barrier height
Http://www.ijetmr.com©International Journal of Engineering Technologies and Management Research [211] (7)
The conductivity of the sensor will be given by:
G=en (8)
Where the bulk mobility and n the concentration of the electrons. Not is all the electrons have a high enough energy to overpass the Schottky barrier, though. According to the Maxwell-Boltzmann statistics, the conductance may be written:
Vector/target vector pairs. Each target vector has K elements. One of these elements is 1 and the rest is 0. Thus, each input vector is associated with one of K classes. The initial-layer input weights, IW1, 1 (net.IW{1,1}) are set to the transpose of the matrix formed from the Q training pairs, P'. When an input is presented the ||dist|| box produces a vector whose elements indicate how close the input is to the vectors of the training set. All elements are multiplied, point by point, by the bias and sent the radial basic transfer function. An input vector close to a training vector is represented by a number close to 1 in the output vector a1. If an input is close to various training vectors of a single class, it is represented by several elements of a1 that are close to 1. The second-layer weights, LW1,2 (net.LW{2,1}), are set to the matrix T of target vectors. Every vector has a 1 only in the row associated with that particular class of input, and 0's elsewhere. (A function ind2vec is use
(9)
By using (6) and by defining, G0, the conductivity in clean air as:
(10)
One obtains for the normalized sensitivity of the sensor (G/G0 ratio), the relation:
(11)
Http://www.ijetmr.com©International Journal of Engineering Technologies and Management Research [212] (12)
From equations (11) and (12), one can write the response function as:
(13)
Where c is the gas concentration in ppm and (G/G0)sat and are parameters which will be determined by fitting the equation with the experimental data.
3. Neural Network
Probabilistic neural networks [2] can be used for classification problems. When an input is presented, the initial layer computes distances from the input vector to the training input vectors, and produces a vector whose elements indicate how close the input is to a training input. The next layer sums these contributions for each class of inputs to produce as its net output a vector of probabilities. Lastly, a final transfer function on the output of the second layer picks the maximum of these probabilities, and produces a 1 for that class and a 0 for the other classes. The architecture for this system is shown below.
Q = number of input / target pairs = number of neurons in layer 1 R = number of elements in input vector
K = Number of classes of input data= number of neurons in layer 2
It is assumed that there are Q input d to create the proper vectors.) The multiplication Ta1 sums the elements of a1 due to each of the K input classes. Lastly,, the second-layer transfer function, compete, produces a 1 corresponding to the largest element of n2, and 0's elsewhere.
3.1.Neural Network Toolbox Design (newpnn) in MATLAB
Http://www.ijetmr.com©International Journal of Engineering Technologies and Management Research [213] Which yields P =
0 1 0 1 3 `4 4
0 1 3 4 1 13
Tc = [1 1 2 2 3 3 3];
Which yields Tc =
1 1 2 2 3 3 3
We need a target matrix with 1's in the right place. We can get it with the function ind2vec. It gives a matrix with zeros except at the correct points. So execute T = ind2vec (Tc)
Which gives T =
(1,1) 1 (1,2) 1 (2,3) 1 (2,4) 1 (3,5) 1 (3,6) 1 (3,7) 1
Now we can create a network and simulate it, using the input P to make sure that it does produce the correct classifications.
net = newpnn(P,T); Y = sim(net,P) Yc = vec2ind(Y) Finally we get, Yc =1 12 2 3 3 3
We might try classifying vectors other than those that were used to design the network. We will try to classify the vectors shown below in P2.
P2 = [1 4;0 1;5 2]'
P2 = 1 0 5
4 1 2
If we run the simulation and plot the vectors as we did before, we get
Yc =n2 1 3
These results look good, for these test vectors were quite close to members of classes 2, 1 and 3 respectively. The network has managed to generalize its operation to properly classify vectors other than those used to design the network.
4. Modelling View
Http://www.ijetmr.com©International Journal of Engineering Technologies and Management Research [214] From diagram below we can see the whole modeling of toolbox for laboratory electronic nose application. Already we have explained the function of gas sensor so that we can model it in LabVIEW. The mathematical model[5] of gas sensor works on whole mathematical expression shown above. The neural network designing is done in Matlab. As here we are doing classification so we will go for probabilistic neural network. The whole design criteria and example for PNNdesigning is shown above. The final classification will look like as below. Blue dots are showing the training data of PNN and red dot is a test data.
5. Conclusions and Recommendations
The artificial human related sensor system[4] evolved from human perception measurement is proposed with emphasis on issue of complex quality determination and focusing on gas classification .The paper presents basic background in feature extraction and fusion of artificial sensor system. In this concept of artificial perception we extract feature on electronic nose. Applying multivariate analysis methods may show that the sensor units evaluate the properties of experimental samples in a different way. However, by combining types of sensor and features from the different sensor data it is possible to reduce the amount of data to be processed further in a classification phase.
Acknowledgements
We are highly obliged to our team members because through the supportive help of each and every person involved in the project, we achieved our aim. There is no way where there is no will and with the willingness of our faculty guides and the other numerous hands which cannot be counted at hands, we were able to achieve the task.
References
[1] N. Bârsan and R. Ionescu, “The Mechanism of the Interaction between CO and an SnO2 Surface:
Http://www.ijetmr.com©International Journal of Engineering Technologies and Management Research [215] Atmosphere Influence”, Sensors and Actuators B17 (1994), 241-246
[4] Peter Wide, “The Human-Based Multisensor Fusion Method for Artificial Nose and Tongue Sensor Data”, IEEE TRANSACTIONS ON INSTRUMENTATION AND MEASUREMENT, VOL. 47, NO. 5, OCTOBER 1998
[5] Andrei Fluerasu, Syprotec Inc. , Pointe Claire, Quebec Nicolae Bârsan, Institute for Interface Analysis and Sensors, Tuebingen, Germany Ken K. Chin, New Jersey Institute of Technology, Newark, NJ, “Gas Sensing Mechanisms in Thick and Porous SnO2 layers
*Corresponding author.