Research Article
Pop-Q Components Comparison among Multiparous
and Nulliparous Women
Perbandingan Nilai Komponen Pop-Q pada Perempuan Multipara dan Nullipara
Lucy Lisa, Trika Irianta, Josephine L Tumedia
Department of Obstetrics and Gynecology Faculty of Medicine University of Hasanuddin/
Dr. Wahidin Sudiro Husodo Hospital Makassar
INTRODUCTION
In the United States, nearly 200,000 women under-went surgery for pelvic organ prolapse annually. From studies in the UK and Scotland for 20 years, from 1968 to 1974 years, Mant et al reported that the incidence of prolapse was 2.04 per 1000 wo-men.1
Urogenital prolapse occurs when there is a weakness in the pelvic floor structures. Previous studies found that approximately 50% of women who had given birth had prolapse, and 10%-20%
of them present with serious symptoms. Its inci-dence increases with age as Swift et al discovered that nearly 50% of women aged over 50 years had complaints of urogenital prolapse.2
During the period of 1995-2000, Dr. Cipto Ma-ngunkusumo hospital treated 240 cases of genital prolapse with most patients requiring treatment belonging to the age group of 60-70 years and with parity of more than three.3
The etiology of pelvic organ prolapse is multi-factorial. Based on epidemiological studies, there is Abstract
Objective: To compare the measurement of POP-Q components bet-ween multiparous and nulliparous women.
Method: This study is a cross-sectional research conducted in se-veral hospitals in Makassar during the period of June to October 2012, with 270 women as the subjects. Subjects were divided into three groups: nulliparous, parity 1-2, and parity 3 (multiparous). We analyzed the mean POP-Q components results between 3 groups using t-test, analysis of prolapse based on POP-Q components mea-surement, and analysis of correlation between risk factors with pro-lapse was done using Chi-square test.
Result: There is a significant difference in POP-Q components mea-surement between multiparous and nulliparous women, consecu-tively for: Aa point -2.14 and -2.97 cm, Ba point -2.11 and -2.99 cm, C point -5.69 and -6.86 cm, gh 3.33 and 2.70 cm, pb 2.60 and 3.27 cm, TVL 8.65 and 9.06 cm, Ap point 2.35 and 2.93 cm, Bp point -2.61 and -2.96 cm, D point -6.61 and -7.42 cm. In multiparous women, points Aa, Ba, C, D, Ap and Bp became more prolapsed, gh became longer, while pb and TVL became shorter.
Conclusion: The proportion of prolapse is higher in multiparous women with significant associations with age, body mass index, edu-cation level, and history of heavy physical work, delivering a large baby and use of hormonal contraceptives.
[Indones J Obstet Gynecol 2014; 4: 204-210]
Keywords: multiparous women, nulliparous women, parity, POP-Q
Abstrak
Tujuan: Untuk membandingkan nilai komponen POP-Q antara pe-rempuan multipara dan nullipara.
Metode: Penelitian ini menggunakan desain potong lintang yang di-laksanakan di beberapa rumah sakit di Makassar selama periode Juni-Oktober 2012, dengan sampel sebanyak 270 perempuan yang me-menuhi kriteria inklusi dan eksklusi. Sampel dibagi dalam 3 kelompok yaitu nullipara, paritas 1-2 dan paritas 3 (multipara). Analisis per-bandingan rerata komponen POP-Q antara ketiga kelompok menggu-nakan uji t, analisis kejadian prolaps berdasarkan ukuran komponen POP-Q, dan analisis hubungan faktor-faktor risiko prolaps dengan ke-jadian prolaps dengan menggunakan uji Chi-square.
Hasil: Terdapat perbedaan yang signifikan antara nilai komponen POP-Q pada perempuan multipara dan nullipara; yaitu untuk titik Aa -2,14 dan -2,97 cm, titik Ba -2,11 dan -2,99 cm, titik C -5,69 dan -6,86 cm, gh 3,33 dan 2,70 cm, pb 2,60 dan 3,27 cm, TVL 8,65 dan 9,06 cm, titik Ap -2,35 dan -2,93 cm, titik Bp -2,61 dan -2,96 cm, dan titik D -6,61 dan -7,42 cm, secara berturut-turut. Pada perempuan multipara, ukuran titik Aa, Ba, C, D, Ap dan Bp menjadi semakin prolaps, gh menjadi lebih panjang, sementara pb dan TVL menjadi lebih pendek.
Kesimpulan: Persentase kejadian prolaps lebih tinggi pada multi-para, dengan kaitan yang signifikan antara faktor usia, indeks massa tubuh, tingkat pendidikan, serta riwayat kerja berat, riwayat anak be-sar dan riwayat penggunaan kontrasepsi hormonal dengan prolaps organ panggul.
[Maj Obstet Ginekol Indones 2014; 4: 204-210]
Kata kunci: paritas, perempuan multipara, perempuan nullipara, POP-Q
evidence that the occurrence of pelvic organ pro-lapse is associated with pregnancy and delivery, es-pecially multiparity and vaginal delivery.4
Hormonal changes in pregnant women are phy-siologic. During pregnancy, collagen undergoes de-polymerization by placental hormones and the ra-tio of glycosaminoglycans changes. The loss of pla-cental hormones can restore tissue integrity, suggesting that these symptoms may disappear af-ter delivery in most women. However, in some women, these symptoms can persist and cause se-rious predicament.5
Currently, pelvic organ prolapse (POP) is mea-sured by using Pelvic Organ Prolapse Quantifi-cation (POP-Q) system. The system measures 6 points and 3 distances in and around the vagina in centimeters to provide appropriate boundaries, known as Aa, Ba, C, D, Ap, Bp, genital hiatus (GH),
perineal body (pb), and total vaginal length (TVL). This system has been recognized as a standard measurement for pelvic organ prolapse.6
Currently, there is no accurate data of the size and reliable components of POP-Q on nulliparous and multiparous women. Therefore, we conducted this research to study the POP-Q components.
METHODS
This study was conducted at Dr. Wahidin Sudiro-husodo teaching hospital and its network of hos-pitals in the Department of Obstetrics and Gyne-cology, Faculty of Medicine Hasanuddin University. Sample collection is carried out during the period of June to October 2012. The population in this study was all nulliparous and multiparous women, with a sample size of 270 women collected through non-randomized consecutive sampling. Data was processed using univariate analysis to describe the distribution, the mean value, standard deviation and the range. To analyze the independent ables with a nominal scale and the dependent vari-able with numerical scale, we used t-test. The as-sociation between parity group and the incidence of prolapse was assessed using Chi-Square test.
RESULTS
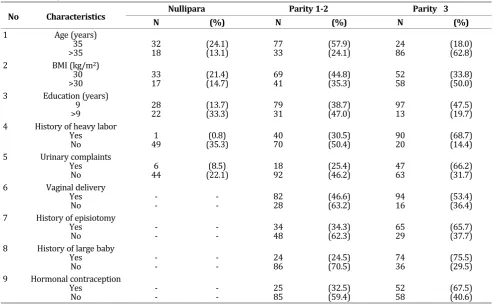
Sample Characteristics
Table 1. Samples Characteristics
No Characteristics Nullipara Parity 1-2 Parity 3
N (%) N (%) N (%)
1 Age (years) 35
>35 3218 (24.1)(13.1) 7733 (57.9)(24.1) 2486 (18.0)(62.8) 2 BMI (kg/m2)
30
>30 3317 (21.4)(14.7) 6941 (44.8)(35.3) 5258 (33.8)(50.0) 3 Education (years)
9
>9 2822 (13.7)(33.3) 7931 (38.7)(47.0) 9713 (47.5)(19.7) 4 History of heavy labor
Yes
No 491 (35.3)(0.8) 4070 (30.5)(50.4) 9020 (68.7)(14.4) 5 Urinary complaints
Yes
No 446 (22.1)(8.5) 1892 (25.4)(46.2) 4763 (66.2)(31.7) 6 Vaginal delivery
Yes
No -- -- 8228 (46.6)(63.2) 9416 (53.4)(36.4) 7 History of episiotomy
Yes
No -- -- 3448 (34.3)(62.3) 6529 (65.7)(37.7) 8 History of large baby
Yes
No -- -- 2486 (24.5)(70.5) 7436 (75.5)(29.5) 9 Hormonal contraception
Yes
Of the total sample evaluated, grouping was done to distinguish the age (age 35 years and >35 years), body mass index (BMI 30 kg/m2 and >30 kg/m2), the level of education (between 9 years and >9 years), history of complicated labor, com-plaints of urinary disorders, vaginal delivery, his-tory of episiotomy, and hishis-tory of hormonal con-traceptives use (Table 1).
The sample of this study based on age was di-vided into 2 groups, age 35 and >35 years. Age and incidence of prolapse showed a significant as-sociation (Table 2), in points Aa, Ba, C, and Ap, where p-value were 0.001, 0.000, 0.031, and 0.006, respectively. However, there is no meaningful as-sociation for point D (p-value=0.123) and point Bp (p-value=0.364).
In this study, a BMI of >30 kg/m2 have a signifi-cant association with the incidence of anterior va-ginal wall prolapse (Table 2) only in the point of Aa (p-value=0.003) and Ba (p-value=0.028), whereas other points showed no significant rela-tionship (p-value>0.05).
Level of education as one of the characteristics in this study also showed a significant association with the incidence of prolapse based on the size of point Aa (p-value=0.008), point Ba (p-value=0.001), point C (p-value=0.049) and point Bp (p-value= 0.001), whereas it was not significant for point D (p-value=0.908) and point Ap (p-value=0.073).
In this study, there is a significant association between history of heavy labor and the incidence of prolapse based on changes in the size of all com-ponents of POP Q as presented in Table 2.
Table 2. Association Between Age, BMI, Education, History of Heavy Labor, Urinary Impairment and Incidence of Prolapse.
POP-Q Components
Age (years) BMI (kg/m2) Education (years) History of
heavy labor impairmentUrinary
35 >35 30 >30 9 >9 Yes No Yes No
Aa % prolapse 57.9 77.4 60.4 77.6 72.1 54.5 99.2 38.1 83.1 62.3 % normal 42.1 22.6 39.6 22.4 27.9 45.5 0.8 61.9 16.9 37.7
p-value 0.001 0.003 0.008 0.000 0.001
Ba % prolapse 45.9 69.3 53.2 63.8 63.7 39.4 93.9 23.7 77.5 50.8 % normal 54.1 30.7 46.8 36.2 36.3 60.6 6.1 76.3 22.5 49.2
p-value 0.000 0.028 0.001 0.000 0.000
C % prolapse 71.4 82.5 76.0 78.4 79.9 68.2 95.4 59.7 87.3 73.4
% normal 28.6 17.5 24.0 21.6 20.1 31.8 4.6 40.3 12.7 26.6
p-value 0.031 0.632 0.049 0.000 0.016
D % prolapse 35.3 44.5 39.6 40.5 40.2 39.4 48.1 32.4 49.3 36.7
% normal 64.7 55.5 60.4 59.5 59.8 60.6 51.9 67.6 50.7 63.3
p-value 0.123 0.880 0.908 0.008 0.063
Ap % prolapse 64.7 79.6 70.1 75.0 75.0 63.6 94.7 51.1 84.5 67.8 % normal 35.3 20.4 29.9 25.0 25.0 36.4 5.3 48.9 15.5 32.2
p-value 0.006 0.376 0.073 0.000 0.007
Bp % prolapse 52.6 58.1 51.9 60.3 61.8 63.6 76.3 36.0 67.6 51.3 % normal 47.4 40.9 47.4 39.7 37.7 36.4 23.7 64.0 32.4 48.2
p-value 0.0364 0.287 0.001 0.000 0.053
Complaints in urination showed a significant correlation with the incidence of anterior vaginal wall prolapse in point Aa (p-value=0.001) and Ba (p-value=0.000).
Types of delivery showed no significant correla-tion with the incidence of prolapse (Table 3), ex-cept for the value of point Bp (p-value=0.001).
History of delivering a large baby shows signifi-cant correlation with the incidence of prolapse as measured by the changes in measurement of point Aa, Ba, and Ap (p-value=0.000), point C (p-value= 0.013), and point Bp (p-value=0.022). However, the relationship was not significant for the changes in point D value (p-value=0.565).
Episiotomy also showed a significant association with the incidence of anterior vaginal wall prolapse (Table 3), based on changes in the value of point Aa and Ba (p-value<0.05), but not significant to the incidence of posterior vaginal wall prolapse as seen by the changes in measurement of point Ap and Bp (p-value>0.05).
Furthermore, there is a significant association between use of hormonal contraceptives and the incidence of prolapse based on the changes of POP-Q components (Table 3) where the p-value for changes in point Aa and Ba are 0.021 and 0.016, respectively, as well as for points Ap and Bp (p-value=0.000). However, no significant association can be identified between use of hormonal contra-ceptives and incidence of prolapse as measured by point C (p-value=0.089) and point D (p-value =0.403).
Table 3. Association between Vaginal Delivery, History of Episiotomy, History of Delivering a Large Baby, and Hormonal Contraceptive Use and the Incidence of Pelvic Organ Prolapse
POP-Q Components
Vaginal
Delivery EpisiotomyHistory of History of Deliveringa Large baby Hormonal Contra-ceptive Use
Yes No Yes No Yes No Yes No
Aa % prolapse 80.7 84.1 86.9 72.7 100 66.4 89.6 76.9
% normal 19.3 15.9 13.1 27.3 0 33.6 10.4 23.1
p-value 0.603 0.018 0.000 0.021
Ba % prolapse 71.0 68.2 80.8 58.4 95.9 50.0 80.5 65.0
% normal 29.0 31.8 19.2 41.6 4.1 50.0 19.5 35.0
p-value 0.712 0.001 0.000 0.016
C % prolapse 90.3 97.7 89.9 90.9 96.9 87.7 96.1 89.5
% normal 9.7 2.3 10.1 9.1 3.1 12.3 3.9 10.5
p-value 0.110 0.822 0.013 0.089
D % prolapse 46.6 47.7 39.4 55.8 49.0 45.1 50.6 44.8 % normal 53.4 52.3 60.6 44.2 51.0 54.9 49.4 55.2
p-value 0.893 0.030 0.565 0.403
Ap % prolapse 86.9 77.3 90.9 81.8 96.9 75.4 98.7 77.6
% normal 13.1 22.7 9.1 18.2 3.1 24.6 1.3 22.4
p-value 0.109 0.076 0.000 0.000
Bp % prolapse 71.6 45.5 75.8 66.2 74.5 59.8 81.8 58.0
% normal 28.4 54.5 24.2 33.8 25.5 40.2 18.2 42.0
p-value 0.001 0.165 0.022 0.000
DISCUSSION
There have been numerous studies on the value of POP-Q components recently. In this study, the mea-surements of POP-Q components is performed on women in reproductive age from 18 to 45 years in order to observe the effect of parity and the changes in the value of POP-Q components.
In a population-based study by the Heart and Estrogen/Progestin Replacement Study (HERS) and the Nurses’ Health Study showed that the ef-fect of parity showed very little or even no asso-ciation with the incidence of prolapse in elderly women.7
The results shown in Table 2 indicate a change in the measurement of POP-Q components in the three parity groups. It was showen that points Aa, Ba, C, D, Ap, and Bp were more prolapsed, genital hiatus (GH) became longer, while the perineal body (pb) and total vaginal length (TVL) became shorter. Based on Table 3, GH size were 2.70 cm and 3.33 cm, the size of the pb were 2.60 cm and 3.27 cm, while the size of TVL were 9.06 cm and 8.65 cm in nulliparous and multiparous women, respectively. This was consistent with the study by Ayiek in 2010, who obtained a mean GH size of 2.77 cm and 3.05 cm, pb size of 3.06 cm and 3.01 cm, and TVL size of 8,06 and 7.80 cm in nulliparous and multi-parous women, respectively.8
A study by Trowbridge et al in the Southeastern Michigan area with 394 samples of caucasian and black women aged 35-64 years old, obtained a mean GH size of 3.43 cm, pb of 3.94 cm and TVL of 10.73 cm.9
Furthermore, Tan et al measured an average TVL of 9.4 cm using a sample of 3,247 women.10 Another study by Seo and Kim performed on 713 Korean women aged 18-72 years with parity of 0-6 obtained an average value for point C of -5.0 cm, point D -6.6 cm, and TVL 7.0 cm with an incidence of anterior vaginal wall prolapse of 27.6%, uterine prolapse 2.0%, and posterior vaginal wall prolapse 25.4%. Overall, the incidence of prolapse stage 0 to 4 was 68.3%, 19.9%, 11.2%, 0.6% and 0%, res-pectively.11
Mant et al reported a large cumulative effect of parity on pelvic organ prolapse.12 In a cross sec-tional study from the Women’s Health Initiative, Hendrix et al found the risk of uterine prolapse and prolapse of the anterior vaginal wall to double with
increment of labor from 10% to 21%.13 Based on longitudinal data from the Women’s Health Initia-tive, Handa et al found that the incidence of ante-rior vaginal wall prolapse increased 31% for each increment of parity. A similar relationship was also identified for uterine prolapse and posterior vagi-nal wall prolapse.14
From the results of a research in the UK and Scotland for 20 years, Mant et al concluded that parity showed the strongest relationship with pro-lapse. When compared with nulliparous women, women with one child had 4 times the risk of pro-lapse, while women with two children had 8.4 times the risk.1 Among multiparous women, the risk for prolapse is 11 times than that of nulli-parous women.15
Research by Duong et al discovered that Asian women with high parity had a higher risk of vagi-nal prolapse of the anterior compartment, as was found in European women.16 Landon et al found that in pregnancy, connective tissue of the rectus fascia and the obturator fascia is highly stretched and elongated, but weaker. In some women, these changes can be irreversible and result in perma-nent dysfunction of the pelvic floor muscle. Lien and colleagues have developed a model of pelvic MRI studies to evaluate the interaction of the baby’s head with the pelvic floor muscles, and found that the central part of the pubococcygeus muscle, as part of the pelvic floor muscles, can stretch up to 3.26 times the previous length.17
Unlike the case with longitudinal data from the Women’s Health Initiative, a strong association was shown between increased BMI and posterior vagi-nal wall prolapse (OR=1.75), but not for uterine prolapse and prolapse of the anterior vaginal wall.13 Fornell et al found a significant association between posterior vaginal wall prolapse with obe-sity (BMI>30 kg/m2) compared to normal-weighted women (BMI<25 kg/m2).18
risk factor for urinary and fecal incontinence with odds ratio of 4.13 and 2.06, respectively, but was not a risk factor for pelvic organ prolapse.20
A history of doing heavy labor can lead to in-creased intraabdominal pressure that plays a role in the incidence of prolapse. Hove et al discovered that heavy physical work is one of the independent risk factors for prolapse and is classified as a pro-motional factor with an OR of 1.48.21
Regarding method of delivery, there was no sig-nificant correlation between type of delivery and the incidence of prolapse. This was consistent with the results obtained by MacLennan et al in 2000 where cesarean section and vaginal delivery was both found to be associated with pelvic floor dys-function, whereas no significant difference was identified between elective and emergency cesa-rean section.22 On the contrary, Lukacz et al found that the incidence of pelvic organ prolapse was greater among women who had vaginal delivery than women who had cesarean section (OR=1.82, 95% CI=1.04-3.19).23 A study by Larsson et al also found that cesarean section was associated with a lower risk of pelvic organ prolapse than vaginal de-livery, and the protective effect is more obvious in multiparous women than in primiparous women (OR=0.063 in multiparous women vs OR=0.26 in primiparous women).24
Our findings were not consistent with the theory that an episiotomy can cause perineal damage, es-pecially to the posterior vaginal wall. This was con-gruent with a retrospective study by Cam et al, which concluded that mediolateral episiotomy ap-pears to prevent defects in the anterior vaginal wall.25
A large sample size is one of the strengths of this study. However this study was limited in our at-tempt to analyze the general use of hormonal con-traceptives. The lack of literature on its relation-ship with pelvic organ prolapse caused the limited discussion on this association. Therefore, further studies need to be developed. Furthermore, history of labor in this study relied on memory of the sub-jects, introducing a possibility of recall bias. There-fore, a prospective study needs to be performed.
CONCLUSION
There are significant differences in the measure-ment of POP-Q components among multiparous and primiparous women. The changes of POP-Q
components in multiparous women compared with nulliparous women showed that points Aa, Ba, C, D, Ap and Bp were more prolapsed, genital hiatus (GH) was longer, while the perineal body (pb) and total vaginal length (TVL) was shorter. The inci-dence of pelvic organ prolapse was higher in mul-tiparous than nulliparous women, with significant association with age, BMI, education level, history of heavy labor, history of delivering a large baby and use of hormonal contraceptives.
Since the measurement of POP-Q components requires accuracy, especially for the measurement of point D, there is a need to perform a prospective study in order to assess the changes in the size of POP-Q components in high-risk individuals.
REFERENCES
1. Patel DA. Childbirth and pelvic floor dysfunction: an epide-miologic approach to the assessment of prevention oppor-tunities at delivery. Am J Obstet Gynecol 2006; 195: 23-8. 2. Balmfort J, Robinson D. Pelvic Ogan Prolapse. In:
Evidence-Based Physical Therapy for Pelvic Floor. Philadelphia: El-sevier; 2007: 235-6.
3. Junizaf (editor). Buku Ajar Uroginekologi I. Jakarta: Sub-bagian Uroginekologi Rekonstruksi, Bagian Obstetri dan Gi-nekologi FKUI/RSUPN-CM. 2001: 1-5.
4. Mouritsen L. Classification and evaluation of prolapse. Best Pract Res Clin Obstet Gynaecol 2005; 19(6): 895-911. 5. Petros PEP. The Anatomy and Dynamics of Pelvic Floor
Function and Dysfunction. In: The Female Pelvic Floor: Function, Dysfunction and Management According to the Integral Theory. 2nd ed. Berlin: Springer; 2007: 14-5.
6. Bump RC. The standardization of terminology of female pel-vic organ prolapse and pelpel-vic floor dysfunction. Am J Obstet Gynecol 1999; 175(1): 10-7.
7. Luber KM, Boero S, Choe JY. The demographics of pelvic floor disorders: current observations and future projec-tions. Am J Obstet Gynecol 2001; 184: 1496-501.
8. Ayiek IA. Analisis ukuran komponen POP-Q (genital hiatus, perineal body dan total vaginal length) perempuan multi-para dan nullimulti-para di Makassar. Tesis Program Pascasar-jana. Universtas Hasanuddin; 2003.
9. Trowbridge ER, Fultz NH, Patel DA, et al. Distribution of pelvic organ support in a population based sample of mid-dle aged, community dwelling African American and white women in southeastern Michigan. Am J Obstet Gynecol. 2008; 198(548): 1-6.
10. Tan JS, Lukacz ES, Menefee SA, et al. Determinants of vaginal length. Am J Obstet Gynecol 2006; 195: 1846-50.
11. Seo JT, Kim JM. Pelvic organ support and prevalence by Pel-vic Organ Prolapse-Quantification (POP-Q) in Korean wo-men. J Urol 2006; 175(5): 1769-72.
13. Hendrix SL, Clark A, Nygaard I, et al. Pelvic organ prolapse in the Women’s Health Initiative: gravity and gravidity. Am J Obstet Gynecol 2002; 186: 1160-6.
14. Handa VL, Blomquist JL, McDermott KC, et al. Pelvic floor disorders after vaginal birth. Am J Obstet Gynecol 2012; 119: 233-9.
15. Siddighi S, Hardesty JS. (eds.) Urogynecology and Female Pelvic Reconstructive Surgery: Just the Facts. 1st ed. New
York: McGraw-Hill; 2006.
16. Duong TH, Korn A. Predictors of advanced pelvic organ pro-lapse in Asian women. J Reprod Med 2009; 54(8): 488-92. 17. Baessler K, Schuessler B. The Effect of Pregnancy and Child-birth on the Pelvic Floor; in Pelvic Floor Re-Education. El-sevier Saunders: Philadelphia. 2008: 36-45.
18. Fornell EU, Wingren G, Kjolhede P. Factors associated with pelvic floor dysfunction with emphasis on urinary and fecal incontinence and genital prolapse: an epidemiological stu-dy. Acta Obstet Gynecol Scand 2004; 83: 383-9.
19. Miedel A, Tegerstedt G, Maehle-Schmidt M, et al. Nonobste-tric risk factors for symptomatic pelvic organ prolapse. Am J Obstet Gynecol 2009; 113(5): 1089-96.
20. Chen CC, Gatmaitan P, Koepp S, et al. Obesity is associated with increased prevalence and severity of pelvic floor dis-orders in women considering bariatric surgery. Surg Obes Relat Dis 2009; 5: 411-5.
21. Woodman PJ, Swift SE, O’Boyle Al, et al. Prevalence of severe pelvic organ prolapse in relation to job description and sosioeconomic status: a multicentre cross-sectional study. Int Urogynecol J Pelvic Floor Disfunct 2006; 17: 340-5. 22. MacLennan AH. The prevalence of pelvic floor disorders
and their relationship to gender, age, parity and mode of delivery. Br J Obstet Gynaecol 2000; 107(12): 1460-70 23. Lukacz ES, Lawrence JM, Contreras R, et al. Parity, mode of
delivery, and pelvic floor disorders. Am J Obstet Gynecol 2006; 107: 1253-60.
24. Larsson C, Kallen K, Andolf E, et al. Cesarean section and risk of pelvic organ prolapse: a nested case-control study. Am J Obstet Gynecol 2009; 200(243): 1-4.