Purchased by flex U. S. Drearkneat of Aericultere
FOP Official Use
Estimating Soil Moisture Depletion from Climate,
Crop and Soil Data
M. E. Jensen, J. L. Wright, and
B.
J. PrattFELLOW ASAE
TREMENDOUS international scien-1 tific effort has been expended on evaporation and transpiration problems during the past decade as evidenced by hundreds of technical publications, and numerous conferences. 'However, use of this scientific achievement by agriculturalists, project planners and operators of irrigation farms has lagged behind technological advancements. The lag in adaptation of new tech-nology by the user can be partly at-tributed to a lack of time, technical training and experience in meteorology, physics and agronomy.
One of the greatest potential appli-cations of evapotranspiration technol-ogy is in the management of irrigation farms. Recent studies in the Western States indicate that the timing of ir-rigations and the amount of water ap-plied have changed very little during the past 25 years. Irrigation schedul-ing is a decision-makschedul-ing process re-peated many times each year, involv-ing when to irrigate and how much water to apply. Both criteria affect the quantity and quality of the crop. Decisions delayed a week, or even a few days, may be costly. Measurements are required to determine when the soil moisture reservoir is full, half-full, or nearly empty. Furthermore, the de-pletion of soil moisture is complicated because it is determined by meteoro-logical conditions, the growing crop and the unsaturated hydraulic charac-teristics of the soil. Instruments are available to help determine the soil moisture status, such as tensiometers, soil moisture blocks and the more com-plicated neutron meter, but these are not used extensively. For these and other reasons, the modern farm man-ager is generally willing to hire a ser-vice that will provide the necessary data and guidelines to assist him in making better and inure profitable de-cisions.
To satisfy such requirements, we de-veloped user-oriented methodology to enable districts, service companies, or mutuals to routinely provide additional information to the irrigation farm
man-Paper No. 69-041 was presented et the 1S'in-ter Meeting of the American Society of Agricul-tural Engineers at Chicago, 111., Detenibr 1969, on a program arranged by the Structures and Environment Division.
The authors are: M. E. JENSEN, Director, J. L. WRIGHT, Research Soil Scientist. and B. J. PRATT, Mathematician, Snake River Con-servation Research Center, Northwest Branch, ARS, USDA. Kimberly, Idaho,
ager. The methodology utilizes scien-tific advancements and removes much of the guesswork in irrigation schedul-ing. The procedure is based on esti-mating soil moisture depletion from climate, soil and crop data. Rational, but simple procedures are used to ob-tain the necessary information.
One reason for maintaining simplicity is that a service providing decision-making data must be continuous. The risk of missing data increases with the complexity of instrumentation. Al-though the procedures emphasize irri-gation applications, they also have po-tential application to nonirrigated agri-culture. Some aspects of the general operating procedures have been pro-vided in previous publications Jensen, 1989 and 1970).
The concept of scheduling irrigations using climatic data is not new (Pen-man, 1952; Bayer, 1954; Pierce, 1960; Pruitt et al., 1955; Rickard, 1957; van Bevel, 1960 and 1952). However, this method had not been adopted for gen-eral practical use or tested extensively previously. The mathematical model and the computer program which we have developed for this purpose and have tested for several seasons are de-scribed in this paper.
REQUIREMENTS OF THE PROCEDURE
The primary requirements of the system that were considered and adopted are briefly described below:
1 The procedure is "user" oriented, not "research" oriented.
2 The computations are regular and complete, i.e. estimates of soil moisture depletion for each field for each day of the growing season are provided.
3 Estimates of daily depletions of soil moisture within et.-10 percent or possibly ±15 percent, which usually results in better accuracy over 10- to 20-day periods, are adequate. As a re-sult, the timing of an irrigation will be within ±1 day with 10-day frequencies or ±2 to 3 days for 20- to 30-day fre-quencies.
4 If service groups are to provide these data to the agricultural user to-day, they must use standard meteoro-logical data as recorded by more com-plete Weather Bureau Stations, or use data that can be obtained easily with reliable instruments.
If complex mic•ometeorologicaI measurements are required, the general
procedure loses much of its utility to an inexperienced service group. As ex-perience and demands for the service increase the techniques can be refined. In general, simple rational equations that require a minimum number of
as-sumptions were 'preferred over more
complicated relationships. Equations that gave integrated daily values from daily inputs were used instead of rate equations that require precise, con-tinuous gradient measurements.
5 Feedback is essential to the satis-factory operation of the system. This feedback consists of rainfall for each field, the dates and, if available, the amounts of irrigation water. Periodic monitoring of the soil moisture status as compared to the predicted status is highly desirable, but not essential. In practice, monitoring enables adjust-ments for inadequate irrigations, un-usually rapid or slow crop develop-ment, disease or insect damage, and controlling parameters.
COMPONENTS OF THE MATHEMATICAL MODEL
Soil Moisture Depletion
For convenience, the major depend-ent variable in the model is soil mois-ture depletion. The major components affecting soil moisture depletion are re-lated as follows:
n
D X (E, — R e — + W4 ) i= 1
[1] where D = the depletion of soil mois-ture (after a thorough irrigation q
0); Et = evapotranspiration; Re =
rainfall (excluding runoff); I = irriga-tion water applied; W,2 = the drairege from the root- zone; and i = 1 for E Le
first day after a thorough irrigation when D = 0. The terms to the right of the equal sign are daily totals ex-pressed in inches in the present com-puter program of this model.
Potential Evapotranspiration
Evapotranspiration accounts for most of the depletion. The procedure first estimates the daily potential evapora-tive flux, E* (the evaporaevapora-tive flux from a well-watered reference crop like al-falfa with 12 to 18 in. of top growth). Estimates of potential evapotranspira-tion by the energy balance approach
would he ideal because of its proven reliability.
V=Rn —G—A [2] where E° = evaporative flux (latent heat); B n net radiation; G = heat flux to or from the soil; and A = sensi-ble heat flux to or from the air in cal per sq cm per day. However, this method is not practical at this time even though instruments are available for measuring R n and G on a reference field. These instruments require peri-odic calibration and maintenance by technicians trained in meteorology and meteorological instrumentation. Fur-thermore, even though techniques for determining A directly were developed (Fuchs et. al., (1969), they require complex instrumentation and measure-ment of • the "effective" surface tem-perature of the crop.
Therefore, equations using available meteorological data were needed. A combination equation using daily val-ues of a minimum number of meteoro-logical parameters provides adequate estimates of E • for this purpose. The basic meteorological data required con-sist of: (a) daily maximum and mini-mum air temperatures; (b) daily solar radiation; (c) average dew point tem-perature or dew point temtem-perature near 8 a.m.; and (d) daily wind run at a known height, preferably in an open area over a surface that does not change greatly in roughness or dis-placement height during the growing season. The most common combina-tion equacombina-tion is that presented by Pen-man (1963) and is recommended where adequate data are available.
G) + 7
A + y A+ y (15.36) (1.0 + 0.01W) (e, ed )
[ 3 ]
where q is the slope of the saturation vapor pressure-temperature curve (de/ dT), y is the psychrometric constant, e„ is the mean saturation vapor pres-sure in mb (mean at maximum and minimum daily air temperature), ea is the saturation vapor pressure at mean dew point temperature in mb. The pa-rameters Ai (q + y) and 7 /(q + y) are mean air temperature weighing factors whose sum is 1.0 (10, 14), W
is total daily wind run in miles, R. is daily net radiation in cal per sq cm, and G is daily soil heat flux in cal per sq cm.
Daily net radiation estimates are re-quired when the combination equation
is used. Since percent of sunshine or
degree of cloud cover normally used to estimate the net longwave radiation generally are not available, procedures were developed for estimating net radi-ation using observed solar radiradi-ation for a day (Re ) relative to solar radiation
that would normally be expected on that day if there were no clouds (YU. Cloudless day values can be obtained from estimates by Fritz (1949) or by plotting clear day values to obtain an envelop curve through the high points. Net radiation in cal per sq cm was estimated as follows:
= (1 — a) R, . . [4] where (1 — rx)B, represents the net shortwave radiation received by a green crop with full cover, a is the mean daily shortwave reflectance or albedo and Rli is the net outgoing long wave radiation. Since the reflectance coeffi-cients for most green crops with full cover are about 0.22 to 0.25, 0.23 was used in the program. Rb was estimated
as follows:
Rb (aR„/Ren + b)Rbo . [5] where Rbo is the net outgoing long wave radiation in cal per sq cm on a clear day and estimated as follows:
Rbo = [0.98 — (0.66 + 0.044/ed )] 4
2
T1,4
(11.71 x 10-s) T2A • [ 6 ] where ed is the saturation vapor pres-sure at mean dew point temperature
in mb; 11.71 X 10- 8 is the
Stefan-Boltz-mann constant in cal per sq cm per day deg K-4 ; and T2,, and T1A are the maximum and minimum daily air tem-peratures, respectively, in deg K.
Originally the constants a and b in equation [5] were derived using data from Davis, California, obtained in personal communication from Pruitt (1.35 and —0.35). More recent evalu-ations in Idaho indicated that under arid conditions where the nights fre-quently are clear, the values are more like 1.2 and —0.2 for a and b, re-spectively. As a first, one can assume a= 1.0 and b = 0.
The constants for the Brunt portion of equation [6] are similar to those of Goss and Brooks (1956), who obtained values of 0.66 and 0.040 in California, and Fitzpatrick and Stern (1965), who obtained constants of 0.65 and 0.049 in Australia. These coefficients are ex-pected to vary under different climatic regimes, and regional coefficients should be used if available. The coefficients for the Brunt equation presented by Penman generally are not applicable to arid conditions. Use of the Penman constants in the Brunt equation for arid conditions overestimates the net outgoing radiation under very low hu-midities as previously reported by Fitz-patrick and Stern (1965).
A simple empirical equation for daily soil heat flux in cal per sq cm based on changes in air temperature is cur-rently being used [G = (average air temperature minus the average air tem-perature for the three previous days in deg F) X 5]. Where day-to-day
temperatures do not change greatly and day-to-day radiation is similar, soil heat flux is relatively small during the summer months and can be neglected. The combination equation with the aerodynamic terms proposed by van Bevel (1952) was also tested using daily meteorological data. The aerodynamic portion of this equation (11.505W/ iln (z/zo ) 2 in place of (15.36) (1.0 + 0.01W) in equation [3]) is appli-cable strictly to adiabatic conditions, which generally do not exist for long periods of time under arid conditions. it tends to be more sensitive to high wind, high vapor pressure deficit con-ditions than the Penman equation and generally overestimates evapotranspira-tion if one uses a zo value greater than about 1 cm in windy areas.
Rosenberg (1969) also found that this equation underestimated evapo-transpiration on calm days. We have found that we need to calibrate the •
van Bevel version of the combination equation by varying the zo value. Sellers (1984) also indicated that a transfer coefficient based on the simple logari-thmetic profile seemed to be too large, leading to unreasonably high evapo-transpiration rates, especially from tall crops. Many transfer functions relating windspeed to the diffusion coefficient
have been derived over water surfaces (Sellers, 1964).
Slatyer and McIlroy indicated that the aerodynamic term should be cali-brated (1961). A suitable empirical relationship similar to that proposed by Penman, but derived for an aerodynam-ically rough crop like alfalfa under a wide range of arid or semiarid condi-tions, can improve the reliability of the combination equation. One reason why the aerodynamic term of the com-bination equation is more critical undet arid conditions, is that advection ac-counts for a large portion of the
re-quired energy in the summer months.
Under these conditions, the convective term must be larger than the radiation term contrary to the general concept that the radiation term is rarely smaller than the convective term. In contrast, the latter statement is generally true in the more humid areas. A thorough description of the combination equa-tion, and its development by Penman, Ferguson, and Budyko is presented by Tanner (1968).
Although the Penman transfer coef-ficient was used in these studies, under large, high advective conditions in mid-summer it also underestimated E. Sim-ilar results were obtained by Rosen-berg (1969).
E° CT (T — Tx) 113 • • • [ 7 ] where CT
=
a temperature coefficient per deg F, T = mean daily air tem-perature, F; CT 1/ (C1 + 13CH),where Cr = 68 — 3.6 Eft/1000; Eft
= elevation above sea level in ft;
C
H = 50/ (e2 — e l ), where e. = satura-tion vapor pressure in mb at mean maximum air temperature for the warmest month and e l = saturation vapor pressure at mean minimum air temperature for the same month; T x = 27.5 — 0.25(e2 — e t ) E,t/1000; and R, = daily solar radiation in cal per sq cm.Estimates of daily potential evapora-tive flux, E°, can be converted to depth equivalent (E,p ) in inches using 585 cal per g as the latent heat of vaporiza-tion, (E 4, = 0.000673 E s ).
Evapotranspiration
Evapotranspiration for a given agri-cultural crop (E t ) was estimated from potential evapotranspiration (E 1 ) as follows:
E t = E t, [8] where IC is a dimensionless coefficient Iike that proposed by van Wijk and de Vries (1954). It represents the combined effects of the resistance of water movement from the soil to the various evaporating surfaces and the resistance to the diffusion of water vapor from the surfaces to the atmos-phere, and the relative amount of radi-ant energy available as compared to the reference crop (Jensen, 1968).
Examples of the influence of growth stage on crop coefficients where soil water is not limiting have been pre-sented for grain sorghum by Jensen (1969, 1970), and for corn by Den-mead and Shaw (1959). Shaw (1966) also presented ratios of evapotranspira-tion to evaporaevapotranspira-tion from an open pan for corn and soybeans, along with the leaf area index for soybeans. In this case the type of leaf was greatly dif-ferent from one crop to the other, but the crop curves and their development were similar. These have also been
used for estimating soil moisture. Other researchers are developing similar re-lationships for other crops. Pruitt, et al., for example, recently presented de-tailed curves relating evapotranspira-tion from beans, sugarbeets and toma-toes to E t from ryegrass.
The crop coefficient is also influenced by the wetness of the surface soil. In our computer model, the crop coeffi-cient was estimated as:
Ke =Keo Ka +K, [ 9 ] where IC, = the mean crop coefficient based on experimental data where soil moisture was not limiting and normal irrigation stands were used; K a the relative coefficient related to available
soil moisture. In this program, K a was assumed to be proportional to the loga-rithm of the percentage of remaining available soil moisture (AM): Ka ---in (AM ± 1)/In 101; K, is the ---increase in the coefficient when the soil surface is wetted by irrigation or rainfall. The maximum of IColCa K, normally will not exceed 1.0 for most crops. The value of K, could be expected to vary as follows:
K, ( ) e —At , Kr > K, / [10] where t = days after the rain or irri-gation, X represents the combined ef-fects of evaporative demand, soil char-acteristics, etc., and K,, represents the average IC value at the time the rain occurred. To make the program•opera-tional initially, the following approxi-mate values were used for K, for the first, second and third day after a rain or irrigation, respectively: (0.9 — 0.8; (0.9 — K,)0.5; (0.9 — Rainfall-Irrigation
Daily rainfall excluding runoff is en-tered for each field. If runoff occurred, the recorded rainfall was arbitrarily re-duced based on local experience and
judgement. Estimated increases in
evaporation caused by rainfall wetting the soil surface cannot exceed the rain-fall.
When an adequate amount of irriga-tion water was applied, the soil mois-ture depletion was assumed to be zero on the day of irrigation. With moving sprinkler systems that apply a limited amount of water very uniformly, the amount applied was treated as rainfall. Drainage
An adjustment for continued drain-age was not built into the present computer model. Water applications in excess of estimated soil moisture de-pletion was assumed to drain from the soil.
Irrigation Estimates
The number of days before the next irrigation was estimated from the re-maining soil moisture that could safely be depleted and the expected aver-age E,
N — E t
N = 0 for D > Do
where N the estimated number of days until another irrigation is needed if additional rainfall is not received, Do is the maximum depletion of soil mois-ture allowed for the present stage of growth, D is the estimated depletion of soil moisture, and Et = the mean rate of E t for the three previous and three forecast days. Mean
evapotrans-piration for the crop involved at that location and time could be used if available.
The amount of water required for the next irrigation at the point of water measurement (W1 ) was estimated as follows:
Wr — D
Ea D' > D . . . . [12a]
q > Do [12b] E
where D is the estimated depletion of soil moisture and E is the attainable irrigation efficiency with the system involved. When necessary, IV / can be adjusted for the leaching requirements. A brief description of the program steps, the FORTRAN program, sample calculations, and operational guides can be obtained on request from the authors.
DIscussiorr Meteorological Data
Irrigation districts, mutuals or ser-vice companies can be expected to equip and maintain a weather station with routine instruments if an irrigated area contains from 10,000 to 25,000 irrigated areas. If data from existing weather stations must be used, each station may represent about 0.25 to 1.0 million acres. Rainfall must be a field-by-field or farm-by-farm variable where local thunderstorms prevail. Crop Coefficients
Various models of the transport re-sistance to heat and vapor flux between the surface and some height are sum-marized by Tanner (196S). Similarly, various internal resistances such as those encountered with mulched soil, bare soil, plant leaves and canopies are discussed by Tanner. From an energy balance viewpoint, the crop coefficient represents the relative heat energy con-verted to latent heat. The major energy terms of the soil-plant-air continuum are:
R n ± A Ke
R oo + Go + A, . [13]
The subscript o designates concurrent values for the reference crop in the immediate vicinity (in this case al-falfa). The terms are positive for in-put to the crop-air zone and negative for outflow. The sensible heat flux term (A) is the most difficult to deter-mine or predict in estimating the crop coefficient. The terms given in equa-tion [13] can be rewritten using the Bowen ratio (/).
1 + flo R o + G
K, — . . . [14] 1 + 13 Roo ± Go
11001 crops are grown under
irriga-tion and at similar plant densities, the crop coefficient tends to be very simi-lar from one area to the next for sugar-beets grown in Twin Falls, Idaho; Bushland, Texas; and Phoenix, Arizona (Jensen and Erie, 1971). The maxi-mum value of the crop coefficient will probably be less than 1.0 for the same crop grown under dryland conditions with very low planting rates and wide row spacings.
To calculate the relative effects of widely spaced dry]and row crops with low planting rates, one must consider the relative leaf area and the leaf re-sistances along with some factor ac-counting for the increased resistance
within the soil, since the root system also would probably be less dense, and the degree of exposed soil is greater. Existing experimental data probably could be used to approximate the co-efficient for use in decision-making computations.
With irrigated crops and experi-mentally derived crop coefficients un-der conditions where soil moisture is not limiting, adjustments are needed for decreasing soil moisture with most crops and soils. However, evidence in-dicates that for a dense system and low evaporative demands, there may be no appreciable reduction in the rate at which soil moisture is with-drawn as compared to a less dense root
system and high evaporative demand, such as indicated by Shaw and Laing
(1986).
The number of studies relating evap-otranspiration of crops to various evapo-rative pans and other evaporation de-vices are too numerous to mention. There has been an increase in estimates of soil moisture for planning purposes using computed values of potential E t and coefficients for a crop Maier and Robertson, 1968). In this case, the coefficients take into account the mois-ture tension characteristics of the soil. Others consider the apparent diffusion resistance of crops and its relation to degree of cover, Rilterna (1959). Stud-ies such as these increase the general technology of soil moisture manage-ment.
Drainage
The drainage rate from a soil that has been irrigated when evapotranspira-tion is zero generally can be related to time by the expression proposed by Ogata and Richards (1957).
IV Wor m [15] where NV, is the water content when t 1, and m is a constant derived experimentally for a given soil.
When evapotranspiration is not zero, the rate of drainage at a given water content will be less than this value due
to water withdrawal by the crop. Dur-ing the first few days after an irriga-tion, the hydraulic conductivities are large enough that the hydraulic gradi-ent is not affected greatly by the water withdrawal, and a correction similar to that proposed by Wilcox (1960) could be used.
Drainage could be approximated by estimating the evapotranspiration for a given day and subtracting it from the water content first, and then use this value of W to estimate the drainage. This general technique is currently be-ing tested (personal communication with D. E. Miller) and the subroutine will be available for optional use dur-ing the 1971 crop season. However, if the amount of water applied is not known, this addition is not needed.
Gardner (1988) presented a general solution of a similar equation which gives the amount of water transpired by the plant, and would have other-wise been lost from the soil profile by drainage. This solution could also be adapted to this problem.
TESTING THE MATHEMATICAL, MODEL AND COMPUTER PROGRAM
Net Radiation Estimates
Meteorological data collected by a U.S. Weather Bureau Agricultural Sta-tion were used for these estimates. The station is located about one-half mile south of the alfalfa field irrigated only once in the spring and about one-half mile north of the fields in which the other measurements were made. The meteorological data included daily max-imum and minmax-imum air temperatures, dew point temperature at 8 a.m., daily solar radiation and daily wind run at a height of 12 ft. The windspeed was adjusted to a height of 2 m for use in the Penman equation by assuming a logarithmic profile with a z„ value of 1 cm.
Comparisons of estimated daily net radiation vs net radiation measured with a Fritchen net radiometer, an electronic integrator and a data logging system for 1967 and for 1968 showed that most of the daily estimates were within =LAD percent except in 1968 during the heavy cloud cover in Aug-ust.
The coefficients derived for Davis, California were used in equation [5]. If the Idaho coefficients had been used, the estimates for the heavy cloud pe-riod would have been improved. These data indicated that under semiarid con-ditions with many cloudless days or only partly cloudy days, the simplified equation for estimating net radiation and adjusting for net long wave radia-tion without using the percentage of sunshine of cloud cover appears to be satisfactory.
Estimates of Daily Potential Evapotranspiration
Estimates of daily evapotranspiration for sugarbeets in 1968, assumin ,, a crop coefficient of 1.0 and using the Penman equation, were compared with evapotranspiration determined by the Bowen ratio technique. The estimates with the Penman equation were very good but they tended to be a little low when the evaporative demand was high. The ratio of the sum of the esti-mated values to the sum of the energy balance values was 1.00. Similar esti-mates were obtained with the van Ravel combination equation with a z.„, value of 0.5 cm. In this case, the ratio was 1.02. When a z,, of 1 cm was used, the ratio was 1.14. When a z.„ of 5 cm was used, which might be expected for crops such as these, the estimate was much too high and the ratio was 1.65.
Similar estimates were obtained in 1968 using alfalfa and a weighing lysirneter. Most of these values were obtained late in September when ad-vective energy was very high. In this case, the Penman estimates generally underestimated E t.„, and the ratio was 0.91. Estimates with the van Bavel equation with a z c, of 1.0 were better. Estimates for September were more accurate using a z,, of 1 cm, but many of the other estimates were too high; the ratio was 1.05. With a z,, of 5 cm, the ratio was 1.52.
Even though scatter is apparent in the daily values, a summation of 5- to 10-day means shows significant im-provement. Generally, estimates for 5-day periods were within 5 to 10 per-cent of the measured values in the sum-mer months for the three equations used, except when using a zr, value greater than 1 cm in the van Ravel equation.
Soil Moisture Depletion Estimates In general, one would expect cumula-tive estimates of evapotranspiration to he more accurate if the errors are ran-dom. Evaluations were made using small plots in 1987 and 1968, and tensiometers were used as checks in fields in 1988. Measurements made in 1969 were compared with the com-puter output in which the Penman equation was used to estimate poten-tial evapotranspiration. Soil moisture depletion was recorded by a precise weighing lysimeter with a surface area of 6 x 6 ft and a depth of 4 ft, lo-cated in a field of alfalfa about 500 ft sq. The estimates and the measured depletion are nresented in Fig. 1.
0
'—Apparent drainage 0
0 0
q Estimated depietion
Measured deotrion
Assumed limit 0
...I, I . .
MAY JUNE JULY AUG
2
1
0 1
1 et
O. 10
12
14
VI
a 16
18 0
20 22 4
6
SEPT iA
O ALFALFA- 6 IRRIGATIONS, 1969
A
z
0 2
3
- O-W
q 4-
0
5-D
6
7 " — Ly iMeter dote
Es holed depletion N 8- Heir
Cut
• P
JO 20
MAY
May Cut
I • I .
10 20
JULY
• P .
I0 20
JUNE 10 20
10 2q
AUG SEPT
FIG. 1 Estimated versus measured cumulative evapotranspira-tion with water not limiting, Kimberly, Idaho, 1969.
ALFALFA — IRRIGATED. MAY 9—/O. 1969
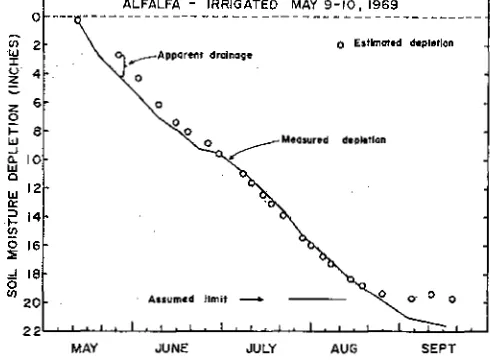
FIG. 2 Estimated versus cumulative soil moisture depletion with decreasing soil moisture, Kimberly, Idaho, 1969. (Measured de-pletion by EL A. Kohl.)
shown by the triangular points. There were several rains in midsummer and two cutting dates. Cutting effects are taken into account in this manner: Immediately following cuttings, the crop coefficient is reduced from 1.0 to 0.5. It is then increased linearly to 1.0 over a period of 20 days.
The only period in which a signifi-cant deviation occurred was from the middle of June to the middle of July. The computer program underestimated the depletion of soil moisture, 5.4 in. vs 6.7. Since the total amount that can be depleted was near 12 in., this un-derestimate would not significantly af-fect crop production. However, esti-mated evapotranspiration using the Penman equation for this period in 1969 was only 85 percent of the 5-year average because of climatic conditions. If the van Bavel aerodynamic term with z. = 1.0 cm had been used for this period, excellent agreement would have been obtained between the esti-mated and measured depletion.
A comparison of estimates for alfalfa that was irrigated thoroughly on May 9 and May 10 and then was not irri-gated for the balance of the season is shown in Fig. 2. Measurements were made using two access tubes and a neutron probe. The computer program utilizes a limit on available soil moisture, which was assumed to he 19.7 in., but the limit was underestimated about 2 in. The deviation early in the season can largely be attributed to drainage following the heavy irrigation, since the first reading began the day after
irrigation.
-These data indicate that the adjust-ment for decreasing soil moisture for a deep rooted crop with full cover like alfalfa appears sufficient. The results obtained on alfalfa that was not irri-gated for a 4-month period also in-dicate that a program such as this may have utility under dryIand conditions.
Row crop coefficients may need to be modified at maximum cover for stand density. For example, in the Great Plains it is not uncommon to find sorghum planted at a low seeding rate under dryland conditions at a spacing of 40 to 80 in. Under these situations, a high proportion of soil is exposed, the den-sity of the root system is less, and the leaf area index may be very low. Stud-ies are underway testing a similar pro-gram using dryland data (personal communication with Dale Heermann). The first version of this model was tested on about 50 fields in Idaho and 60 fields near Phoenix, Arizona in 1968 using equation
[7] .
In 1969, this program was tested on 43 fields and about 15 crops in Idaho and the same 60 fields in Arizona (Franzoy, 1969) using equation [3]. The A&B Irriga-tion District near Rupert, Idaho, in cooperation with the Bureau of Rec-lamation, scheduled 86 fields of several crops in 1989 and is expected to ex-pand the service to 200-300 fields in 1970.Valid direct benefits from schedul-ing are difficult to obtain. Fields or portions of fields used as checks pro-vide some indications. However, the irrigation schedules provided influence the farmer's irrigation decisions so that such checks are not completely inde-pendent. The farmer's opinion of the beneficial effects of scheduling and his desire to continue or expand this ser-vice have been the primary criteria used to evaluate the effectiveness and value of this program.
Service companies are considering adding this type of service to their nor-mal agricultural services now provided. Similar services apparently are being provided to a limited degree in Eng-land and in France. If a service such as this is provided in semiarid areas, or where rainfall plays a greater role, then longer range climatic forecasts,
including estimates of rainfall, may be required. Trained personnel are im-portant. The program is only a tool that is valuable in the hands of an expert. In areas where climatic con-ditions do not vary greatly from one year to the next, and where average values of measured evapotranspiration are available, they might be used in the forecast of E t instead of the cur. rent daily computations.
The computer program served as an excellent educational tool for the ir-rigation farm manager, since it in-creased his understanding of the soil moisture reservoir and its management.
SUMMARY
Net radiation can be estimated in arid areas using appropriate constants, maximum and minimum air tempera-tures, dew point temperature, observed solar radiation and clear day solar radi-ation. The coefficients proposed by
Penman for estimating net radiation do not appear to be applicable in arid areas of the U.S. or in Australia (Fitz-patrick and Stern, 1965).
A combination equation and daily meteorological data, in eluding daily wind run, results in daily estimates of evapotranspiration appropriate for scheduling irrigations. The estimates ob-tained with Penman's aerodynamic ver-sion were not as sensitive to wind effects as van Bavel's version. If used with z o as a calibration term under southern Idaho conditions, zo in van Bavel's equation should be 0.75 cm. Over long-time periods, Penman's version gives identical results to van Bavel's version when using a zo value of 0.5 cm in southern Idaho.
the summer months if more complete meterological data are not available.
During the past two years, we have demonstrated that irrigations can be scheduled using these techniques and computer facilities now are available to anyone with a telephone in the United States. Such irrigation scheduling is practical and economical even though further refinement is needed. The potential economic re-turns can exceed the costs of such a service by severalfold, depending on the starting point. The interest and enthusiasm for a service that would provide data of this type to the modern farmer for his decision-making proc-esses are very high because it has been needed for many years.
With increasing farming costs and decreasing water supplies, the modern farmer will demand a service such as this to remain solvent in this highly competitive field of irrigation agricul-ture. Farmers who depend only on rainfall will be demanding information such as this to make decisions as to the need for fertilizer or additional amounts of fertilizer if it appears that the soil moisture conditions are adequate to sustain higher yields. There are other potential uses of this information in planning and management.
References
1 Baler, W. and Robertson, G, W. The per-formance of soil moisture estimates as com-pared with the direct use of climatological data
for estimating crop yields. Agr. Meteorol. 5:17-31. 1968.
2 Bayer, L. D. The meteorological approach to irrigation control. Hawaiian Planter's Record, 54:291-298, 1954.
3 Denmead, Q. T. and Shaw, R, H. Evapo-transpiration in relation to the development of the corn crop. Agron. J. 51:725-726, 1959.
4 Fitzpatrick, E. A. and Stern, W. R. Corn-ponents of the radiation balance of irrigated plots in a dry monsoonal environment. J. Ap-plied Meteorol. 4:0)649-660, 1965,
5 Fransoy, C. E, Predicting irrigations from climatic data and soil parameters. ASAE Paper No. 69-752, ASA.E, St. Joseph, Mich. 49085, 1969.
8 Fritz, S. Solar radiation during cloudless days. Heating and Ventilating, 1949.
7 Fuchs, M., Tanner, C. B., Turteli, G. W. and Mack, T. A. Evaporation from drying sur-faces by the combination method. Agron. J. 61; 22-26, 1989.
8 Gardner, W. R. Availability and measure-ment of soil water. Water Deficits and Plant Growth, T. T. Kozlowski (Ed.), Academic Press, N.Y., Vol. 1:107-135, 1988.
9 Goss, J. R. and Brooks, F. A. Constants for empirical expressions for downcorning at-mospheric radiation under cloudless skies. J. Meteorol, 13:(5)482-488, 1956.
10 Jensen, M. E, Empirical methods of esti-mating or predicting evapotranspiration using radiation. Proc. Evapotranspiration and Its Role in Water Resources . Management, pp. 49-53, 64, ASAE, St. Joseph, Mich. 49085, 1966.
11 Jensen, M. E. Water consumption by aaicultural plants. Water Deficits and Plant Growth, T. T. Kozlowski (Ed.), Academic Press, N.Y., Vol II:1-22, 1988.
12 Jensen, M. E. Scheduling irrigations using computers. J. Soil and Water Conserv. 24:(8) 1934195. 1969.
13 Jensen, M. E. and Erie, I.. J. Irrigation and water management. Sugarbeet Production:
Principles and Practices, chapter 8, The Iowa
State University Press, Ames, Iowa, 1971. •4 Jensen, M. Robb, D. C. and Franzoy, C. E. Scheduling irrigations using climate-crop-soil data. Am. Soc. Civil Eng., J. Irrig. and Drain. Div. 96;(IR1)25-38, 1970.
15 Ogata, G. and Richards, L. A. Water content changes following irrigation of bare-field soil that is protected from evaporation. Soil Sri. Soc. Am. Proc- 21:355-356, 1957.
18 Penman, H. L. The physical basis of ir-rigation control. Proc. Intl. Hort. Congr, 13: 913-924, 1932.
17 Penman, H. L. Vegetation and Hydrology. Tech, Communication No. 53, Commonwealth
Bureau of Soils, Harpenden, England, 125 p., 1963.
18 Pierce, L. T. A practical method of de-termining evapotranspiration from temperature and rainfall. Transactions of -the ASAE 3(1):77-81, 1980.
19 Pruitt, W. O. and Jensen, M. C. Deter-mining when to irrigate, Agricultural Engineer-ing 38:389-393, 1955.
20 Pruitt, W. O., Lourence, F. J. and van Gottingen, J. Water use by crops as affected by climate and plant factors. California Agricul-ture (in press).
21 Rickard, D. S. A comparison between measured and calculated soil moisture deficit. New Zealand J. of Sci. and Tech, 38:110)1081-1090, 1957.
22 Rijtema, P. E. Calculation methods of potential evapotranspiration. Tech. Bul, 7, In-stitute for Land and Water Management
Re-search, Netherlands, 10 p, 1959,
23 Rosenburg, N. J. Seasonal Nitwits in evapotranspiration by irrigated alfalfa in the Central Great Plains. Agron. j. 61:16)879-886, 1989.
24 Sellers, W. D. Potential evapotranspira-tion In and regions. J. Appl. Meteorol, 3:98-104, 1964,
2.5 Shaw, R. H. Climatological studies. Final Report, Contract Cwb-11160, Iowa State Univ., Agron. Dept., Ames, Iowa, 1967.
26. Shaw, R. H. and Laing, D. R. Moisture stress and plant response. Plant Environment and Efficient Water 'Use, Am. Soc. Agron. 73-94, 1968.
27 Slatyer, R. O. and McIlroy, I. C. Practi-cal microclimatology. CSIRO, Melbourne. 310 pp., 1961.
28 Tanner, C, B. Evaporation of water from plants and soil. Water Deficits and Plant Growth, T. T. Kozlowski (Ed.), Academic Press, N.Y., Vol. 1:73-106, 1988.
29 van Ravel, C. H. Use of climatic data in guiding water management on the farm. Water and Agriculture. Am. Assoc. for the Adv. of Sci. pp. 89-100, 1960.
30 van Savo], C. H. Potential evaporation: the combination concept and its experimental verification. Water Resources Res, 2:455-467, 1986.
31 van Pavel, C. H. and T. V. Wilson. Evapotranspiration estimates as criteria for de-termining time of irrigation. Apieciltural Engi-neering 33;17)417-418 420, 1N2.
32 van Wijk, W. 11. and de Vries, D. A. Evapotranspiration. Neth, 3. Av. Sci. 2:105419, 1954.
33 Wilcox, 3. C. Rate of drainage following an irrigation, II. Effects on determination of rate of consumptive use. Can. J. Soil Sci. 40:15-27, 1960.