VOLUME 40, ARTICLE 49, PAGES 1441
-
1454
PUBLISHED 4 JUNE 2019
https://www.demographic-research.org/Volumes/Vol40/49/ DOI: 10.4054/DemRes.2019.40.49
Descriptive Finding
Changes in seasonality of births in Poland
in the years 1900–2009
Jacek Cypryja
ń
ski
© 2019 Jacek Cypryjański.
This open-access work is published under the terms of the Creative Commons Attribution 3.0 Germany (CC BY 3.0 DE), which permits use, reproduction, and distribution in any medium, provided the original author(s) and source are given credit.
1 Introduction 1442
2 Data and methods 1442
3 Results 1445
4 Discussion 1449
Changes in seasonality of births in Poland in the years 1900–2009
Jacek Cypryjański1
Abstract
BACKGROUND
To date, several countries have documented changes over time in the pattern of seasonal fluctuations of births. Differences in these changes between countries allow us to better understand the social and economic factors determining birth seasonality. OBJECTIVE
The aim of the present study is to explore birth seasonality in Poland over a period of 110 years.
METHODS
The study was conducted using the birth dates of 48,090,100 Polish citizens born in the years 1900–2009 and registered in the General Electronic System for Registration of the Population. I transformed the data into monthly time series of births, normalized the monthly birth rates for the unequal duration of months and years, and detrended by taking them to the centred 12-month average. Finally, I estimated seasonality patterns for particular decades by means of least squares regression on the harmonic model. RESULTS
As many as three, relatively stable seasonal birth patterns occurred in Poland in the studied period. In 20th century Europe, the first one (1900–1919), characterised by a
minimum birth rate in June, had previously only been observed in Italy. The second pattern with the spring peak and local peak in September remained almost unchanged in Poland for the longest time (1950–1979). Then, within a decade, it transformed into a new, third pattern (1990–2009), with peaks in July and September.
CONTRIBUTION
1. Introduction
Research carried out to date clearly shows that seasonal birth fluctuations occur in all studied populations; however, they differ depending on the geographical location and country, and they also change over time (Cowgill 1966a, 1966b; Lam and Miron 1991, 1994; Dorélien 2016). The differences can be the consequence of a number of interrelated factors: biological factors (Smits et al. 1998), various environmental factors such as climate, temperature, and photoperiod (Roenneberg and Aschoff 1990a, 1990b; Lam and Miron 1996; Ruiu and Breschi 2017), and sociocultural and economic factors including seasonality of marriages, birth order, religious calendar, and industrialization (Bobak and Gjonca 2001; Haandrikman 2004; Friger, Shoham-Vardi, and Abu-Saad 2009; Herteliu et al. 2015; Björnsson 2016; Dahlberg and Andersson 2018)
Analysis of changes in seasonal fluctuations over time is difficult due to limited access to sufficiently long time series. Hence, our knowledge of the scale and, most importantly, the dynamics of these changes is fragmented. Nevertheless, we know that in the second half of the 20th century seasonal fluctuations decreased in many countries,
leading to a loss of birth seasonality in Spain in the 1990s (Cancho-Candela, Andrés-de Llano, and Ardura-Fernández 2007), and to the appearance of new patterns in, for example, Germany, Scotland, and the Netherlands, (Lerchl, Simoni, and Nieschlag 1993; Russell, Douglas, and Allan 1993; Haandrikman 2004). In Iceland and Sweden significant changes in seasonality took place over 150 and 100 years respectively (Björnsson 2016; Cassel 2002). Comparing these changes in various countries against other indicators can shed more light on the factors determining the seasonality of births. This paper documents changes in the seasonality of births in Poland in the years 1900–2009. This is the first such study concerning Poland. It shows that over a period of 110 years there were as many as three different patterns of birth seasonality. It also illustrates how historical events interfered with the pattern existing at a given time.
2. Data and methods
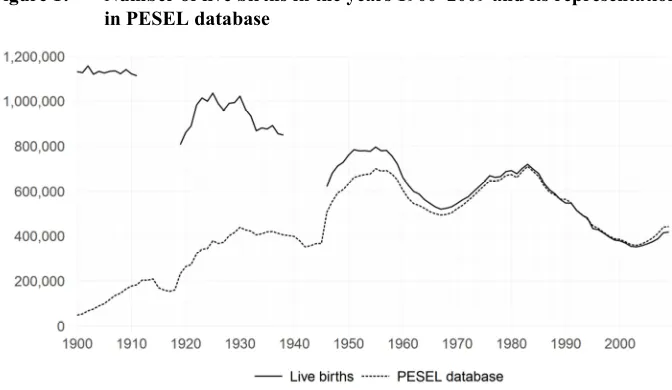
Figure 1: Number of live births in the years 1900–2009 and its representation in PESEL database
Source: Number of live births obtained from Statistics Poland, Szulc (1936), and Jelonek (1986).
PESEL contains only the birth dates of those who were citizens, lived in the new borders of the Polish state as delimited after World War II, and were alive between 1974 and the early 1990s when PESEL was created. To verify that the PESEL database reflects the actual birth patterns, PESEL data for 1932 was compared with the only extant data that is relatively complete (89.8% of all births): the daily numbers of live births among the wedded in Poland in 1932, excluding the capital city of Warsaw (Zaremba 1936). Both sources generate almost identical monthly birth patterns (the Pearson correlation coefficient is 0.991), showing that the PESEL database is a reliable source for studying seasonality in the first half of the 20th century.
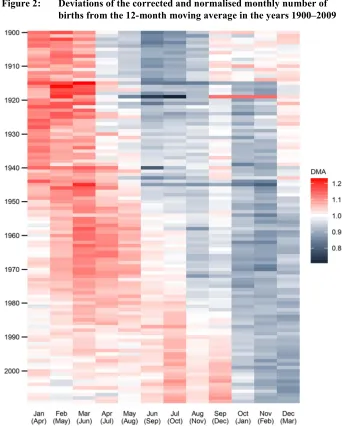
Figure 2: Deviations of the corrected and normalised monthly number of births from the 12-month moving average in the years 1900–2009
The monthly series of deviations from the moving average (DMA) was used to estimate the seasonality patterns for individual decades and for the entire analysed period. For the estimation I used the least squares method and the harmonic model (HM), as well as the seasonal means model (SMM, with dummy variables for each month) for comparison of results (Cornelissen 2014; Cryer and Chan 2008). Harmonic models have the property that the individual harmonics in the model are not correlated, which means that each of them explains a different part of the total variation. Therefore, the percentage to which the individual harmonics explain the variation can be summarised and their sum is equal to the model’s coefficient of determination. Moreover, the analysis of individual harmonics helps to identify changes in the seasonality pattern over time.
The HM consisted of six harmonics (sine and cosine functions of equal period)Hi
wherei is not only an index but also shows the number of periods of a given harmonic in a year. After estimating the parameters of the HM, insignificant sine and cosine functions (with a confidence level of 0.01) were removed and the parameters of the adjusted model (AHM) were estimated. All calculations were applied by means of the programming language R, version 3.4.2, and the integrated development environment RStudio, version 1.1.447.
3. Results
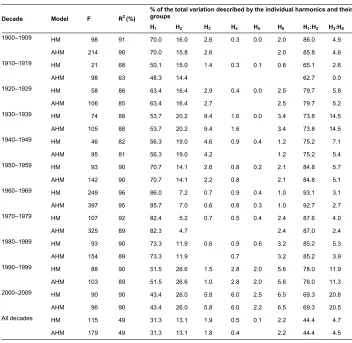
Table 1 shows the F-statistics and coefficients of determination R2, as well as the
percentage to which the individual harmonics of the model explain the total variation. All the estimated models are statistically significant and differ in theR2 and in the
percentage to which individual harmonics explain the total variation. The number of significant harmonics (in AHM) ranges between 2 and 6, whereH1 and H2 are present
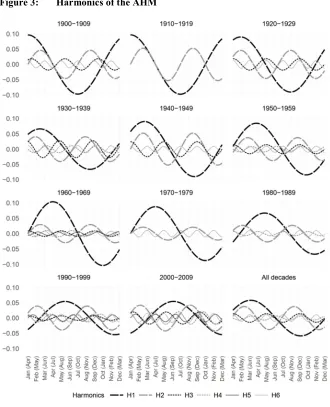
in every model. Moreover, the amplitude and acrophase of the individual harmonics (Figure 3) change over the following decades. The way in which the acrophase of H1
changes is noteworthy. In the first two decades (1900–1919), H1 takes the form of a
cosine function. In the next three decades its acrophase gradually increases and in the 1950s theH1takes the form close to sine, and in 1960‒1979 the form of sine function. In the subsequent decades the acrophase ofH1 continues to grow and in the years 2000–
Table 1: Selected parameters of the HM and AHM
Decade Model F R2(%)
% of the total variation described by the individual harmonics and their groups
H1 H2 H3 H4 H5 H6 H1:H2 H3:H6
1900–1909 HM 98 91 70.0 16.0 2.6 0.3 0.0 2.0 86.0 4.9
AHM 214 90 70.0 15.8 2.6 2.0 85.8 4.6
1910–1919 HM 21 68 50.1 15.0 1.4 0.3 0.1 0.8 65.1 2.6
AHM 98 63 48.3 14.4 62.7 0.0
1920–1929 HM 58 86 63.4 16.4 2.9 0.4 0.0 2.5 79.7 5.8
AHM 106 85 63.4 16.4 2.7 2.5 79.7 5.2
1930–1939 HM 74 88 53.7 20.2 9.4 1.6 0.0 3.4 73.8 14.5
AHM 105 88 53.7 20.2 9.4 1.6 3.4 73.8 14.5
1940–1949 HM 46 82 56.3 19.0 4.6 0.9 0.4 1.2 75.2 7.1
AHM 95 81 56.3 19.0 4.2 1.2 75.2 5.4
1950–1959 HM 93 90 70.7 14.1 2.6 0.8 0.2 2.1 84.8 5.7
AHM 142 90 70.7 14.1 2.2 0.8 2.1 84.8 5.1
1960–1969 HM 249 96 86.0 7.2 0.7 0.9 0.4 1.0 93.1 3.1
AHM 397 95 85.7 7.0 0.6 0.8 0.3 1.0 92.7 2.7
1970–1979 HM 107 92 82.4 5.2 0.7 0.5 0.4 2.4 87.6 4.0
AHM 325 89 82.3 4.7 2.4 87.0 2.4
1980–1989 HM 93 90 73.3 11.9 0.6 0.9 0.6 3.2 85.2 5.3
AHM 154 89 73.3 11.9 0.7 3.2 85.2 3.9
1990–1999 HM 88 90 51.5 26.6 1.5 2.8 2.0 5.6 78.0 11.9
AHM 103 89 51.5 26.6 1.0 2.8 2.0 5.6 78.0 11.3
2000–2009 HM 90 90 43.4 26.0 5.8 6.0 2.5 6.5 69.3 20.8
AHM 96 90 43.4 26.0 5.8 6.0 2.2 6.5 69.3 20.5
All decades HM 115 49 31.3 13.1 1.9 0.5 0.1 2.2 44.4 4.7
AHM 179 49 31.3 13.1 1.8 0.4 2.2 44.4 4.5
Figure 3: Harmonics of the AHM
Note: The probable month of conception is shown in brackets after the month of birth.
HM and the other with the AHM. Patterns calculated by means of HM are identical to those generated with SMM.
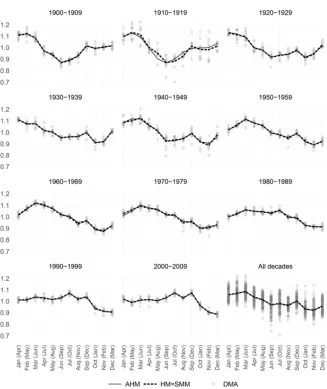
Figure 4: Birth seasonality patterns in Poland in the years 1900–2009
The course of changes in the birth seasonality pattern in successive decades reflects the changes taking place in the acrophase of H1. In the first two decades the
birth seasonality patterns are almost the same: from January to March the birth rate is relatively stable at a high level (1.08–1.13); in April it starts falling to reach the minimum in June (0.87). Over the next three months the birth rate grows to exceed 1.00 in September and oscillates around this value for three consecutive months. In the next three decades (1920–1949) the pattern slowly changes: the June minimum disappears and the local maximum shows up in September.
The new pattern appears in the 1950s and lasts, almost unchanged, until the end of the 1970s. In this pattern the birth rate reaches the highest values in March (1.09–1.12). A March maximum means that most conceptions happen in June. From March the birth rate gradually decreases (except for September, in which the birth rate increases for a while) to reach the minimum in October/November (0.88–0.92).
The next change in the pattern occurs in the 1980s, when the March maximum slowly disappears, the number of July births increases, and the period between these months is characterized by a fairly even high birth rate. From the 1990s a new pattern develops, with the maximum in July and September (1.04–1.08), a fairly even birth rate from January to June and August (0.99–1.04), and a lower birth rate in October, November, and December (0.88–0.96). The September maximum translates into most conceptions being in the December holiday season, which is the time when family and social life intensifies.
4. Discussion
Looking at changes in the seasonality pattern through the prism of harmonics (harmonics shifting and appearing and disappearing throughout the decades, Figure 3) one can conclude that if the seasonality of births is determined by biological rhythms, they are strongly disturbed by cultural, social, and economic factors. An example, at least as far as the first birth is concerned, is the seasonality of marriages (Bobak and Gjonca 2001; Haandrikman 2004; Régnier-Loilier 2010), the pattern of which changed significantly in Poland during the analysed period (Szukalski 2015, 2018). Determining what these factors are requires further research; however, some observations can be made by analysing the results in the context of specific incidents in Poland’s history, or by comparing them with the results of research from other countries.
may omit important details (e.g., the local peak in September). If I had used only two harmonics in my study, the median of the R2 values presented in Table 1 would
decrease by 10 percentage points.
The seasonality pattern that occurs in the Polish territory during the first two decades (at that time there was no independent Poland) stands out because it does not appear in any of the 20th century populations analysed by Cowgill (1966a, 1966b) or
Lam and Miron (1994, 1996), whereas a very similar pattern appears in the study by Knodel and Wilson (1981), devoted to German villages in the 18th and 19th centuries.
This may indicate a link between birth pattern and the agricultural cycle in a period when 65% of the population in the Polish territory worked in agriculture (Gorzelak 2010). The trough in the seasonality pattern corresponds to reduced conception during the harvest period, e.g., due to labour migration of one of the spouses, and to increased conception in periods of low labour demand in agriculture. However, the problem seems to be more complex. First of all, Knodel and Wilson (1981) present four seasonality patterns for legitimate births of second or higher orders (1750–1774, 1800– 1824, 1825–1849, 1875–1899), of which the first three (which differ only in amplitude) are similar to the Polish model for 1900–1919, while the fourth model resembles the Polish and German models from the 1950s. In turn, Quetelet (1869), in a pioneering work in which he studied the seasonality of births in the Kingdom of the Netherlands in the years 1815–1826, presents two patterns, separately for rural and urban populations. These patterns are very similar to each other and to the Polish pattern for 1900–1919, only with slight differences in amplitude. Studies on Italy covering the years 1862– 2011 observe a similar pattern during the first six decades, with a minimum in June (Ruiu and Breschi 2017). If we also take into account data from before and during the industrial revolution in England (Cowgill 1966c; Wrigley and Schofield, in Lam and Miron 1991) and, for example, 19th century Iceland and Austria (Björnsson 2016;
Doblhammer, Rodgers, and Rau 1999), we get a full picture of the puzzle still waiting to be solved.
Finally, it is worth noting that the results presented here also confirm previous observations on how wars disturb the seasonality of births. The seasonality patterns for the decades in which wars took place on Polish territory (World War I 1914–1918; Polish-Bolshevik war 1919–1921; World War II 1939–1945) are characterized by the lowest values ofR2 (Table 1). The invasion of Poland in September 1939, which began
References
Björnsson, D.F. (2016). The effect of industrialization on birth seasonality in Iceland: An empirical analysis [Bachelor’s thesis]. Reykjavík: University of Iceland, School of Social Sciences, Faculty of Economics.
Bobak, M. and Gjonca, A. (2001). The seasonality of live birth is strongly influenced by socio-demographic factors. Human Reproduction 16(7): 1512–1517. doi:10.1093/humrep/16.7.1512.
Cancho-Candela, R., Andrés-de Llano, J.M., and Ardura-Fernández, J. (2007). Decline and loss of birth seasonality in Spain: Analysis of 33,421,731 births over 60 years. Journal of Epidemiology and Community Health 61(8): 713–718. doi:10.1136/jech.2006.050211.
Cassel, P.-G. (2002). Changing seasonality of births in Sweden 1900–1999. In: Carling, J. (ed.). Nordic demography: Trends and differentials. Oslo: Nordic Demographic Society: 97–110.
Cornelissen, G. (2014). Cosinor-based rhythmometry.Theoretical Biology and Medical
Modelling 11(16): 1–24.doi:10.1186/1742-4682-11-16.
Cowgill, U.M. (1966a). The season of birth in man. Man 1(2): 232–240. doi:10.2307/2796349
Cowgill, U.M. (1966b). Season of birth in man: Contemporary situation with special reference to Europe and the Southern hemisphere. Ecology 47(4): 614–623. doi:10.2307/1933939.
Cowgill, U.M. (1966c). Historical study of the season of birth in the city of York, England.Nature 209(5028): 1067–1070.doi:10.1038/2091067a0.
Cryer, J.D. and Chan, K.-S. (2008).Time series analysis with applications in R. New York: Springer.doi:10.1007/978-0-387-75959-3.
Dahlberg, J. and Andersson, G. (2018). Changing seasonal variation in births by sociodemographic factors: A population-based register study. Human
Reproduction Open 2018(4): 1–8.doi:10.1093/hropen/hoy015.
Dorélien, A. (2016). Birth seasonality in sub-Saharan Africa. Demographic Research
34(27): 761–796.doi:10.4054/DemRes.2016.34.27.
Friger, M., Shoham-Vardi, I., and Abu-Saad, K. (2009). Trends and seasonality in birth frequency: A comparison of Muslim and Jewish populations in southern Israel: Daily time series analysis of 200,009 births, 1988–2005.Human Reproduction
24(6): 1492–1500.doi:10.1093/humrep/dep040.
Gorzelak, E. (2010). Polskie rolnictwo w XX wieku: Produkcja i ludność. Warsaw: Oficyna Wydawnicza SGH (Prace i Materiały Instytutu Rozwoju Gospodarczego SGH 84).
Haandrikman, K. (2004). Seasonality of births in the Netherlands: Changing patterns due to conscious planning? Poster presented at the Annual Meeting of the Population Association of America, Boston, USA, April 1–3, 2004.
Herteliu, C., Ileanu, B.V., Ausloos, M., and Rotundo, G. (2015). Effect of religious rules on time of conception in Romania from 1905 to 2001. Human
Reproduction 30(9): 2202–2214.doi:10.1093/humrep/dev129.
Jelonek, A. (1986). Ruch naturalny ludności w Polsce w latach 1948–1984. Wrocław: Wydawnictwo Polskiej Akademii Nauk (Zeszyty Dokumentacji Geograficznej 6).
Knodel, J. and Wilson, C. (1981). The secular increase in fecundity in German village populations: An analysis of reproductive histories of couples married 1750– 1899.Population Studies 35(1): 53–84.doi:10.2307/2174835.
Lam, D.A. and Miron, J.A. (1991). Seasonality of births in human populations.Social
Biology 38(1–2): 51–78.doi:10.1080/19485565.1991.9988772.
Lam, D.A. and Miron, J.A. (1994). Global patterns of seasonal variation in human fertility. Annals of the New York Academy of Sciences 709(1): 9–28. doi:10.1111/j.1749-6632.1994.tb30385.x.
Lam, D.A. and Miron, J.A. (1996). The effects of temperature on human fertility.
Demography 33(3): 291–305.doi:10.2307/2061762.
Lerchl, A., Simoni, M., and Nieschlag, E. (1993). Changes in seasonality of birth rates in Germany from 1951 to 1990. Naturwissenschaften 80(11): 516–518. doi:10.1007/BF01140808.
Quetelet, A. (1869). Physique sociale, ou: Essai sur le développement des facultés de
Régnier-Loilier, A. (2010). Évolution de la saisonnalité des naissances en France de 1975 à nos jours.Population 65(1): 145–185.doi:10.3917/popu.1001.0147. Roenneberg, T. and Aschoff, J. (1990a). Annual rhythm of human reproduction: I.
Biology, sociology, or both? Journal of Biological Rhythms 5(3): 195–216. doi:10.1177/074873049000500303.
Roenneberg, T. and Aschoff, J. (1990b). Annual rhythm of human reproduction. II. Environmental correlations. Journal of Biological Rhythms 5(3): 217–239. doi:10.1177/074873049000500304.
Ruiu, G. and Breschi, M. (2017). Seasonality of livebirths and climatic factors in Italian regions (1863–1933).Historical Life Course Studies 4: 145–164.
Russell, D., Douglas, A.S., and Allan, T.M. (1993). Changing seasonality of birth: A possible environmental effect. Journal of Epidemiology and Community Health
47(5): 362–367.doi:10.1136/jech.47.5.362.
Smits, L.J., Zielhuis, G.A., Jongbloet, P.H., and Straatman, H. (1998). Seasonal variation in human fecundability. Human Reproduction 13(12): 3520–3524. doi:10.1093/humrep/13.12.3520.
Szukalski, P. (2015). Sezonowość małżeństw we współczesnej Polsce. Lodz: University of Lodz (Demografia i Gerontologia Społeczna Biuletyn Informacyjny 2015-10).
Szukalski, P. (2018). Sezonowość małżeństw i urodzeń. Lodz: University of Lodz (Demografia i Gerontologia Społeczna Biuletyn Informacyjny 2018-10).
Szulc, S. (1936). Ruch naturalny ludności w Polsce w latach 1895–1935. Warsaw: Statystyka Polski.