5 |
P a g e
International Journal of
Medicinal Chemistry &
Analysis
e ISSN 2249 – 7587 Print ISSN 2249 - 7595
www.ijmca.com
Research Article
DEVELOPMENT OF VALIDATED BIO ANALYTICAL METHOD
FOR THE INVITRO DETERMINATION OF DOXOFYLLINE FROM
HUMAN PLASMA BY HPTLC
Nihila K, Akhil MB, Y Haribabu, Kumar Palanisamy
*Department of Pharmaceutical Analysis, Grace College of Pharmacy, Palakkad, Kerala, India.
ABSTRACT
Bio-analytical methods employed for the quantitative determination of drugs and their metabolites in biological samples plays a significant role in the evaluation and interpretation of bioavailability, bioequivalence and pharmacokinetic study data. These studies generally support regulatory findings. HPTLC is one of the most widely used methods for both qualitative and quantitative analysis. After extraction, various concentrations of drug solutions were applied on the plate and development of the plate was done by using mobile phase system consisting of Toluene: n-butanol: Triethylamine: Ammonia (3:5:2:0.1%v/v/v/v) Rf values of Doxofyllinewasfound to be 0.47±0.01. The developed method was validated according to the US-FDA guidelines. Linear regression data revealed an excellent linear relationship between concentration and peak area ratio over a concentration range of 20-200 ng/spot. The stability of Doxofylline in prepared sample was found to be 7hours under room temperature.
Keywords: Bioavailability, Pharmacokinetic, Interpretation, Metabolites.
INTRODUCTION
In order to determine the optimum dose it is necessary to know in detail the pharmacokinetics of drug and its metabolites [1]. Today such requirements are put upon all newly introduced drugs and this is the reason why so much interest is focused on the topic. The most widely employed bioanalytical techniques include but not limited to conventional chromatography methods (such as HPLC, HPTLC and GC), mass spectrometry based methods (such as LC-MS, LC-MSMS, GC-MS) and ligand bind assays. The biological samples generally used
Access this article online Home page:
http://ijmca.com/
DOI:
http://dx.doi.org/10.21276/ijmca.2020.10.1.2
Quick Response code
Received:25.10.19 Revised: 12.11.19 Accepted:30.11.19
are plasma, serum, urine and saliva. However in most of the cases plasma is the sample of choice [2]. This is due to the fact that the analyte concentration in plasma can be used reliably to interpret the analyte concentration in the site of action [3]. Sample preparation involves separation of analyte from the matrix. Sample preparation step largely depends on the nature of sample and type of method employed for estimation. Steps involved in HPTLC method development can be summarized as follows [4-7].
Selection of chromatographic layer
Pre coated plates with different support materials and different sorbents are available. Of these silica gel is far most important sorbent.
Sample preparation
6 |
P a g e
suitable concentration of analytes for direct application on the HPTLC plate [8].
Layer pre treatments
Prior to chromatography it is a common practice to prepare the layer by any or all of the following steps; washing, activation, conditioning and equilibrium so as to avoid problems like irregular and drifting densitometric baselines, ghost peaks and reduced sample detectability.
Mobile phase optimization
A solvent of correct strength for a single development separation will migrate the sample into the Rfrange of 0.2 to 0.8. Mobile phase should chose taking into consideration chemical properties of analytes and sorbent layer [9].
Chamber saturation
If the tank is saturated prior to development, solvent vapour soon get uniformly distributed throughout the chamber, hence less solvent shall be required to travel at a particular distance, resulting in the lower Rfvalues.
Development and detection
Ascending, descending, two dimensional, horizontal, multiple over run gradient, radial and anti-radial are most common methods of development. Detection may be done manually or instrumentally; instrumental detection is recommended for quantitative analysis [10].
Doxofylline
Structure
Chemical Name : 7-(1,3-dioxolan-2-ylmethyl)-1,3-dimethylpurine-2,6-dione
Molecular weight : 266.25
Molecular formula : C11H14N4O4
Description : White crystalline powder
Solubility : Soluble in water, acetone, benzene, chloroform
pKa value : 9.8
Therapeutic use : Antitussiveand Bronchodilator
MATERIALS AND METHODS
Camag HPTLC System (with Linomat 5 as application device, TLC Scanner 3 and WinCATS software)
Determination of Doxofylline from Human Plasma byHptlc
Stationary phase : pre-coated silica gel 60 F254 on Aluminum sheets
Mobile phase : Toluene: n-butanol: Ethyl acetate: Ammonia (3:5:2:0.1)
Chamber saturation time : 20 minutes Pre-saturation time : 10 minutes Migration distance : 80mm
Band width : 6mm
Slit dimension : 5× 0.45mm
Source of radiation : Deuterium lamp Detection wavelength : 278nm (fig.77) Rfvalues : Doxofylline – 0.47 ± 0.01 Spots were scanned at 278 nm in reflectance mode using Camag TLC scanner [11-15].
Optimization of Extraction Procedure Selection of organic solvent for extraction
50 µL of standard drug solution was added to the 250 µL of human plasma and extracted with various organic solvents listed below in table 1.
Fixed extraction procedure
To the clean and dry centrifuge tube, 250 µL plasma, 50 µL of aliquots of standard drug solutions (2 to 20µg/ml) were added and vortexed for 5 minutes. About 5 mL of acetonitrile was added to the above solution and vortexed for 5 minutes. This solution was centrifuged at 3000 rpm for 10 minutes. The clear supernatant solution was transferred to eppendrof’s tubes and evaporated to dryness using nitrogen gas. The residue was reconstituted with 500 µL of methanol and 10 µL of this solution was applied on to the plate. The plate was analysed and chromatograms were recorded. Rf values of Doxofylline found to be 0.47.
Standard Chromatograms of Doxofylline in Plasma Validation
The validation of the developed method was carried out in terms of specificity, linearity, lower limit of quantification (LLOQ), accuracy, precision, recovery and stability studies according to US-FDA guidelines.
Specificity
Specificity of the above developed extraction method was demonstrated as follows. Blank plasma samples from six volunteers were extracted using the above procedure and chromatographed. It was found that there was no interference from blank plasma.
Linearity and Range
7 |
P a g e
Lower limit of quantification (LLOQ)
The lowest concentration at which the peak is quantified is called ‘Lower Limit of Quantification’ which was found to be 20ng/spot.
Accuracy
A minimum of five determinations per concentration were carried out to measure the accuracy of the method. At least three concentrations (high QC, middle QC, low QC) in the range is recommended. Accuracy can be measured by assessing the deviation of mean test result from the true value and it should be within 15%. The results are shown in table 3.
Precision
Precision of the method was determined by
Intraday precision
Intraday precision was studied by carrying out the analysis of the standard drug at three different concentrations in the linearity range of drug (high QC, middle QC, low QC) for five times on the same day and coefficient of variation (CV) was calculated in table 4.
Inter day precision
Inter day precision was studied by carrying out the analysis of the standard drug at three different concentrations in the linearity range of drug (high QC,
middle QC, low QC) for five days over a period of one week and coefficient of variation (CV) was calculated, table 5.
Recovery
The extraction efficiency was explained by recovery studies. The standard drug was extracted by the proposed extraction method. The extracts were analysed with the fixed chromatographic conditions. The peak areas of developed chromatograms were compared with that of unextracted standard peak areas. The peak area responses obtained were used for determining the extraction efficiency. Recovery should be determined by using three concentration levels (high QC, middle QC, low QC).The results are shown in table 6.
Stability
Thedrug may undergo degradation during the analysis. Hence it is necessary to study the stability of drug in prepared sample at two different concentrations (low QC, high QC). The stability of the drug was studied under room temperature. The samples were chromatographed at fixed time intervals and the peak area was compared with that of fresh solution. The stability of Doxofylline was found to be 7 hours under room temperature.
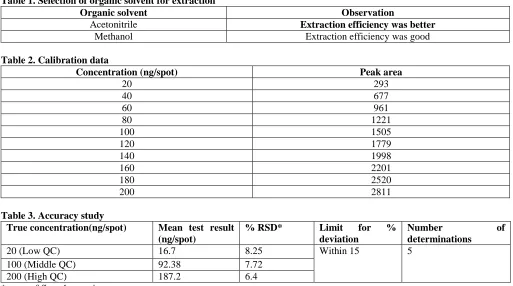
Table 1. Selection of organic solvent for extraction
Organic solvent Observation
Acetonitrile Extraction efficiency was better
Methanol Extraction efficiency was good
Table 2. Calibration data
Concentration (ng/spot) Peak area
20 293
40 677
60 961
80 1221
100 1505
120 1779
140 1998
160 2201
180 2520
200 2811
Table 3. Accuracy study
True concentration(ng/spot) Mean test result (ng/spot)
% RSD* Limit for % deviation
Number of determinations
20 (Low QC) 16.7 8.25 Within 15 5
100 (Middle QC) 92.38 7.72
200 (High QC) 187.2 6.4
8 |
P a g e
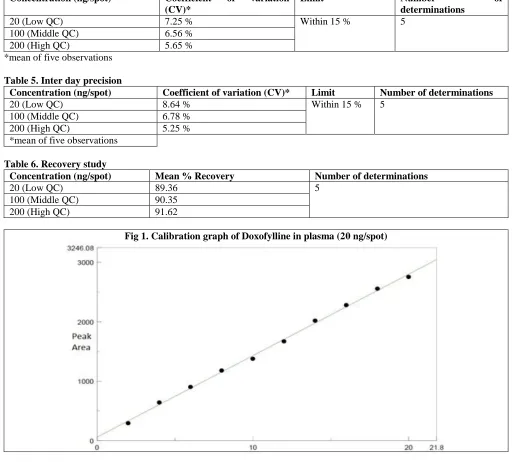
Table 4.Intraday precision
Concentration (ng/spot) Coefficient of variation (CV)*
Limit Number of determinations
20 (Low QC) 7.25 % Within 15 % 5
100 (Middle QC) 6.56 %
200 (High QC) 5.65 %
*mean of five observations
Table 5. Inter day precision
Concentration (ng/spot) Coefficient of variation (CV)* Limit Number of determinations
20 (Low QC) 8.64 % Within 15 % 5
100 (Middle QC) 6.78 %
200 (High QC) 5.25 %
*mean of five observations
Table 6. Recovery study
Concentration (ng/spot) Mean % Recovery Number of determinations
20 (Low QC) 89.36 5
100 (Middle QC) 90.35
200 (High QC) 91.62
Fig 1. Calibration graph of Doxofylline in plasma (20 ng/spot)
SUMMARY AND CONCLUSION
In order to extract the Doxofylline from human plasma, Protein precipitation method was selected. After extraction, various concentrations of drug solutions were applied on the plate and development of the plate was done by using mobile phase system consisting of Toluene: n-butanol: Triethylamine: Ammonia (3:5:2:0.1%v/v/v/v) Rf values of Doxofylline was found to be 0.47±0.01. The developed method was validated according to the US-FDA guidelines. Linear regression data revealed an excellent linear relationship between concentration and peak area ratio over a concentration range of 20-200 ng/spot. The slope, intercept and correlation co-efficient
values were found to be 137.0773, 59.5 and 0.9989, respectively.
The concentration of 20 ng/spot was found as a Lower Limit of Quantification. Good recovery values demonstrated the extraction efficiency. Accuracy and precision of the developed method was found to be within the permitted limit.The stability of Doxofylline in prepared sample was found to be 7hours under room temperature. Hence the developed method can be used for the analysis of Doxofylline from human plasma.
AKNOWLEDGEMENT
Nil
CONFLICT OF INTEREST
9 |
P a g e
REFERENCES
1. Skoog DA, Holler JF, Nieman TA. Principles of Instrumental Analysis. 5th ed. Singapore: Thomson Learning Inc, 1998, 110-300.
2. Frank S. Hand Book of Instrumental Techniques for Analytical Chemistry. Pearson Education Pvt. Ltd; p. 17-55. 3. Mendham J, Denney R, Barnis JD, Thomas MJ. Vogel’s text book of quantitative chemical analysis. 6th ed. Pearson
education; 2003, 1-11, 251-261, 676.
4. Sharma BK. Instrumental methods of chemical analysis. 18th ed. Meerut: Krishna Prakashan Media Pvt. Ltd; 1999, S10-S30.
5. Willard HL, Dean JA, Settle FA. Instrumental methods analysis. 7thed., CBS publishers and distributors, New Delhi, 1986, 60-75, 600-680.
6. Breaux J, Jones K, Boulas P. Understanding and implementing efficient analytical method development and validation. Pharmaceutical technology, 2003, 6-13.
7. Gurdeep CR, Anand SK. Instrumental methods of chemical analysis. 5th ed. Mumbai: Himalaya publishing house, 2002, 149.
8. Venkatesan S, Giriraj P, Myvizhi S, Kathiravan P, Rameshwarsingh. A simple HPLC Method for quantitation of doxofylline in tablet dosage Form. International Journal of Chemical and Pharmaceutical Sciences, 1(2), 2010.
9. HR Joshi, AH Patel, AD Captain. Spectrophotometric and reversed-phase high-performance liquid chromatographic method for the determination of doxophylline in pharmaceutical formulations. Pharm Analysis, 2(3), 2010, 289-296. 10. Narendra GP, Akademiai K. A validated, stability-indicating HPTLC method for analysis of Doxofylline. JPC, 5(5),
2009, 345-48.
11. Food and drug administration, Guidance for industry drug stability guidelines. 2008, www.fda.gov/cvm
12. Gandhimathi M, Ravi TK, Nilima S. Validated high performance thin layer chromatography method for simultaneous estimation of ofloxacin and ornidazole in tablet dosage form. IJPS, 68(6), 2006, 838 – 840.
13. United States. Dept. of Health and Human Services. FDA. Guidance for industry-bioanalytical method validation, 2001 14. Mody VD, Pandya KK, Satia MC, Modi IA, Gandhi TP. High performance thin-layer chromatographic method for the
determination of sparfloxacin in human plasma and its use in pharmacokinetic studies. J Pharm Biomed Anal., 16(8), 1998, 1289-1294.