Timber and Biomass Transport Optimization:
A Review of Planning Issues, Solution
Techniques and Decision Support Tools
Mauricio Acuna
Abstract
The transport of timber and biomass represents a significant proportion of the operational cost for the forest industry worldwide. This calls for optimization solutions so that companies can organize their transport operations and allocate resources efficiently, and reduce the impact of transport operations on the environment. This paper presents an extensive overview of the transport and biomass optimization problem in the forest industry. It provides a detailed de -scription of mathematical solutions, including linear programming models and algorithms, to solve complex transportation planning problems involving annual, monthly and daily decisions. Also, the paper presents and describes two decision support tools, MCPLAN and FastTRUCK, which have been implemented to assist transport planners to optimize the flows of timber and biomass from the forest to mills and energy plants, and to schedule and route the trucks efficiently between these supply and demand points.
Keywords: timber and biomass transport optimization, transport operations, wood flows, linear programming, log-truck scheduling, simulated annealing, heuristics
As timber and biomass are mainly carried by trucks for parts of the transportation, the focus of this paper is on the transport of roundwood (logs delivered to pulp mills and sawmills) and biomass (chipped or packed) by trucks. It is also assumed that a forest company
organizes a fleet of trucks using centralized scheduling
and dispatching, with trucks belonging to one or sev-eral haulage contractors. This approach has been pro-posed not only to reduce costs and improve the tactical coordination of trucks and loads but also to reduce the impact of transport operations on the environment
resulting from reduced emissions, traffic congestions,
and noise and dust on forest roads (Gronalt and Hirsch 2007, Haridass 2009, Acuna et al. 2011).
From a planning perspective, the paper focuses on problems arising in annual, monthly and daily time periods, describing the planning problems/issues, and presenting mathematical solutions and decision sup-port tools to optimize the transsup-port of timber and bio-mass. The document is organized as follows: Section 2 describes the harvest and transport planning in the timber and biomass industry including major deci-sions at each planning level; Section 3 describes the
1. Introduction
Transportation from forestry harvest areas to mills costs the forestry industry millions of dollars annually, accounting for up to half of the operational costs in forestry supply chains (McDonald et al. 2001, Acuna 2011, Audy et al. 2012). Given the level of spending on
transportation costs, even small increases in efficiency
can reduce costs substantially (Rönnqvist et al. 1998, Palmgren 2001, Palmgren et al. 2004). It is, therefore, important to optimize deliveries from the forest to the
mill, and organize the scheduling of trucks efficiently
as they have a high initial investment cost in their pur-chase, and high operational cost over their daily op-erations and ownership lifetime. Opop-erations Research
(OR) models can significantly improve decisions, as
has been shown in real experiences, in particular for daily scheduling. Improvements in technology and communications drive the development of systems based on OR algorithms, which support transporta-tion decisions (Weintraub et al. 2007).
timber and biomass transportation problem including basic mathematical formulations; Section 4 presents a review of some mathematical and algorithmic solution methods for the timber and biomass transport optimi-sation problem; Section 5 describes two decision sup-port systems developed by the author of this paper, including a description of the tools and mathematical
solutions implemented. The final section offers some
concluding remarks.
2. Harvest and transport planning in
timber and biomass industry
Forest management planning is usually performed using a top-down hierarchical approach, where deci-sions regarding harvest and transport, are made at
different levels and planning horizons: strategical, tac -tical, and short-term operational (Palmgren 2001, Rön-nqvist 2003, D’Amours et al. 2008). There is an in-creased level of desegregation on the spatial and non-spatial information used from the strategic to the operational plans, and decisions made at higher levels become input constraints to lower levels plans (Bet-tinger et al. 2008). Church (2007) points out that this hierarchical approach is adopted due to the complex-ity associated with capturing all elements and imple-menting forest planning decisions and constraints in a single model.
The strategic level often describes broad-scale plan -ning decisions over an extended period, which can range from several years (e.g. plantations in the South-ern Hemisphere) to several decades (e.g. natural for-ests in the Northern Hemisphere). Regarding trans-port and logistics, the plan includes decisions related to facility building (e.g. location and opening/closing of mills, stockyards, and fuel terminals), inventory lo-cation and levels, procurement strategies (e.g. push, pull), transport technology, resources and investment (e.g. road and rail networks, transport equipment, and port infrastructure), and supply chain network design (D’Amours et al. 2008).
In the next level of the hierarchical forest planning
approach, tactical planning often is linked to
long-term strategic planning described above, and short-term operational planning. Decisions at a tactical level span between 1 and 30 years, embracing the spatial allocation and scheduling of forest resources to forest operations. Connections with operational planning have impacts on transport and harvest operations in-volving annual, monthly and daily decisions such as
timber and biomass flows, truck scheduling and dis
-patching, and allocation of cutting patterns and log
-ging crews to harvest coupes. Transport decisions at a
tactical level include allocation of harvest units and catchment areas to customers, allocation of transport
resources including trucks and drivers, and fleet man -agement. Other typical tactical decisions concern
al-locating customers to mills and defining the necessary
distribution capacity (D’Amours et al. 2008).
The last level to be mentioned is short-term opera-tional planning, which involves monthly and daily decisions. Operational decisions in transportation deal with truck scheduling and dispatching, to optimally
establish a set of routes and schedule that a fleet of
trucks has to perform to deliver timber (log products) from wood pickup locations (harvest areas) to cus-tomer sites (mills). Scheduling means to plan the entire
fleet’s route in advance (typically one day ahead), list -ing every pickup and delivery of timber products. An estimation of the stocks of logs at the pickup locations and demand at the customer sites is required to come
up with a good plan. In practice, it is quite difficult to run a log truck fleet according to a pre-arranged
schedule. Unexpected delays, breakdowns, and queues mean some logs are delivered late or not at all, all of which disturb the planned schedule. In such cases, it is essential to have a dispatcher on hand to repair the schedule in cooperation with truck drivers and transport coordinators (Palmgren 2001).
3. Timber and biomass transportation
problem
In this chapter, the focus is on two transportation problems, one that comprises annual and monthly
decisions (timber and biomass flow, and backhauling),
and another that involves daily decisions (truck sched-uling).
3.1 Timber and biomass flow and backhauling
The timber and biomass flow problem balances
demand at consumption centers against supply from the forests, whereas backhauling extends the network
flow problem where routes are included to explicitly consider efficient routing (Epstein et al. 2007).
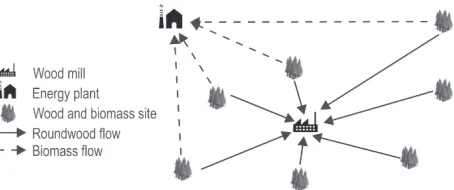
Fig. 1 presents the network structure of the wood
flow problem, assuming two generic products, round
-wood and biomass. A forest site can supply just round-wood or both products, whereas a destination point
can demand one or both products. In the latter case,
the mill (e.g. a pulp mill) and the energy plant are part of the same industrial complex and have the same geo-graphic location.
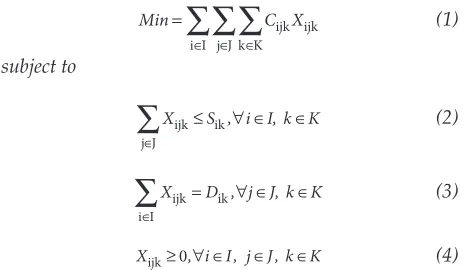
Assuming multiple products (e.g. roundwood and biomass), and multiple supply and demand points,
the optimization flow model can be stated as:
Min= C X
∈ ∈
∈
∑
∑
∑
ijk ijkk K j J i I
(1)
subject to
Xijk Sik
j J
≤ ∀ ∈ ∈
∈
∑
, i I, k K (2)Xijk Dik j
i I
= ∀ ∈ ∈
∈
∑
, J, k K (3)Xijk≥ ∀ ∈0, i I j J k K, ∈ , ∈ (4)
In this mathematical formulation, the index sets I,
J, and K represent the set of supply points (harvest areas), demand points (wood mill or energy plant), and products (roundwood or biomass), respectively.
The flow of product k from supply point i to demand point j is represented by the decision variable Xijk.
The objective function minimizes total wood and
biomass flow costs, where Cijk represents the flow costs
of product k, between supply point i and demand point j. Constraint (1) ensures that the flow of products
does not exceed the capacity of the supply points. Con-straint (2) represents that the demand at the consump-tion centers (e.g. mill and energy plant) is equal to the supply from forest areas, whereas constraint (3) estab-lishes the non-negativity of decision variable Xijk. The
formulation is an extension of the transportation prob-lem (Taja 2016), and corresponds to a linear program-ming (LP) model, which can be solved quickly and
efficiently using any commercial LP solver. This basic
flow model is the basis for other more complex mod
-els, for example, when only a subset of the supply points meets the demand of one of the mills or energy plants. Also, the model can contain temporary (e.g. monthly) decisions, with additional constraints that ensure that the demand for roundwood and biomass
is satisfied in each planning period.
As shown by Epstein (2007) and Sosa et al. (2015),
sometimes these flow models can be used to decide
the catchment areas and products allocated to each
industry monthly or weekly. These areas represent supply points that deliver roundwood and biomass to one or more customers.
In the timber and biomass problem, it is assumed that a truck runs loaded from a wood pickup point to a customer (demand) point and empty in the other
direction (left side of Fig. 2). Thus, the distance trav -eled loaded is just half of the total distance trav-eled.
This efficiency metrics is referred as to the running
loaded percentage, which in this example is equal to 50%. It can be higher if routes involving several load-ed trips are performload-ed, that is, backhauling, which reduces the unloaded distance run by the truck (right side of Fig. 2).
Back-haulage flows may dramatically reduce
trans-port costs, with savings between 2% and 20% being
reported in different studies (Carlsson and Rönnqvist
1998, Forsberg et al. 2005). As indicated by Epstein et al. (2007), the possibilities for backhauling are depen-dent on the type of transportation and the geographical distribution of mills and harvest areas and requires
wood flows going in opposite directions.
3.2 Truck scheduling
The daily transportation problem to be solved
con-siders a heterogeneous fleet of trucks (T) that need to be optimally allocated to different transport tasks. The
main objective of this optimal truck allocation is to minimize total unloaded travel times (TU) and wait-ing times (WT) at delivery points (wood pickup loca-tions), assuming that a central transportation system provides schedules for trucks that maximize their uti-lization.
An essential input to solve the truck scheduling mathematical model corresponds to the daily
trans-port tasks. These tasks are predefined with the assis
-tance of a wood flow optimization model as the one
described in the previous section or a short-term har-vest model. A task corresponds to a truckload or trans-port order that must be performed to obtain a feasible solution.
The problem considers the following attributes as -sociated with transport tasks, trucks, and tours;
Tasks:
a transport task starts at a wood pickup location and ends at a customer site (mill)
each transport task has to be fulfilled
each task is characterized by a wood pickup lo-cation (forest coupe or log landing), destination (mill), product, loading time, travel loaded, un-loading time, and time window at the wood pickup location
some tasks can only be performed by certain trucks. Some trucks have limited or no access to certain wood pickup points, or they are not able
to carry some wood products (logs of different specifications).
Trucks:
a heterogeneous fleet of logging trucks of the
same capacity is assumed
trucks are based at different depots. One spe
-cific depot can be the daily starting point of one
or several trucks
trucks are unloaded at the customer sites based
on a first-in, first-out servicing. A truck follows
a queue if there is one at the wood pickup point. To maximize truck utilization, waiting times of trucks in queue is not wanted and must be min-imized or eliminated completely
each truck has a maximum shift time that must
be met. The shift time includes travel empty,
travel loaded, waiting and loading times at wood pickup points, and unloading times at customers. Tours:
a truck always starts its daily tour empty at the corresponding depot
after leaving the depot, a truck visits a wood
pickup location where it is fully loaded. Neither
partial loads nor transport between different
wood pickup points is allowed
after delivering and unloading the load at the
customer, the truck can continue the tour by performing another transport task (provided that remaining loads are to be carried from that particular wood pickup point to any mill) or re-turning to its depot
during one daily tour, a truck can visit one or more wood pickup points or customers, which in turn, can be visited by several trucks through-out the day
a tour must satisfy constraints regarding shift
time and time windows at depots and pickup points.
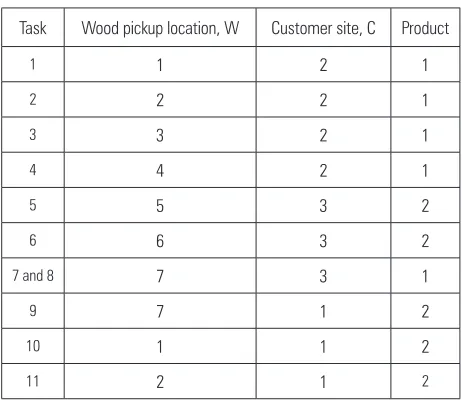
A small example (Fig. 3) illustrates the problem described above, which includes 11 transport tasks, 2 truck depots, 7 wood pickup points, 3 customer sites, and two products. Table 1 presents details of the tasks including wood pickup point, customer site, and product. It is worth noting that two or more transport tasks can share the same wood pickup point (e.g. tasks 2 and 11), the same customer site (e.g. tasks 9, 10, and 11), or the same wood pickup point and customer site (tasks 7 and 8). Also, a customer can demand just a
single product (e.g. customers 1 and 2), or two differ
-ent products (e.g. customer 3). Each product is defined by a different log length combination.
The scheduling planning problem described above is referred in the literature as to the timber transport vehicle routing problem (TTRVP) (Gronalt and Hirsch 2007). Multiple depots can be added to the problem as seen in Fig. 3, and the new formulation is known as the Multiple Depot Vehicle Routing Problem with Pickup and Delivery, and Time Windows (MDVRP-PDTW) (Oberscheider et al. 2013). Palmgren (2001)
Fig. 3 Small truck scheduling problem
Table 1 Description of transport tasks for the small truck schedul-ing problem shown in Fig. 4
Task Wood pickup location, W Customer site, C Product
1 1 2 1
2 2 2 1
3 3 2 1
4 4 2 1
5 5 3 2
6 6 3 2
7 and 8 7 3 1
9 7 1 2
10 1 1 2
points out that the major differences that set the log
truck scheduling problem apart from the VRPTW and PDPTW are the number of coupling constraints com-binations and the possibility of visiting the same loca-tion several times during the same day. Thus, a truck can drive between several pickup and delivery points during its entire daily route. Palmgren (2001) also points out that in the truck scheduling problem a cus-tomer can be visited several times during the day
un-til its demand is satisfied. Other specific features of the truck scheduling problem include the specific type of
products being demanded by the mills, and the pos-sibility that not all trucks can serve all pickup or deliv-ery nodes.
One mathematical formulation for the above prob-lem is presented by Acuna and Sessions (2015). The mathematical model corresponds to an adaptation of the formulation presented by Gronalt and Hirsch (2007) and Oberscheider et al. (2013), and it is formu-lated as a standard MDVRPPDTW problem.
4. Solution methods for timber and
biomass transport optimization problem
Several solution approaches have been proposed to solve transport problems arising in annual, month-ly and daimonth-ly time periods (for a comprehensive review see Audy et al. 2012, Acuna and Sessions 2014, and Devlin et al. 2016).
In Sweden, Skogforsk developed a system called FlowOpt (Forsberg et al. 2005), which integrates a Geospatial Information System (GIS) with a database and uses a heuristic approach based on a Tabu Search algorithm. A major goal of the system is to facilitate the planning process of managers in forest companies. Shen and Sessions (1989) proposed a network-based method to generate a daily truck schedule that meets a mill delivery program with multiple time windows. Rey et al. (2009) propose a column generation method in which each column corresponds to one feasible route for a truck. These models are based on general-ized set partitioning models or general column-based Mixed Integer Programming (MIP) models. Several authors have used metaheuristics to solve the truck scheduling problem. Gronalt and Hirsch (2007)
pro-pose different strategies of the Tabu Search (TS) heu -ristic, while Rummukainen et al. (2009) propose a method that includes a TS heuristic to create routes and a full truckload-size request, in combination with a MIP model to allocate truckloads to demand sites. Also, McDonald et al. (2010) proposed a simulated an-nealing (SA) method to generate a daily truck sched-ule to deliver a set of requests.
Previous work has considered the problem of op-timized scheduling of log trucks and thus some truck scheduling and dispatching systems for commercial operations have been developed. In Chile, for exam-ple, a computerized system called ASICAM has been in use since 1990. It uses simulation with an embedded heuristic to produce a complete trucking schedule for one day of operations for more than 100 trucks (Ep-stein et al. 2007). The implementation of ASICAM in real operations has led to reductions in costs between 10% and 20% (Weintraub et al. 1996). Similar systems can be found in other countries. In Finland, a system called EPO/KUORMA based on the Tabu Search algo-rithm was developed to deal with all stages of plan-ning, from strategic to operational (Palmgren et al. 2004). Forest companies have reported savings of
about 5% in wood transport costs after the implemen
-tation of the system. In Sweden, Skogforsk developed a system called FlowOpt (Forsberg et al. 2005), which integrates Geospatial Information Systems (GIS) with a database and uses a heuristic approach based on a Tabu Search algorithm. In Canada, a system named MaxTour was developed to compute the potential in back-haulage tours within the volume of one or sev-eral types of products, based on an adaptation of the well-known savings heuristic of Clarke and Wright (Marier et al. 2007). Several other systems and tools have been developed to solve transport problems in-volving tactical and daily decisions. These include, among others, the Trimble Forest Logistics and Opti-mization (FLO) system (USA), the Asset Forestry WSX Logistics system (New Zealand), the DESCARTES Route Planner (Canada), the SEON Compass Logistics system (formerly ESRI ArcLogistics), the TRUCK SCHEDULER system (Canada), and the ORTEC rout-ing optimization system (USA). A more detailed de-scription of these systems is given in Audy et al. (2012).
5. Decision support tools to optimize
timber and biomass transport
This chapter presents two decision support tools developed by the author of the paper, one that com-prises annual and monthly decisions (MCPLAN), and another that involves daily truck scheduling decisions (FastTRUCK).
5.1 MCPLAN
bio-mass, and flows from supply to demand points. It
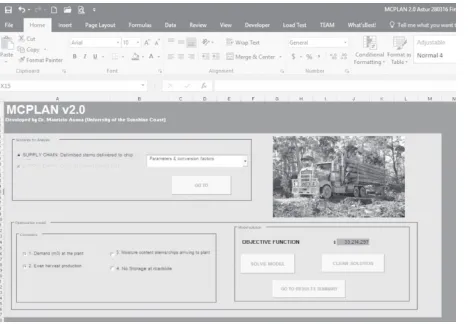
builds on and extends a previous tool named BIO-PLAN, which has been used to investigate alternative biomass supply chains in Europe and Australia (Acu-na et al. 2012a, Acu(Acu-na et al. 2012b). MCPLAN is a tool that runs a linear programming model implemented with Visual BasicTM macros and solved with the What’s
bestTM solver add-in for MS ExcelTM (Fig. 4).
MCPLAN uses moisture content (MC) curves as the driving factor for the optimization of supply chain costs, and the optimization tool is typically used to
in-vestigate the effect of MC on storage, chipping and
transportation costs of roundwood and biomass
deliv-ered to mills and energy plants under different MC,
operational, and drying scenarios. Geographical Infor-mation Systems (GIS) are used to get some of the inputs of MCPLAN. Some of these parameters include the availability of roundwood and biomass per supply area, the geographical location of supply and demand points, and the average transportation distances from supply areas to demand points. Centroids from supply areas are used to calculate the distance between supply and demand points (Sosa et al. 2015).
A basic formulation of the optimization model implemented in MCPLAN considers two products (roundwood and biomass), multiple supply points and demand destinations for both products (pulp mill and energy plant in the same location). Decisions on how much volume of roundwood and residues to be harvested and collected are made on a monthly basis (24 periods). Roundwood and residues are stacked at the roadside to reduce their transportation costs to the pulp mill and energy plant, which results from mov-ing materials with a reduced MC. In MCPLAN, stor-age of these materials at the roadside is allowed for up to 24 months, but the user can modify this nominal
period that best suits the problem under consider-ation. The optimal drying period is provided by the optimal solution of the linear programming model and does not exceed the maximum nominal drying period established in the model’s formulation. It is im-portant to mention that MCPLAN can be easily ex-tended to include roundwood for sawmills, as well as
dry matter content and volumetric losses, and losses resulting from fire, pests, etc.
It is also assumed that the residues can be stacked at the roadside for an equal or shorter period than the
roundwood. After the storage period, the roundwood
is transported to the pulp mill where it is chipped us-ing a static chipper, whereas the residues are chipped at the roadside with a mobile chipper and then trans-ported to the energy plant. Both roundwood and chips from residues are consumed during the same month in which they arrive at the energy plant and, therefore, there are no costs associated with the storage of round-wood at the pulp mill or chips from residues at the energy plant.
Also, it is assumed that the pulp mill and energy plant demand a monthly volume of roundwood and chips from residues during the production year (Year 2 for modeling purposes). However, both roundwood and residues may be harvested and stacked at the roadside for drying as from period 1 of Year 1. Thus,
the optimal solution specifies for each supply area,
when and how much volume of roundwood to har-vest, and for how long to stack the roundwood before
being delivered to the pulp mill. Likewise, it specifies
how much volume of residues to collect and stack for later chipping at the roadside and delivery to the en-ergy plant.
The model displays the results in a series of matri-ces including among others:
solid volume and tonnes of roundwood to be harvested and residues to be collected in each supply area and period
drying times for roundwood and residues in each supply area. These are generated from dry-ing models that include season, geographical location, local conditions, tree species, and tree dimensions, among others
loose volume of chips from roundwood pro-duced at the pulp mill
loose volume of chips from residues produced at the roadside in each supply area and period
volume of roundwood and chips from residues delivered to the pulp mill and energy plant from each supply area
number of truckloads delivered to the pulp mill and energy plant
energy content of chips produced from residues arriving at the energy plant
harvesting, forwarding, chipping, storage, and transportation costs.
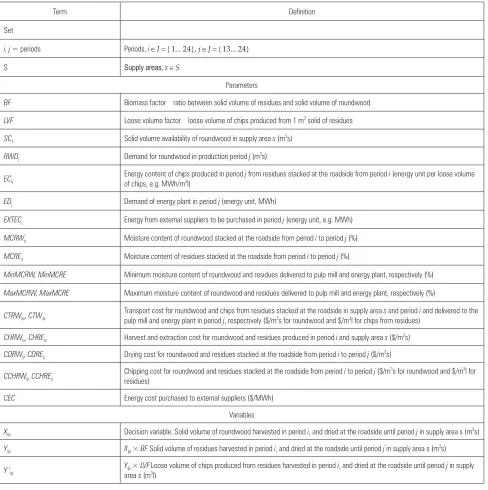
The sets, parameters, and variables used in the mathematical model implemented in MCPLAN area are listed in Table 2. The objective function is
present-ed in Equation 5, whereas the constraints are listpresent-ed in Equations 6 to 12.
The objective function presented in Equation 5 minimizes total supply chain costs including the fol-lowing components:
transport of roundwood and chips from residues
harvesting and extraction of roundwood and residues to roadside
drying of roundwood and residues at the road-side
Table 2 Sets, parameters, and variables used in MCPLAN’s model formulation
Term Definition
Set
i, j = periods Periods, i ÎI= {1... 24}, jÎJ = {13... 24}
S Supply areas,sÎS
Parameters
BF Biomass factor – ratio between solid volume of residues and solid volume of roundwood
LVF Loose volume factor – loose volume of chips produced from 1 m3 solid of residues
SCs Solid volume availability of roundwood in supply area s (m3s)
RWDj Demand for roundwood in production period j (m3s)
ECij
Energy content of chips produced in period j from residues stacked at the roadside from period i (energy unit per loose volume of chips, e.g. MWh/m3l)
EDj Demand of energy plant in period j (energy unit, MWh)
EXTECj Energy from external suppliers to be purchased in period j (energy unit, e.g. MWh)
MCRWij Moisture content of roundwood stacked at the roadside from period i to period j (%)
MCREij Moisture content of residues stacked at the roadside from period i to period j (%)
MinMCRW, MinMCRE Minimum moisture content of roundwood and residues delivered to pulp mill and energy plant, respectively (%)
MaxMCRW, MaxMCRE Maximum moisture content of roundwood and residues delivered to pulp mill and energy plant, respectively (%)
CTRWijs, CTWijs Transport cost for roundwood and chips from residues stacked at the roadside in supply area pulp mill and energy plant in period j, respectively ($/m3s for roundwood and $/m3l for chips from residues)s and period i and delivered to the
CHRWis, CHREis Harvest and extraction cost for roundwood and residues produced in period i and supply area s ($/m3s)
CDRWij, CDREij Drying cost for roundwood and residues stacked at the roadside from period i to period j ($/m3s)
CCHRWij, CCHREij
Chipping cost for roundwood and residues stacked at the roadside from period i to period j ($/m3s for roundwood and $/m3l for
residues)
CEC Energy cost purchased to external suppliers ($/MWh)
Variables
Xijs Decision variable. Solid volume of roundwood harvested in period i, and dried at the roadside until period j in supply area s (m3s)
Yijs Xijs × BF Solid volume of residues harvested in period i, and dried at the roadside until period j in supply area s (m3s)
chipping costs of roundwood (at the mill), and residues (at the roadside)
purchase of energy units delivered by external providers to the energy plant.
Also, the objective function includes a few assumptions: 1. Collection and extraction of roundwood and residues to roadside occur at the time of harvest; this cost varies by supply area and depends on the MC of roundwood and residues, 2. Drying cost only depends on the length of storage of roundwood and residues at the roadside, 3. Chip-ping cost depends on the MC of roundwood and residues. The assumption here is that chipChip-ping of materials with a reduced MC increase blades tear-out, which consequently, increases their maintenance and replacement costs.
Min=
∑
∑
∑
Xijs× + + + + sj
i ijs is ij ij
((CTRW CHRW CDRW CCHRW )
+
∑
∑
∑
Yijs× + +C +∑
∑
∑
Y ×CTW + sj
i is ij ij i j s ijs ijs
(CHRE CDRE CHRE ) ’
+
∑
EXTEC CECj×j
(5)
Equation 6 specifies that, in each supply area, the residues can be stacked at the roadside for an equal or
shorter period than the roundwood. The equation also ensures that the solid volume of residues stacked at the roadside does not exceed the availability of residues in the supply area.
Xijs BF Yijs i I s S
j i
× ≥ ∀ ∈ ∈
≤
∑
, (6)Equation 7 ensures that the capacity of roundwood in each supply area is not exceeded.
Xijs SC s Ss
j i
≤ ∀ ∈
∑
∑
(7)Equation 8 ensures that the demand for roundwood at the pulp mill is met in each period.
Xijs RWDj j J
s i
= ∀ ∈
∑
∑
(8)Equation 9 ensures that the demand for energy at the energy plant is met in each period. The energy supply includes deliveries from harvest areas and the energy purchased from external providers.
( ’Y EC ) EXTEC ED j J
s
i
∑
ijs ij j j∑
× + = ∀ ∈ (9)Equations 10 and 11 are optional and ensure that the roundwood and chips from residues are delivered with a certain MC range to the pulp mill and energy plant, respectively.
Xijs MinMCRW X MCRW X MaxMCRW j J
s
i
∑
i s ijs ij i s ijs∑
× ≤∑
∑
× ≤∑
∑
× ∀ ∈ (10)Y’ijs MinMCRE Y’ MCRE Y’ MaxMCRE j J
s
i
∑
i s ijs ij i s ijs∑
× ≤∑
∑
× ≤∑
∑
× ∀ ∈ (11)Equation 12 establishes the non-negativity of decision variable Xijk.
Xijk≥ ∀ ∈0, i I j J k K, ∈ , ∈ (12)
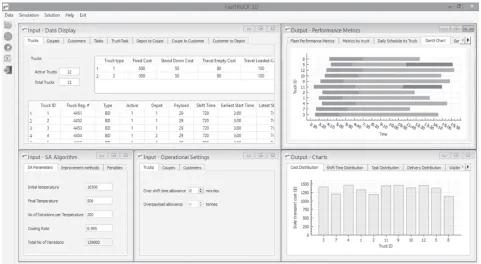
5.2 FastTRUCK
FastTRUCK is a software tool developed to assist transport and forest managers in solving the daily truck
scheduling problem. FastTRUCK uses a standard Simulated Annealing (SA) procedure, which is encoded in the C++ programming language, using an object-oriented design. The tool has been implemented in the Qt program-ming framework to provide users with a friendly graphical interface (Fig. 5) so that they can easily import input data from MS ExcelTM, review and modify parameters, display numerical and graphical solutions, and export
The use of FastTRUCK allows forest companies to reduce costs in their daily transport operations, and its
integration with flow optimization tools such as MC
-PLAN (which provides the transport tasks that are used as an input by FastTRUCK), provide solutions
that help pinpoint inefficiencies across the planning
spectrum which involves annual, monthly and daily transport decisions. Also, the tool can be used to run scenarios that allow transport planners to design bet-ter haulage contracts as well as optimize truck design
and fleet configuration. During dispatching, the tool can also assist truck dispatchers in making better
real-time decisions, in particular, when unforeseen events such as breakdowns, changes in mill demand, and harvest site and mill closures occur during the daily transport operations.
FastTRUCK includes SA heuristics as an optimiza-tion engine in combinaoptimiza-tion with a deterministic discrete
event simulation to emulate the movement of trucks throughout the day. In each iteration, the optimization engine allocates trucks to transport tasks, minimizing the number of trucks required and the waiting times at origins and destinations while meeting demand at mills. Also, the system checks the availability and ca-pacity of the trucks and their current location,
review-ing the current operational constraints, such as shift
length, closing times of harvest sites and mills, and the
tasks that can be performed by each truck in the fleet.
The tool requires several input parameters to per-form the simulations and come up with optimal solu-tions. These parameters need to be collected daily and include data about trucks, supply points and demand points, transport tasks, travel distances and travel times (Table 3). The daily transport tasks to be per-formed must be known in advance; each of them is comprised of a wood pickup point, a customer site,
Fig. 5 Graphical user interface of FastTRUCK scheduler
Table 3 Inputs required by FastTRUCK
Trucks Supply points Demand points Tasks Travel distance/time
1 Truck configuration 1 Number of active supply points 1 Number of active demand points 1 Supply point 1 Depot to coupe
2 Operational and fixed costs 2 Starting and ending working time 2 Starting and ending working time 2 Demand point 2 Coupe to customer
3 Maximum legal payload 3 Loading time 3 Unloading time 3 Product type 3 Customer to coupe
and the product to be delivered (in case multiple prod-uct combinations are produced by the logging crews at the wood pickup point).
In the simulation system, the events for the trucks (departures, arrivals, loading, unloading) are derived from known routes with their associated travel dis-tances and times which are used as inputs. Usually, a forestry company will specify the roads to be traveled by each haulage contractor. Also, in allocating trucks to transport tasks, the planners must know which trucks can perform which tasks, as some of the trucks
configurations cannot access some of the wood pick
up points due to their size or weight.
Four basic types of trips are performed by the trucks:
an empty trip from the truck’s depot to a wood pickup location
a loaded trip from a wood pickup location to a customer site
an empty trip from a customer site back to a wood pickup location
an empty trip from a customer site to the truck’s depot at the end the day.
On completion of any of these trips, the distance and time traveled between the origin and destination locations are calculated, and the system updates the
total distance, time and cost accordingly. The first trip
to a wood pickup location must be completed before or at the latest starting point of the loader’s time win-dow. If during the arrival to a wood pickup point or customer site there is another truck being loaded or unloaded, the truck must wait until the loading or un-loading equipment becomes available. This waiting time is added to the total time and cost for the truck.
As a task is performed, the system updates the total number of tasks being completed to that point and compares them with the total number of loads planned for the day. Performing all the transport tasks planned for the day is critical to get a minimum cost solution as a penalty is applied for every task that is planned but not performed.
Once a run is completed, FastTRUCK provides a
report containing critical statistics at a fleet and truck level. These include among others, optimal fleet size,
total and unit cost, daily volume moved from wood pickup points to customer sites, average truck utiliza-tion, and average waiting time. In addition to perfor-mance metrics, the model generates a work schedule for the trucks which can be used as a guide by dis-patchers to control the allocation of trucks to tasks dur-ing the day. In the case of unforeseen events, they can manually adjust the solution to consider these factors. This optimized plan is the least-cost way of routing trucks to satisfy the demand for products and typi-cally provide solutions that lead to substantial
reduc-tions in costs resulting from a more efficient way to
route the trucks, maximizing their utilization and avoiding delays at pickup points and customer sites.
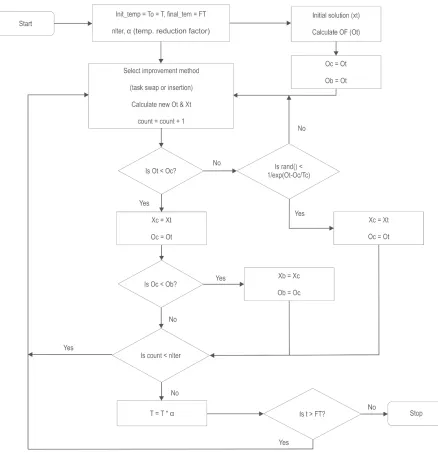
Fig. 6 shows a reduced version of the SA algo-rithm implemented in FastTRUCK, which allows obtaining near-optimal solutions in a very short time (usually in less than 10 minutes). More details of the design and implementation of the algorithm are found in Acuna and Sessions (2014).
6. Conclusions
This paper has presented an extensive overview of the transport and biomass optimization problem in the forest industry, including a detailed description of mathematical solutions, including linear program-ming models and algorithms, to solve complex trans-portation planning problems involving annual, monthly and daily decisions. Also, the paper presents and describes two decision support tools, MCPLAN and FastTRUCK, which have been implemented to as-sist transport planners from the Australian forest
in-dustry to optimize the flows of timber and biomass
from the forest to mills and energy plants, and the
ef-ficient routing of trucks that transport those products.
Given that the transport of timber and biomass
rep-resents a significant proportion of the operational cost
for the forest industry, there is a big opportunity for the implementation of Operations Research (OR) solu-tions so that companies can organize their transport
operations and allocate resources efficiently, and re -duce the impact of transport operations on the envi-ronment. Moreover, acquiring technical knowledge and developing skills for the implementation of OR techniques will enable the forest industry, the forest operations research and teaching community, and our students, to develop innovative solutions that will help solve increasingly complex problems arising in the management of forest supply chains.
7. References
Acuna, M., Brown, M., Mirowski, L., 2011: Improving
for-estry transport efficiency through truck schedule optimiza
-tion: a case study and software tool for the Australian indus -try. Austro and FORMEC, October 9–12, Graz and Rein, Austria.
Acuna, M., Anttila, P., Sikanen, L., Prinz, R., Asikanen, A.,
2012a: Predicting and controlling moisture content to opti-mise forest biomass logistics. Croatian Journal of Forest En-gineering 33(2): 225–238.
Acuna, M., Mirowski, L., Ghaffariyan, M.R., Brown, M., 2012b: Optimising transport efficiency and costs in Austra -lian wood chipping operations. Biomass and Bioenergy 46: 291–300.
Acuna, M., Sessions, J., 2014: A simulated annealing algo-rithm to solve the log-truck scheduling problem. In: Simu-lated Annealing: Strategies, Potential Uses and Advantages. NOVA Science, 191–220.
Acuna, M., Canga, E., Sánchez-García, S., 2017. Aplicación de la herramienta de optimización logística MCPLAN para la
planificación del transporte de madera rolliza y biomasa: Un
caso de estudio en Asturias. (In Spanish). In: 7 Congreso For-estal Español. 26–30 Junio. Plasencia, Cáceres, Extremadura, España.
Audy, J., D’Amours, S., Rönnqvist, M., 2012: Planning meth-ods and decision support systems in vehicle routing prob-lems for timber transportation: a review. Quebec, Canada, Interuniversity Research Centre on Enterprise Networks, Logistics and Transportation: 38–45.
Bettinger, P., Siry, J., Boston, K., Grebner, D.L., 2008: Forest
Management and Planning. Academic Press, 331 p. Carlsson, D., Rönnqvist, M., 1998: Tactical planning of for-estry transportation with respect to backhauling, Report LiTH-MAI-R-1998–18, Linköping University, Sweden. Devlin, G., Sosa, A., Acuna M., 2016: Solving the woody sup-ply chain for Ireland’s expanding biomass sector: a case
Church, R.L., 2007. Tactical-level forest management models. Handbook on Operations Research in Natural Resources. Weintraub, A., Romero, C., Bjørndal, T., Epstein, R. (eds), Springer, New York, 343–363.
D’Amours, S., Rönnqvist, M., Weintraub, A., 2008: Using op-erational research for supply chain planning in the forest products industry. INFOR 46(4): 265–281.
Epstein, R., Karlsson, J., Rönnqvist, M., Weintraub, A., 2007: Forest transportation. In Handbook on Operations Research in Natural Resources. Weintraub, A., Romero, C., Bjørndal, T., Epstein, R. (eds), Springer, New York, 391–403.
Forsberg, M., Frisk, M., Rönnqvist, M., 2005: FlowOpt – a decision support tool for strategic and tactical transportation planning in forestry. International Journal of Forest Engineer-ing 16(2): 101–114.
Gronalt, M., Hirsch, P., 2007: Log-truck scheduling with a tabu search strategy. In: Doerner, K.F., Gendreau, M., Grei-storfer, P., Gutjahr, W.J., Hartl, R.F., Reimann, M. (Eds.). Me-taheuristics – Progress in Complex Systems Optimization. New York: Springer, 65–88.
Haridass, K., 2009: Optimization and scheduling of a pooled log transport system. Master of Science thesis. Auburn Uni-versity, USA, 92 p.
Kanzian, C., Holzleitner, F., Stampfer, K., Ashton, S., 2009: Regional Energy Wood Logistics – Optimizing Local Fuel Supply. Silva Fennica 43(1): 113–128.
Marier, P., Audy, J.-F., Gingras, C., D’Amours, S., 2007: Col-laborative wood transportation with the Virtual
Transporta-tion Manager. In: Blanchet, P., (Eds.). InternaTransporta-tional Scientific
Conference on Hardwood Processing, September 24–26, Quebec City, Canada. Quebec: FPInnovations-Forintek, 191– 198.
McDonald, T., Taylor, S., Valenzuela, J., 2001: Potential for shared log transport services. In: Wang, J., Wolford, M., Mc-Neel, J., (Eds.). 24th Annual COFE Meeting, July 15–19
Snow-shoe, USA. Corvallis: Council on Forest Engineering, 115– 120.
McDonald, T., Haridass, K., Valenzuela, J., 2010: Mileage sav-ing from optimization of coordinated trucksav-ing. In: 33rd
An-nual COFE Meeting. June 6–9 Auburn, USA.
Oberscheider, M., Zazgornik, J., Henriksen, C. B., Gronalt, M., Hirsch, P., 2013: Minimizing driving times and green-house gas emissions in timber transport with a near-exact solution approach. Scandinavian Journal of Forest Research 28(5): 493–506.
Palmgren, M., 2001. Optimisation methods for log truck scheduling. Theses No. 880. LiU-TEK-LIC-2001:17, Linköping University, Sweden.
Palmgren, M., Rönnqvist, M., Varbrand, P., 2004: A near-exact method for solving the log-truck scheduling problem. International Transactions of Operations Research 11(4): 447–464.
Rey, P.A., Muñoz, J.A., Weintraub, A., 2009: A column gen-eration model for truck routing in the Chilean forest industry. Information Systems and Operational Research 47(3): 215– 221.
Rönnqvist, M., Sahlin, H., Carlsson, D., 1998: Operative plan-ning and dispatching of forestry transportation. Research paper LiTH-MAT-R-1998-18, Linköping University, Sweden. Rönnqvist, M., 2003: Optimization in forestry. Mathematical Programming 9(1–2): 267–284.
Rummukainen, H., Kinnari, T., Laakso, M., 2009: Optimiza-tion of wood transportaOptimiza-tion. In: Madetoja E., Niskanen H., Hämäläinen J. (Eds.). Papermaking Research Symposium, Kuopio, Finland, June 1–4, Kuopio: University of Kuopio. Shen, Z., Sessions, J., 1989: Log truck scheduling by network programming. Forest Products Journal 39(10): 47–50. Sosa, A., Acuna, M., McDonnell, K., Devlin, G., 2015: Manag-ing the moisture content of wood biomass for the optimisa-tion of Ireland’s transport supply strategy to bioenergy mar-kets and competing industries. Energy 86: 354–368.
Taja, H.A., 2016: Operations Research: An Introduction. 10th
Edition. Pearson, 848 p.
Weintraub, A., Epstein, R., Morales, R., Serón, J., Traverso, P.,
1996: A truck scheduling system improves efficiency in the
forest industries. Interfaces 26(4): 1–12.
Weintraub, A., Romero, C., Bjørndal, T., Epstein, R., 2007: Handbook of Operation Research in Natural Resources. Springer, New York.
Received: December 1, 2016 Accepted: May 24, 2017
Authors’ address: Mauricio Acuna, PhD. e-mail: [email protected]
AFORA – University of Sunshine Coast Private bag 12