Open Access
Debate
Assessing subgroup effects with binary data: can the use of different
effect measures lead to different conclusions?
Ian R White*
1and Diana Elbourne
2Address: 1MRC Biostatistics Unit Institute of Public Health, Robinson Way, Cambridge CB2 2SR, UK and 2Medical Statistics Unit London School
of Hygiene and Tropical Medicine, Keppel Street, London WC1E 7HT, UK
Email: Ian R White* - [email protected]; Diana Elbourne - [email protected] * Corresponding author
Abstract
Background: In order to use the results of a randomised trial, it is necessary to understand whether the overall observed benefit or harm applies to all individuals, or whether some subgroups receive more benefit or harm than others. This decision is commonly guided by a statistical test for interaction. However, with binary outcomes, different effect measures yield different interaction tests. For example, the UK Hip trial explored the impact of ultrasound of infants with suspected hip dysplasia on the occurrence of subsequent hip treatment. Risk ratios were similar between subgroups defined by level of clinical suspicion (P = 0.14), but odds ratios and risk differences differed strongly between subgroups (P < 0.001).
Discussion: Interaction tests on different effect measures differ because they test different null hypotheses. A graphical technique demonstrates that the difference arises when the subgroup risks differ markedly. We consider that the test of interaction acts as a check on the applicability of the trial results to all included subgroups. The test of interaction should therefore be applied to the effect measure which is least likely a priori to exhibit an interaction. We give examples of how this might be done.
Summary: The choice of interaction test is especially important when the risk of a binary outcome varies widely between subgroups. The interaction test should be pre-specified and should be guided by clinical knowledge.
Background
Subgroup analysis
Any randomised controlled trial, however tight its inclu-sion and excluinclu-sion criteria, recruits individuals who differ in many observed and unobserved ways. Different indi-viduals are rarely likely to respond to intervention in exactly the same way, so the intervention effect within carefully defined subgroups is of interest. Unfortunately, analysis of a trial within subgroups is usually underpow-ered: results often have wide confidence intervals and lack
statistical significance, even when the trial intervention is beneficial. Further, repeating an analysis within several subgroups greatly increases the risk of false positive find-ings [1]. Subgroup analysis must therefore be treated cau-tiously, and "the overall trial result is usually a better guide to the direction of effect in subgroups than the apparent effect observed within a subgroup" [2].
When a trial outcome is binary, a number of different effect measures are available [3]: the risk difference or
Published: 29 April 2005
BMC Medical Research Methodology 2005, 5:15 doi:10.1186/1471-2288-5-15
Received: 13 December 2004 Accepted: 29 April 2005
This article is available from: http://www.biomedcentral.com/1471-2288/5/15
© 2005 White and Elbourne; licensee BioMed Central Ltd.
absolute benefit, which is easily translated into the clini-cally relevant number needed to treat [4]; the risk ratio, which is widely understood [5]; or the odds ratio, which has desirable statistical properties [6,7]. Further, the risk ratio for benefits gained differs from the risk ratio for harm avoided. Subgroups that are identical on one of these effect measures are not usually identical on a differ-ent effect measure. For example, if intervdiffer-ention halves the risk in each subgroup, and the subgroups themselves have different risks, then the risk differences differ between subgroups.
When subgroups have different risks, it is common to esti-mate an overall risk ratio and then, using the control group risk in each subgroup, to infer the subgroup-specific risk difference and number needed to treat [8]. In this approach, the estimated absolute benefit of intervention is proportional to the control group risk. However, this assumes the risk ratio is equal across subgroups. In mak-ing a treatment decision about a particular patient, there-fore, the clinician makes best use of the evidence base by ignoring possible differences in the chosen measure of treatment effect between subgroups. It is important to have tools to indicate when this is inappropriate.
Interaction
The statistical test of interaction is a useful tool in this dilemma. In statistical language, interaction is the differ-ence between the intervention effects in different sub-groups, and the null hypothesis is that the intervention effect is equal across subgroups [9-12]. A statistically sig-nificant interaction supports placing more weight on sub-group-specific findings, especially if it arises from one of a small number of pre-defined subgroup analyses. On the other hand, a non-significant interaction suggests that the overall trial findings should inform individual interven-tion decisions. The clinical plausibility and importance of
the subgroup-specific findings must also be taken into account [13].
It is useful to distinguish a qualitative interaction, in which intervention is beneficial in one subgroup but inef-fective or harmful in another, from a quantitative interac-tion in which interveninterac-tion is beneficial in all subgroups (or harmful in all) but the degree of benefit varies [14]. As an example of quantitative interaction, a large meta-anal-ysis showed that tamoxifen has benefit in treating both oestrogen-receptor-positive and oestrogen-receptor-nega-tive early breast cancer, but that the benefit is greater in the first group [15]. Such clear-cut statistically significant results are rare in single trials.
When the trial outcome is binary, discussion of interac-tions is further complicated by the variety of possible effect measures. Significance tests on the overall interven-tion effect are unaffected by the choice of measure, but the existence and strength of interactions depend on the effect measure used [16]. Quantitative interactions can usually be removed by changing the effect measure, but qualita-tive interactions cannot be removed in this way.
UK Hip trial
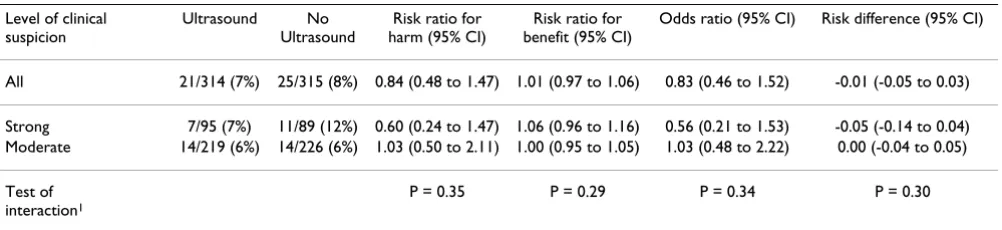
We explore these issues in the context of the UK Hip trial [17]. This trial aimed to show that diagnostic ultrasound in the management of infants with suspected develop-mental hip dysplasia reduced overall treatment (mainly splinting) without doubling the risk of operative treat-ment. Note that treatment is an outcome in this trial. Results were reported as risk ratios for operative treatment comparing ultrasound with no ultrasound. The observed risks were 21/314 (7%) and 25/315 (8%) respectively, so the overall risk ratio was 0.84 with a 95% confidence interval from 0.48 to 1.47, suggesting that risk of opera-tive treatment was not doubled. In Table 1 this risk ratio for operative treatment is termed "risk ratio for harm".
Table 1: Operative treatment in the UK Hip trial
Level of clinical suspicion
Ultrasound No Ultrasound
Risk ratio for harm (95% CI)
Risk ratio for benefit (95% CI)
Odds ratio (95% CI) Risk difference (95% CI)
All 21/314 (7%) 25/315 (8%) 0.84 (0.48 to 1.47) 1.01 (0.97 to 1.06) 0.83 (0.46 to 1.52) -0.01 (-0.05 to 0.03)
Strong 7/95 (7%) 11/89 (12%) 0.60 (0.24 to 1.47) 1.06 (0.96 to 1.16) 0.56 (0.21 to 1.53) -0.05 (-0.14 to 0.04) Moderate 14/219 (6%) 14/226 (6%) 1.03 (0.50 to 2.11) 1.00 (0.95 to 1.05) 1.03 (0.48 to 2.22) 0.00 (-0.04 to 0.05)
Test of interaction1
P = 0.35 P = 0.29 P = 0.34 P = 0.30
Infants fell into two subgroups defined by level of clinical suspicion prior to randomisation: strong suspicion, defined as "sufficient to warrant early prophylactic splinting", or moderate suspicion, defined as "sufficient to warrant further specialist examination". The risk ratio for the moderate-suspicion subgroup (Table 1) has a 95% confidence interval that includes a doubling of the risk of operative treatment. However, the risk ratios are not sig-nificantly different on an interaction test (P = 0.35). This suggests using the overall relative risk of 0.84, with its upper confidence limit of 1.47, as applying to both groups.
Alternative analyses based on the other effect measures are shown in the last three columns of Table 1. The risk ratios for benefit (the risk ratios for avoiding operative treat-ment) are all near 1, because the outcome event is rare. For the same reason, the odds ratio is numerically similar to the risk ratio. The risk difference is numerically very dif-ferent. However, all four effect measures give very similar significance levels on the interaction test.
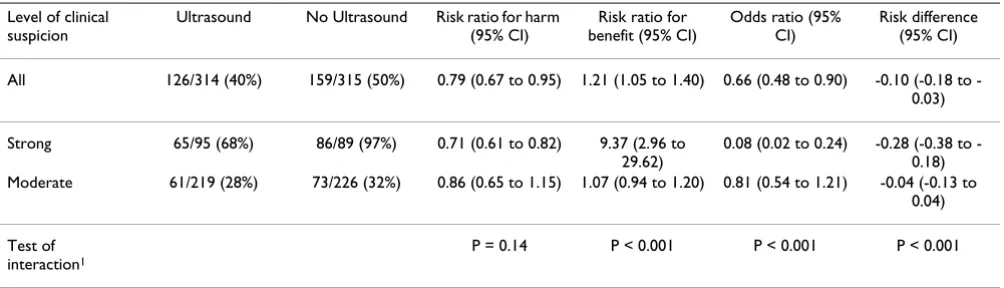
A second outcome measure in the UK Hip trial was the occurrence of any hip treatment (Table 2). Clinical suspi-cion is a strong prognostic factor for this outcome: in the no-ultrasound arm, 97% of the strong-suspicion group but only 32% of the moderate-suspicion group received hip treatment. The risk ratios, risk differences and odds ratios all show a larger effect in the strong-suspicion sub-group. However, the risk ratios for harm do not differ sig-nificantly between subgroups, yet the risk ratios for benefit, the risk differences and the odds ratios all have highly statistically significant differences between subgroups.
Discussion
Why do interaction tests differ?
Interaction tests on different scales differ because they are testing different null hypotheses. In the UK Hip trial, ultrasound reduced the risk of any hip treatment from 97% to 68% in the strong-suspicion group. Under the null hypothesis of a common risk ratio for hip treatment, the 32% risk in the moderate-suspicion group would be reduced to 23%, but the null hypothesis of a common risk difference implies a reduction to 4.1%, and the null hypothesis of a common odds ratio implies a reduction to 3.5%. The observed reduction to 28% is consistent only with the null hypothesis of a common risk ratio. A com-mon risk ratio for avoiding hip treatment is not possible, since the risk ratio is over 9 in the strong-suspicion group, and multiplying the 68% risk of avoiding hip treatment in the strong-suspicion group by 9 would result in a risk over 100%.
When do interaction tests differ markedly?
A graph of the event fraction in the ultrasound group against the event fraction in the no-ultrasound group is helpful (Figure 1) [18]. Points below the diagonal line indicate a lower event fraction in the ultrasound group. The large dots represent the results for the two subgroups. The curved line shows results that have the same odds ratio as the strong-suspicion subgroup, while other lines show results that have the same risk difference or risk ratio. The moderate-suspicion subgroup lies closest to the line of a common risk ratio for harm. It is clear from Fig-ure 1 that the choice of effect measFig-ure matters most when the subgroup risks differ markedly.
Which interaction test is best?
Since the four interaction tests may differ markedly, it is important to make a careful choice. An intuitive approach is to perform the interaction analysis on the same scale on
Table 2: Any hip treatment in the UK Hip trial
Level of clinical suspicion
Ultrasound No Ultrasound Risk ratio for harm (95% CI)
Risk ratio for benefit (95% CI)
Odds ratio (95% CI)
Risk difference (95% CI)
All 126/314 (40%) 159/315 (50%) 0.79 (0.67 to 0.95) 1.21 (1.05 to 1.40) 0.66 (0.48 to 0.90) 0.10 (0.18 to -0.03)
Strong 65/95 (68%) 86/89 (97%) 0.71 (0.61 to 0.82) 9.37 (2.96 to 29.62)
0.08 (0.02 to 0.24) 0.28 (0.38 to -0.18) Moderate 61/219 (28%) 73/226 (32%) 0.86 (0.65 to 1.15) 1.07 (0.94 to 1.20) 0.81 (0.54 to 1.21) -0.04 (-0.13 to
0.04)
Test of interaction1
P = 0.14 P < 0.001 P < 0.001 P < 0.001
which the results are to be presented [19]. For example, clinical trial results are often presented on the risk ratio for harm scale, so the interaction analysis would test equality of these risk ratios. However, there are other considerations.
Deeks discussed selection of an effect measure or sum-mary statistic in meta-analysis [16]. His aim was to find a summary statistic that is most plausibly equal in all trials, including those with different control group risks, in order to best predict the treatment benefit for various patient types. One way is to select an effect measure for which the subgroup-specific results are comparable, as judged by the interaction test. In meta-analysis, the effect measure
min-imising the Q (heterogeneity) statistic could be used. Using this approach in the UK Hip trial, the results for any hip treatment would have been reported on the risk ratio for harm scale, regardless of what had been planned. However, Deeks argues that this is problematic with the typically small number of trials in a meta-analysis. Instead, the choice of effect measure should use both clin-ical knowledge and empirclin-ical evidence. For example, given the clinical view that absolute benefit is likely to be greatest in those with greatest risk, the risk ratio for harm would appear the best effect measure. Empirically, Deeks shows that the risk ratio for harm and the odds ratio are more frequently homogeneous between trials than the
UK Hip trial: results for any treatment in strong-suspicion and moderate-suspicion subgroups Figure 1
UK Hip trial: results for any treatment in strong-suspicion and moderate-suspicion subgroups. Points on the red diagonal line indicate lack of effect; points on the other lines indicate the same risk difference (RD), risk ratio for harm (RR(H)), risk ratio for benefit (RR(B)) or odds ratio (OR) as in the strong-suspicion subgroup.
No effect
OR=0.08
RD=−0.28
RR(H)=0.71
RR(B)=9.37
Strong
suspicion
Moderate
suspicion
0
.2
.4
.6
.8
1
Ultrasound group event fraction
0
.2
.4
.6
.8
1
risk ratio for benefit and the risk difference, supporting their wider use.
Deeks' arguments apply to meta-analysis, and we would not apply them to subgroup analysis within clinical trials. Instead, we view interaction tests as a check on the applicability of the trial results to all included subgroups. Investigators start with the belief that all subgroups recruited to the trial have qualitatively similar responses to intervention. It is reasonable to maintain that belief if it can be shown to be consistent with the data. We there-fore propose that investigators should identify the effect measure that is most likely to be similar between sub-groups. By carefully specifying this measure in advance, they ensure that the interaction test has maximum scien-tific validity.
For example, suppose that the investigators designing the UK Hip trial had predicted that 95% and 30% of the two subgroups would receive treatment in the absence of ultrasound. They could then have asked: if ultrasound reduced the proportion in the first subgroup from 95% to 70%, what effect is likely in the second subgroup? A reduction from 95% to 70% represents a risk ratio for harm of 0.74, which would reduce 30% to 22% in the sec-ond subgroup. A reduction from 95% to 70% also repre-sents an odds ratio of 0.12 and a risk difference of 25 percentage points, both of which (by coincidence) would reduce 30% to 5% in the second subgroup. A common risk ratio for benefit is impossible with these numbers, as noted above. The choice among these possibilities will draw on investigators' knowledge and experience. If the investigators believed that all infants are equally able to be saved from treatment, then a common risk ratio for harm would be plausible. If on the other hand the lower treat-ment rate in the second subgroup implies less pathology and hence greater potential for avoiding treatment, then a common odds ratio might be more plausible.
As another example, consider a trial of a community inter-vention to promote vaccination. Suppose that the expected unvaccinated fractions in two subgroups are 20% and 80% without the intervention, and that the intervention is expected to halve the unvaccinated fraction in the first subgroup. If the difference between subgroups stems from a lack of previous vaccination campaigns, then all unvaccinated individuals would be equally likely to be vaccinated under the intervention, so the second sub-group would see a reduction to 40% – a common risk ratio of 0.5. But if the difference between subgroups stems from the second subgroup's greater suspicion of vaccina-tion, then their likely reduction would be smaller – per-haps to the figure of 64% which represents a common odds ratio of 0.44.
We would usually prefer primary results to be presented on the scale selected for interaction testing. While it may be appropriate to present subgroup-specific results on a different scale, it would not be correct to use that scale for a single summary measure over the whole trial. For exam-ple, subgroups with equal odds ratios usually have une-qual risk ratios, so a single summary risk ratio as proposed by Zheng and Yu [20] would generally be inappropriate. Just as a single risk ratio may be used to compute separate risk differences or numbers needed to treat, so a common odds ratio could be used to compute fitted risks in all sub-groups and hence to compute appropriate risk ratios, risk differences or numbers needed to treat.
Finally, the choice of effect measure for the interaction test is important because it may affect conclusions about the applicability of the overall results of a clinical trial to all subgroups. This choice should therefore be specified in advance of data analysis. The best place to do this is in a trial protocol or statistical analysis plan.
Conclusion
A statistical test of interaction is important in deciding whether the overall results of a randomised trial apply to all subgroups. When the outcome is binary, different effect measures may lead to very different results on the test of interaction. The choice of effect measure for the test of interaction should therefore be specified before analy-sis of the data. The best choice of effect measure for the test of interaction is that which the investigators believe is most likely to be similar between subgroups.
Competing interests
DE received funding from the Department of Health, via the Medical Research Council, for the UK Hip Trial [17]. Apart from this, neither author has a competing interest.
Authors' contributions
The original idea arose in discussion between the authors. IRW wrote the first draft. Both authors contributed to sub-sequent drafts and approved the final version.
Acknowledgements
We thank Simon Thompson, MRC Biostatistics Unit, and Chris Frost, Lon-don School of Hygiene and Tropical Medicine, for their comments on ear-lier drafts of this paper.
References
1. Assmann SF, Pocock SJ, Enos LE, Kasten LE: Subgroup analysis and other (mis)uses of baseline data in clinical trials.Lancet 2000,
355:1064-1069.
2. Yusuf S, Wittes J, Probstfield J, Tyroler HA: Analysis and interpre-tation of treatment effects in subgroups of patients in rand-omized clinical trials.Journal of the American Medical Association
1991, 266:93-98.
3. Walter SD: Choice of effect measure for epidemiological data.
Publish with BioMed Central and every scientist can read your work free of charge
"BioMed Central will be the most significant development for disseminating the results of biomedical researc h in our lifetime."
Sir Paul Nurse, Cancer Research UK
Your research papers will be:
available free of charge to the entire biomedical community
peer reviewed and published immediately upon acceptance
cited in PubMed and archived on PubMed Central
yours — you keep the copyright
Submit your manuscript here:
http://www.biomedcentral.com/info/publishing_adv.asp
BioMedcentral 4. Cook RJ, Sackett DL: The number needed to treat: a clinically
useful measure of treatment effect.British Medical Journal 1995,
310:452-4.
5. Altman DG, Deeks JJ, Sackett DL: Odds ratios should be avoided when events are common.British Medical Journal 1998, 317:1318. 6. Cox DR: Interaction.International Statistical Review 1984, 52:1-31. 7. Senn S: Rare Distinction and Common Fallacy.British Medical
Journal 1999 [http://bmj.bmjjournals.com/cgi/eletters/317/7168/1318]. accessed 9 August 2004
8. Furukawa T, Guyatt G, Griffith L: Can we individualize the "number needed to treat"? An empirical study of summary effect measures in meta-analyses. International Journal of Epidemiology 2002, 31:72-76.
9. Altman DG, Matthews JNS: Interaction 1: Heterogeneity of effects.British Medical Journal 1996, 313:486.
10. Matthews JNS, Altman DG: Interaction 2: Compare effect sizes not P values.British Medical Journal 1996, 313:808.
11. Matthews JNS, Altman DG: Interaction 3: How to examine heterogeneity.British Medical Journal 1996, 313:862.
12. Altman DG, Bland JM: Statistics Notes: Interaction revisited: the difference between two estimates.British Medical Journal
2003, 326:219.
13. Oxman AD, Guyatt GH: A consumer's guide to subgroup analysis.Annals of Internal Medicine 1992, 116:78-84.
14. Peto R: Statistical aspects of cancer trials. In Treatment of Cancer
Edited by: Halnan KE. London:Chapman and Hall; 1982:867-871. 15. Cuzick J, Powles T, Veronesi U, Forbes J, Edwards R, Ashley S, Boyle
P: Overview of the main outcomes in breast-cancer preven-tion trials.Lancet 2003, 361:296-300.
16. Deeks JJ: Issues in the selection of a summary statistic for meta-analysis of clinical trials with binary outcomes.Statistics in Medicine 2002, 21:1575-1600.
17. Elbourne D, et al.: Ultrasonography in the diagnosis and man-agement of developmental hip dysplasia (UK Hip trial).Lancet
2002, 360:2009-2017.
18. Javier Jimenez F, Guallar E, Martin-Moreno JM: A graphical display useful for meta-analysis.Eur J Public Health 1997, 7:101-105. 19. Mehrotra DV: Stratification issues with binary endpoints.Drug
Information Journal 2001, 35:1343-1350.
20. Zhang J, Yu KF: What's the relative risk? A method of correct-ing the odds ratio on cohort studies of common outcomes.
Journal of the American Medical Association 1998, 280:1690-1.
Pre-publication history
The pre-publication history for this paper can be accessed here: