M E T H O D O L O G Y
Open Access
An improved allele-specific PCR primer design
method for SNP marker analysis and its
application
Jing Liu
1†, Shunmou Huang
1†, Meiyu Sun
1, Shengyi Liu
1, Yumei Liu
2, Wanxing Wang
2, Xiurong Zhang
1,
Hanzhong Wang
1and Wei Hua
1*Abstract
Background:Although Single Nucleotide Polymorphism (SNP) marker is an invaluable tool for positional cloning, association study and evolutionary analysis, low SNP detection efficiency by Allele-Specific PCR (AS-PCR) still restricts its application as molecular marker like other markers such as Simple Sequence Repeat (SSR). To overcome this problem, primers with a single nucleotide artificial mismatch introduced within the three bases closest to the 3’end (SNP site) have been used in AS-PCR. However, for one SNP site, nine possible mismatches can be generated among the three bases and how to select the right one to increase primer specificity is still a challenge. Results:In this study, different from the previous reports which used a limited quantity of primers randomly (several or dozen pairs), we systematically investigated the effects of mismatch base pairs, mismatch sites and SNP types on primer specificity with 2071 primer pairs, which were designed based on SNPs fromBrassica oleracea 01-88 and 02-12. According to the statistical results, we (1) found that the primers designed with SNP (A/T), in which the mismatch (CA) in the 3rdnucleotide from the 3’end, had the highest allele-specificity (81.9%). This information could be used when designing primers from a large quantity of SNP sites; (2) performed the primer design principle which forms the one and only best primer for every SNP type. This is never reported in previous studies. Additionally, we further identified its availability in rapeseed (Brassica napus L.) and sesame (Sesamum indicum). High polymorphism percent (75%) of the designed primers indicated it is a general method and can be applied in other species.
Conclusion:The method provided in this study can generate primers more effectively for every SNP site compared to other AS-PCR primer design methods. The high allele-specific efficiency of the SNP primer allows the feasibility for low- to moderate- throughput SNP analyses and is much suitable for gene mapping, map-based cloning, and marker-assisted selection in crops.
Keywords:SNP, AS-PCR, Mismatch, Polymorphism, Destabilization
Introduction
Single Nucleotide Polymorphisms (SNPs) are single base differences between DNA of different individuals. Once discovered, SNPs can be converted into genetic markers that can be assayed [1,2]. As the most abundant and sta-bile form of genetic variation in most organism
genomes, SNPs are more suitable for genotyping mar-kers compared to the conventional marmar-kers such as RFLP (Restriction fragment length polymorphism), AFLP (Amplified fragment length polymorphism) and SSR (Simple Sequence Repeat). With the development of bio-technology, SNPs are becoming favored genetic mar-kers that are used in marker-assisted breeding [3], map-based cloning [4], study of evolutionary conservations between different species [5,6], and the detection of risk-associated alleles linked to human diseases [7].
* Correspondence:[email protected]
†Equal contributors
1Key Laboratory of Biology and Genetic Improvement of Oil Crops, Ministry
of Agriculture, Oil Crops Research Institute of the Chinese Academy of Agricultural Sciences, Wuhan 430062, People’s Republic of China Full list of author information is available at the end of the article
Recently, massive parallel sequencing platforms such as GSFLX (Roche), Solexa (Illumina) and SOLID (Ap-plied Bios stems) have significantly reduced the cost of high throughout sequencing [8]. A large number of gen-omes and transcriptgen-omes have been rapidly sequenced using these new platforms to identify novel SNPs in maize [9], rapeseed [10] and human [11] etc. A large variety of techniques for high-throughput SNP genotyp-ing have also been developed usgenotyp-ing Taqman [12], Ampli-fluor [13], genome re-sequencing [14,15], and SNP arrays [16,17]. These techniques are expensive and re-quire specialized equipments, which cost more standard primers and are not practical for assaying low- to moderate-throughput SNPs. Hence, there is a need for simple and accurate genotyping assays that can be implemented in laboratories lacking access to sophisti-cated equipment.
Traditional SNP genotyping methods such as CAPs (The Cleaved Amplified Polymorphic Sequence), dCAPs (derived CAPS), and AS-PCR (Allele-specific PCR) are widely used for low-throughput applications in plant re-search. In application, CAPS and dCAPS are restricted by end nuclease sites that could be inefficient and not cost-effective [18-20]. AS-PCR is based on the extension of primer only when its 3’end is a perfectly complemen-ted to the template [21]. In principle, SNPs can be detected using allele-specific PCR primers based on the 3’ terminal nucleotide of a primer that corresponds to a specific SNP site. However, reliable discrimination be-tween the alleles is not sufficient to achieve using this described method. To overcome this problem, allele-specific primers with an additional base pair change within the three bases closest to the SNP site between alleles have been used [21,22]. Each specific SNP site in an allele can generate at least 18 possible primers with one mismatch base [23]. The SNAPER program gener-ates a list of up to 16 possible primers per SNP site for
each allele [23]. Therefore, choosing additional mis-matches to increase primer specificity has been a chal-lenge for AS-PCR [23]. Some studies have proposed criteria for designing AS-PCR primers. Hayashi et al (2004) proposed that base pair mismatches created through T-G or C-A transversions at third base from 3’ end could increase the allele-specificity [24]. Hirotsu et
al(2010) identified A-T transversion and A-G transition were useful base pair mismatches for improvement of allele-specific amplification [25]. The WASP tool could also be used to introduce mismatches at the penultimate (2nd to the terminal) base of the primer [26,27]. How-ever, most studies used only a limited quantity of pri-mers, which might have some influences on efficiency of SNP primer specificity.
In this study, over 2000 primer pairs, which were designed based on SNPs betweenB. oleracealines 01-88 and 02-12, were used to analyze the effects of different SNP types, mismatch bases and sites within the three bases closest to the 3’end on primer specificity. Based on these results, we advanced the SNP primer design principle. Compared to traditional SNP genotyping methods, our method could provide a cost-effective al-ternative for high efficient specific primers and would greatly facilitate plant research.
Results
SNP analysis ofB.oleracea01-88 and 02-12 genome sequences
The assembly of genome sequences of B.oleracea line 02-12 has been accomplished (unpublished). To identify SNPs between B. oleracea lines 01-88 and 02-12, gen-ome DNA of line 01-88 was re-sequenced and a total of 119 million reads were obtained. To get high-quality SNPs, the sequence data was subjected to stringent fil-tering: The reads from line 01-88 were compared to the sequences of line 02-12 using BLASTN. Sites containing
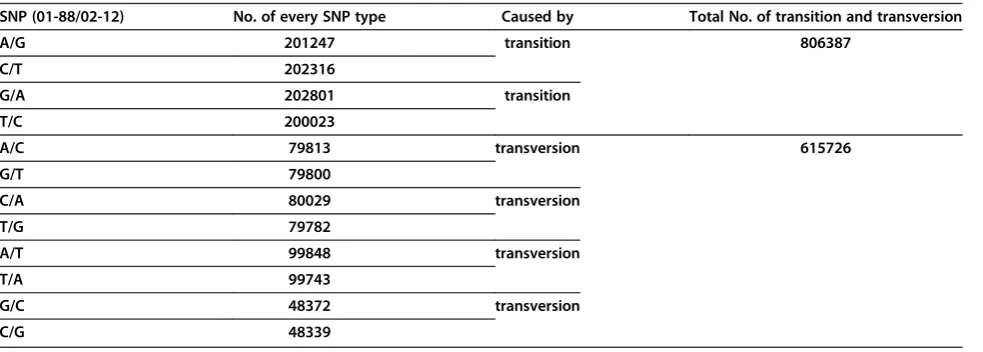
Table 1 Putative SNPs identified betweenB. oleraceagenomes of 01-88 and 02-12
SNP (01-88/02-12) No. of every SNP type Caused by Total No. of transition and transversion
A/G 201247 transition 806387
C/T 202316
G/A 202801 transition
T/C 200023
A/C 79813 transversion 615726
G/T 79800
C/A 80029 transversion
T/G 79782
A/T 99848 transversion
T/A 99743
G/C 48372 transversion
tri-allelic or high degree of polymorphism were omitted. The sequences containing over 8 reads mapped to unique sites in the genome sequence were extracted from line 01-88. Pair wise alignment was used to evalu-ate the SNPs between genome sequences of 01-88 and 02-12. The alignment result revealed a total of 1,422,113 SNPs existed between B. oleracealines 01-88 and 02-12 (an average of one SNP in every 360 bp fragment) (Table 1). Analysis to the SNPs showed over half (56.7%, 806387/1422113) of the nucleotide changes were transi-tions (A-G or C-T). Transversions (A-T, A-C, C-G and G-T) accounted for 43.3% (615726/1422113) of the detected SNPs (Table 1).
To further identify the putative SNPs and estimate the proportion of false positives, 96 SNP sites derived from only 8-read sequences were chosen randomly. Primers were designed according to the genome sequences near these SNP sites and all amplicons could generate about 500 bp fragments in which containing the corresponding SNPs. Sanger sequencing results showed 93 SNPs were identical with the putative SNPs and 3 SNPs were un-predicted or undetectable. This indicated a very high proportion of SNPs really existed between lines 01-88 and 02-12.
Design and efficiency detection of SNP primers
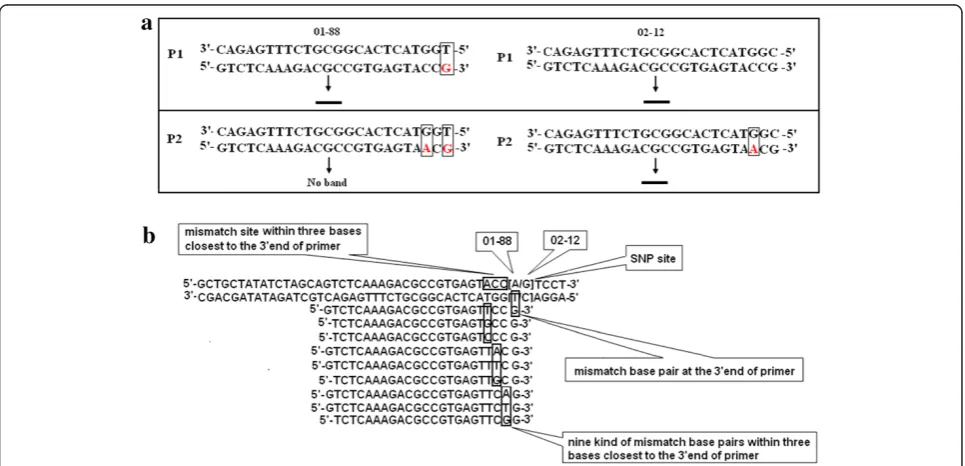
Primer design strategy for allele-specific PCR was illu-strated in Figure 1. Primer P1, which was designed based
on 02-12 genome sequence, formed a mismatch (TG) in 3’end with the DNA sequence of 01-88. While in most cases, it still could amplify the band with 01-88 effi-ciently. After introducing another mismatch (GA) in the 2nd site closest to the 3’end in primer P2, it could only amplify the band with 02-12 (Figure 1a). Based on the method described by Cha et al (1992), mismatch sites and mismatch bases closest to the SNP site were ran-domly chosen [21]. Therefore, nine possible mismatches could be generated among the three bases closest to 3’end of primer (Figure 1b).
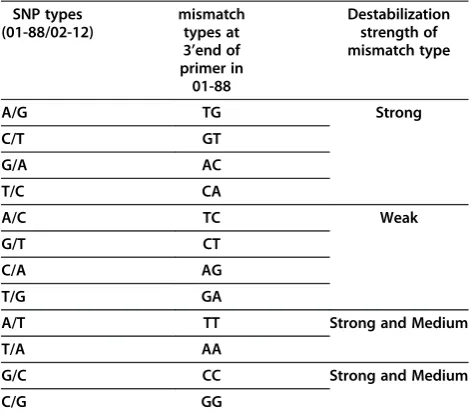
In this study, 1686B. oleraceaSNPs including 12 kinds of SNPs were chosen for primer design (Additional file 1). Among them, some of those SNPs could form the same 3’end mismatches in 01-88 with allele-specific primers. Therefore, all SNPs could be classified into eight kinds in-cluding A/G and C/T, T/C and G/A, A/C and G/T, T/G and C/A, A/T, T/A, C/G, G/C (Table 2) based on mis-match types (for example, for SNPs A/G and C/T, the 3’ end mismatch of the allele-specific primer designed for 02-12 is TG in 01-88). Moreover, for convenience of data analysis, we further compressed into four SNP types in-cluding A/G (T/C), A/C (T/G), A/T (T/A) and G/C (C/G) based on their destabilization effects in mismatch base pairs (Table 2) [28,29].
In this study, all the primers were used to amplify the genome DNA of lines 01-88 and 02-12, and PCR products were detected on 2.5% agarose gel by electrophoresis. The
Figure 1Schematic representation of the AS-PCR primer design. a, Primer P1 forms a perfect match with allele from 02-12, but a mismatch base pair at the 3’end with the DNA sequence of allele from 01-88. It could amplify the band in both of two lines 01-88 and 02-12. Primer P2 forms two mismatch base pairs with allele from 01-88 at the 3’end and in the 3rdnucleotide from the 3’end, while a mismatch base pair in the
3rdnucleotide with allele from 02-12. It amplified the band only in 02-12.b, Schematic representation of different mismatches during the SNP
results showed that among the 1686 primer pairs, 490 pairs (29.1%) displayed polymorphism (Table 3). When classified by SNP types, the percents of polymorphism of A/G (C/T), A/C (G/T), A/T (T/A), C/G (G/C) were 26.4% (111/420), 31.3% (131/418), 34% (148/435) and 37.5% (155/413) respectively. When classified by mismatch sites, polymorphism percents of the 2nd, 3rdand 4thbase loca-tion closest to the SNP sites were 25.1% (139/554), 32.9% (189/575) and 29.1% (162/557), respectively. If SNP type and mismatch site in primers were both considered, the polymorphism percent of SNP A/T (T/A) which had mis-matches in the 3rdsite was 45.9% (72/157), followed by C/ G (G/C) in the 2nd site with 43.3% (58/134) and 3rdsite with 39.4% (56/142). The polymorphism percent of SNP A/G (C/T) was 26.4% (111/420), which also has the lowest polymorphisms in all mismatch sites.
Moreover, the polymorphism percents of SNP primers classified by the types of mismatch bases in the 2nd, 3rd
and 4thmismatch sites were analyzed (Table 4). Results showed that polymorphism percents of 8 mismatch types were closely equivalent in the 2nd sites (22.5%-26.4%). High polymorphism percents appeared in two mismatch base pairs in the 3rdbase location (CA, 46.8%, 37/79; TG, 38.6%, 27/70). At the 4thbase away from the SNP site, the polymorphism percents of primers with mismatch base pairs GA, TC, TT and CC were over 30% (31.7%-33.3%).
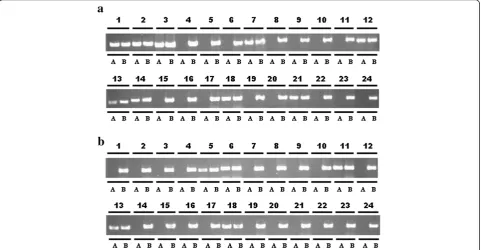
Based on the results in Table 3 and Table 4, we in-ferred that primers, which had CA mismatch in the 3rd base closest to SNP site A/T (T/A), had the highest polymorphism between lines 01-88 and 02-12. To iden-tify this conjecture, 385 primers designed from SNP A/T (T/A), which contained G or T base in the 3rd nucleo-tide, were further chosen for polymorphism analysis (Additional file 2). The detection results showed that 295 SNP primers were polymorphic (295/385, 76.6%) be-tween lines 01-88 and 02-12. When these primers were classified based on the SNPs (A/T or T/A) in 3’end, the specificity percent of SNP (A/T) (158/193, 81.9%) was higher than that of SNP (T/A) (137/192, 71.4%) (Figure 2a and Figure 2b).
Application of the design method
Besides the highest polymorphic primers mentioned above, the high polymorphic primers could be found in every SNP type based on our results. The principle of pri-mer design is described as followed: firstly, for every kind of SNP, the mismatch site (the 2nd, 3rdand 4thsite closest to the SNP site) is chosen according to the result of poly-morphism percent in Table 3. For the primers of three SNP types A/T (T/A), A/C (G/T) and A/G (C/T), the highest polymorphism percents are 45.9%, 37.4% and 30.7%, respectively and the mismatches in primers are all located in the 3rdsite. While for the SNP type C/G (G/C), the mismatches in the 2ndsite closest to 3’end of primers show highest polymorphism percent (43.3%). For the base
Table 2 Destabilization strength of eight combinations of mismatch nucleotide pairing
SNP types mismatch
types at 3’end of primer in 01-88
Destabilization strength of mismatch type (01-88/02-12)
A/G TG Strong
C/T GT
G/A AC
T/C CA
A/C TC Weak
G/T CT
C/A AG
T/G GA
A/T TT Strong and Medium
T/A AA
G/C CC Strong and Medium
C/G GG
Table 3 Effect of mismatch sites and SNP types on the specificity of allele-specific PCR
Mismatch sites closest to the 3’end of primers
Polymorphism percent of SNP
primers
Polymorphism percent of primers for every SNP type
A/G, C/T A/C, G/T A/T, T/A C/G, G/C
The 2ndbase 25.1% 23.0% 26.8% 26.6% 43.3%
(139/554) (32/139) (37/138) (38/143) (58/134)
The 3rdbase 32.9% 30.7% 37.4% 45.9% 39.4%
(189/575) (42/137) (52/139) (72/157) (56/142)
The 4thbase 29.1% 25.7% 29.8% 28.1% 29.9%
(162/557) (37/144) (42/141) (38/135) (41/137)
Total number 29.1% 26.4% 31.3% 34% 37.5%
in mismatch site (the 2nd, 3rd and 4thsite closest to the SNP site), there exist three different mismatch styles for every kind of base. The best mismatch style is chosen according to the statistical results from Table 4. For ex-ample, if there is a G in the 3rdsite, the mismatches of CC, CA and CT will be formed. The polymorphism per-cent of primers with CA (46.8%) mismatch is highest com-pared to that of CC (23.9%) and CT (32.1%).
We further identified the usability of the primer design method on rapeseed and sesame. During rapeseed oil con-tent research, with DH lines of F1 generation between zy036 and 51070, which had been reported by Hua et al [30], we identified a QTL related to oil content located on A2 chromosome. Because of lack of markers in the QTL interval, we designed a total of 20 SNP primers between marker O110C05 and marker BrSF000036-9 using our
Table 4 Effect of artificial base mismatches in three mismatch sites on the specificity of allele-specific PCR
Mismatch sites
closest to the 3’end
of primers
Mismatch types
Polymorphism percent of
primers
Mismatch types
Polymorphism percent of
primers
Mismatch types
Polymorphism percent of
primers
Mismatch types
Polymorphism percent of
primers
The 2ndbase TC 26.2% GA 22.5% CA 25.7% AA 23.8%
(17/65) (16/71) (19/74) (15/63)
TG 26.4% GG 24.2% CC 26.1% TT 25.6%
(19/72) (15/62) (18/69) (20/78)
The 3rdbase TC 32.1% GA 28.3% CA 46.8% AA 30.6%
(26/81) (17/60) (37/79) (26/85)
TG 38.6% GG 30.4% CC 23.9% TT 29.7%
(27/70) (21/69) (16/67) (19/64)
The 4thbase TC 32.9% GA 31.7% CA 28.0% AA 26.8%
(24/73) (26/82) (21/75) (19/71)
TG 23.3% GG 25.8% CC 33.3% TT 32.4%
(14/60) (16/62) (22/66) (22/68)
Figure 2Analysis of specificity for SNP primers ofB. oleracea. a, 1-24 primer pairs, which corresponded to Bo001-Bo024, were introduced with a CA base pair mismatch in the 3rdnucleotide closest to 3’end (A/T SNP type, AA mismatch).b, 24 primer pairs, which corresponded to
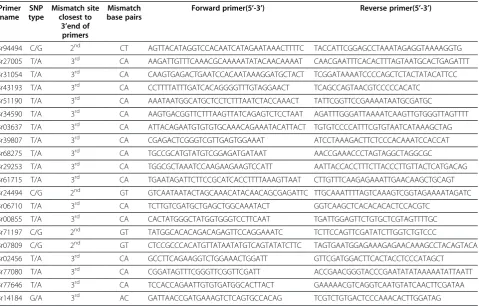
method (Table 5). Results showed that 15 primers were located in the QTL interval (Figure 3). The polymorphism percent of primers is (15/20, 75%). Another 24 primers came from A/T SNPs between two sesame lines 28-31 and ZZM2289 were also designed. And among them, 18 SNP markers were detected to have polymorphism (18/24, 75%) (Additional file 3). Both results from rapeseed and sesame indicated that the SNP primer method could be used in other species.
Discussion
In recent years, various methods for high-throughput SNP analysis have been described [28]. Although these methods are highly efficient compared to other traditional SNP genotyping by electrophoresis, significant investments of expensive probes, microchips or special instrumentation have limited their use in most laboratories. For traditional low-throughput SNP genotyping methods, the main time and labor, and low efficiency of specific primer are still challenges [27]. The Allele-specific PCR method was developed for allele analysis of clinically significant muta-tions. To facilitate reliable discrimination between two alleles highly, the addition of artificial mismatches within the three bases from 3’end of the primers might be benefi-cial [23]. Although the third position from the 3’end has been detected as the best to place a mismatch base in
primer previously [24], we really do not know which kind of mismatch (for every base, there are three kinds of mis-matches) is the best choice in the 3rd position. In this study, different from the previous reports which used only a limited quantity of primers, a large amount of SNP pri-mers designed by introducing mismatches within the three bases closest to the 3’end of primers were used to solve this problem.
Generally, AS-PCR primers designed randomly had a low allelic specificity rate of approximately 30%, which was consistent with our results (29.1%). However, mis-match sites (2nd, 3rd, and 4thsite closest to the 3’end) had different effects on the polymorphic efficiency of primers. In our study, we found primer polymorphic percent was lowest in the 2nd base location because many primers could not amplify any bands in both of the lines 01-88 and 02-12. For the 4thbase location, the polymorphism effi-ciencies of all mismatch types were almost equivalent (under 30%). The highest polymorphic percent was found in the 3rdbase located closest to the SNP site, which was observed by Hayashi et al similarly (2004) [24].
According to the results of thermodynamics of mis-matches reported by Peyret et al (1999) and Little (2001) [28,29], the mismatch base pairs had different destabilization effects that could be divided into weak, medium, and strong strength of destabilization. Therefore, during design of
AS-Table 5 20 primers pairs designed according to SNPs between rapeseed zy036 and 51070
Primer name
SNP type
Mismatch site closest to
3’end of primers
Mismatch base pairs
Forward primer(5’-3’) Reverse primer(5’-3’)
Br94494 C/G 2nd CT AGTTACATAGGTCCACAATCATAGAATAAACTTTTC TACCATTCGGAGCCTAAATAGAGGTAAAAGGTG
Br27005 T/A 3rd CA AAGATTGTTTCAAACGCAAAAATATACAACAAAAT CAACGAATTTCACACTTTAGTAATGCACTGAGATTT
Br31054 T/A 3rd CA CAAGTGAGACTGAATCCACAATAAAGGATGCTACT TCGGATAAAATCCCCAGCTCTACTATACATTCC
Br43193 T/A 3rd CA CCTTTTATTTGATCACAGGGGTTTGTAGGAACT TCAGCCAGTAACGTCCCCCACATC
Br51190 T/A 3rd CA AAATAATGGCATGCTCCTCTTTAATCTACCAAACT TATTCGGTTCCGAAAATAATGCGATGC
Br34590 T/A 3rd CA AAGTGACGGTTCTTTAAGTTATCAGAGTCTCCTAAT AGATTTGGGATTAAAATCAAGTTGTGGGTTAGTTTT
Br03637 T/A 3rd CA ATTACAGAATGTGTGTGCAAACAGAAATACATTACT TGTGTCCCCATTTCGTGTAATCATAAAGCTAG
Br39807 T/A 3rd CA CGAGACTCGGGTCGTTGAGTGGAAAT ATCCTAAAGACTTCTCCCACAAATCCACCAT
Br68275 T/A 3rd CA TGCCGCATGTATGTCGGAGATGATAAT AACCGAAACCCTAGTAGGCTAGGCGC
Br29253 T/A 3rd CA TGGCGCTAAATCCAAGAAGAAGTCCATT AATTACCACCTTTCTTACCCTTGTTACTCATGACAG
Br61715 T/A 3rd CA TGAATAGATTCTTCCGCATCACCTTTTAAAGTTAAT CTTGTTTCAAGAGAAATTGAACAAGCTGCAGT
Br24494 C/G 2nd GT GTCAATAATACTAGCAAACATACAACAGCGAGATTC TTGCAAATTTTAGTCAAAGTCGGTAGAAAATAGATC
Br06710 T/A 3rd CA TCTTGTCGATGCTGAGCTGGCAAATACT GGTCAAGCTCACACACACTCCACGTC
Br00855 T/A 3rd CA CACTATGGGCTATGGTGGGTCCTTCAAT TGATTGGAGTTCTGTGCTCGTAGTTTTGC
Br71197 C/G 2nd GT TATGGCACACAGACAGAGTTCCAGGAAATC TCTTCCAGTTCGATATCTTGGTCTGTCCC
Br07809 C/G 2nd GT CTCCGCCCACATGTTATAATATGTCAGTATATCTTC TAGTGAATGGAGAAAGAGAACAAAGCCTACAGTACA
Br02456 T/A 3rd CA GCCTTCAGAAGGTCTGGAAACTGGATT GTTCGATGGACTTCACTACCTCCCATAGCT
Br77080 T/A 3rd CA CGGATAGTTTCGGGTTCGGTTCGATT ACCGAACGGGTACCCGAATATATAAAAATATTAATT
Br77646 T/A 3rd CA TCCACCAGAATTGTGTGATGGCACTTACT GAAAAACGTCAGGTCAATGTATCAACTTCGATAA
PCR primers, the effects of mismatches no matter in 3’end or within the three bases closest to the 3’end of primers should be both considered [26,27]. In this study, for conveni-ent analysis, we compressed four SNP types including A/T (T/A), A/G (T/C), A/C (T/G), and G/C (C/G) based on their destabilization effects of mismatch base pairs formed in 3’end of primers. Among them, primers generated from SNP types A/G (T/C) had the lowest detection efficiency in all mismatch sites. It was reasonable because AC and GT mis-matches had weak destabilization strength. The primers in-cluding these specific mismatches at 3’end were easier to make amplification in both alleles.
Similarly, mismatch types within the three bases closest to the 3’end affect specificities of primers. In the 3rdbase, CA and TG (the highest polymorphic mismatches) belonged to weak destabilization strength mismatches. The mismatches GA, TC, TT, and CC (the higher poly-morphic mismatches) located at the 4thbase away from the SNP site belonged to the strong destabilization strength mismatches. From the results, we deduced that SNPs (A/T), which contained CA mismatches in the 3rd nucleotide from the 3’end of the primers, had the highest allele-specification. According to the combination rules, polymorphic efficiency between TT (mismatch in 3’end of primer, strong destabilization strength) and CA (weak destabilization strength) are typically higher than AA (mismatch in 3’end of primer, medium destabilization strength) and CA. Our results confirmed this deduction.
Based on these results, we performed the primer design principle which could form the one and only best primer
for every SNP type. Among them, mismatches in the sec-ond positions were more appropriate for SNP type (C/G and G/C), which was different from the viewpoint that mismatch in the 3rdposition was the best choice for AS-PCR. With the primer design principle, we further tested the primers designed based on SNPs of rapeseed and ses-ame. High efficient polymorphism of the primers identi-fied the usability of the method in other species.
Conclusion
A SNP primer design method was developed which improved the polymorphism efficiency of AS-PCR pri-mers highly. The modified primer design can help to identify the best effective primer for each SNP and po-tentially is a valuable tool for gene mapping, map-based cloning and marker-assisted selection in crops.
Methods
Plant materials and SNP information
At least 20ug genome DNA of B. oleracea lines 01-88 and 02-12 at a concentration of≥50 ng/ul, was sent for Solexa sequencing as a commercial service. The DNA was fragmented into small pieces using divalent cations at elevated temperature. The cleaved short DNA frag-ments were prepared for Solexa sequencing in BGI (China). REPEAT MASTER was used for screening repeated sequences with default parameter and labeling the sequences from different materials. For genome loca-tion of fragments, SOAP adapting the default parameter values was used for the initial alignment and screening
Figure 3SNP marker density increase of rapeseed linkage map. a, An oil content QTL was scanned between O110C05 and BrSF000036-9.
to avoid the effects of paralog [31]. SNP primer design was performed using screened results.
SNP analysis and verification by Sanger sequencing
To verify the putative SNPs, 96 SNP sites derived from only 8-read sequences were randomly chosen betweenB.
olera-cea lines 01-88 and 02-12. Primers (Sangon, China) were designed to amplify about 500 bp fragments in which taining the corresponding SNPs. The PCR reaction con-tained 25 ng DNA, 0.2 mM dNTP, 0.5U Taq (MBI, USA) with 1xbuffer, and 5pM of each primer. PCR parameters were as follows: a pre-denaturation of 94°C for 2 min, 35 cycles of amplification (94°C for 30S, 60°C for 1 min and 72°C for 1 min) and a final extension reaction was per-formed at 72°C for 5 min. PCR products were detected on 1.0% agarose gel by electrophoresis and ligated into PMD18T-vector (Takara, Japan) for SNP identification.
Primer design and testing
Allele-specific primers corresponding to 12 kinds of SNP inB. oleraceawere designed according to different combi-nations between mismatch base and mismatch site. Optimization of melting temperature, primer length and amplified products length were achieved using primer program WebSNAPER (http://pga.mgh.harvard.edu/cgi-bin/snap3/websnaper3.cgi) [23]. Primer sequences were screened againstB. oleraceagenome repetitive sequences to minimize mis-priming.
Polymorphism assay of SNP primers were performed by PCR and detected by agarose gel electrophoresis. All the forward primers are allele-specific for B. oleracea line 02-12 and the reverse primer is not allele-specific. Amplification of SNP primers was performed on C1000TM Thermal Cycler (Bio-Rad, USA) using 20 ul reactions. Before carrying out this study, we had chosen some Taq polymerases: MBI Taq DNA Polymerase and Takara Taq (two general Taq), MBI Dream TaqTMDNA Polymerase and Takara Ex Taq (which are better in amp-lification efficiency and sensitivity compared to general Taqs) to identify their effects on amplification efficiency. Result showed both of general polymerases (MBI Taq DNA Polymerase and Takara Taq) had same and high allele-specific amplification efficiency compared to the other two Taqs. Therefore, general Taq polymerase would be best choice in allele-specific PCR and Taq DNA Polymerase from MBI was chose in this study. The PCR reaction contained 25 ng DNA, 0.2 mM dNTP, 0.5U Taq DNA Polymerase with 1xbuffer, and 5 pM of each primer. PCR parameters were as follows: a pre-denaturation of 94°C for 2 min, 35 cycles of amplifica-tion (94°C for 30s, 55°C-65°C for 1 min and 72°C for 30s) and a final extension reaction was performed at 72°C for 10 min. PCR products were separated on 2.5% agarose gel by electrophoresis.
Application in rapeseed and sesame
Rapeseed DNA samples including two parents (high oil content line zy036 and low oil content line 51070) and DH lines, which had been reported by Hua et al [30], were prepared using the DNAeasy plant kit miniprep (Qiagen, Valencia, CA). Zy036 and 51070 were re-sequenced and blasted with B. napus genome sequence (unpublished). Additionally, two sesame lines 28-31 and ZZM2289 (genome sequence has not been published) were also used in our research. All SNPs were chosen according to the method described in B. oleracea lines 01-88 and 02-12. The SNP primers were designed according to our primer design method.
Additional files
Additional file 1:1686 primer pairs designed based on the SNPs betweenB. oleracealines 01-88 and 02-12.
Additional file 2:385 primer pairs designed based on the SNPs betweenB. oleracealines 01-88 and 02-12 which are A/T SNP type with G and T base in the 3rdnucleotide.
Additional file 3:24 primer pairs designed based on the SNPs between sesame lines 28-31 and ZZM2289.
Abbreviations
SNP: Single Nucleotide Polymorphism; AS-PCR: Allele-Specific PCR; SSR: Simple Sequence Repeat; RFLP: Restriction fragment length polymorphism; AFLP: Amplified fragment length polymorphism; CAPs: The Cleaved Amplified Polymorphic Sequence; dCAPs: Derived The Cleaved Amplified Polymorphic Sequence.
Competing interests
The authors declare that they have no competing interests.
Authors’contributions
JL and SMH contributed to primer design and took the co-lead role in writing the manuscript. SMH and MYS performed the primer analysis. SYL offered sequence data ofB. oleracea and B. napus. YML and WWX provided the DNA ofB. oleracea01-88 and 02-12. XRZ provided the genome sequence and DNA ofS. indicum L. 28-31 and ZZM2289. HZW participated in discussions during experimental work. WH conceived the project and approved the final version of the manuscript. All authors read and approved the final manuscript.
Acknowledgement
This study was supported by the National Key Basic Research Program of China (2011CB109300), National 863 plans projects (2012AA101107), and Key Projects in the National Science & Technology Pillar Program
(2010BAD01B02).
Author details
1Key Laboratory of Biology and Genetic Improvement of Oil Crops, Ministry
of Agriculture, Oil Crops Research Institute of the Chinese Academy of Agricultural Sciences, Wuhan 430062, People’s Republic of China.2Institute of
Vegetables and Flowers of the Chinese Academy of Agricultural Sciences, Beijing 100081, People’s Republic of China.
Received: 15 June 2012 Accepted: 17 August 2012 Published: 24 August 2012
References
1. Gut IG:Automation in genotyping of single nucleotide polymorphisms.
Hum Mutat2001,17:475–492.
2. Kwok PY:Methods for genotyping single nucleotide polymorphisms.
3. Flint-Garcia SA, Thornsberry JM, Buckler ES:Structure of linkage disequilibrium in plants.Annu Rev Plant Biol2003,54:357–374. 4. Wang C, Liu Z:Arabidopsis ribonucleotidereductases are critical for cell
cycle progression, DNA damage repair, and plant development.Plant Cell
2006,18:350–365.
5. Feltus FA, Wan J, Schulze SR, Estill JC, Jiang N, Paterson AH:An SNP resource for rice genetics and breeding based on subspecies indica and japonica genome alignments.Genome Res2004,14:1812–1819. 6. Hillier LW, Miller RD, Baird SE, Chinwalla A, Fulton LA, Koboldt DC,
Waterston RH:Comparison of C. elegans and C. briggsae genome sequences reveals extensive conservation of chromosome organization and synteny.PLoS Biol2007,5:e167.
7. Eberle MA, Ng PC, Kuhn K, Zhou L, Peiffer DA, Galver L, Viaud-Martinez KA, Lawley CT, Gunderson KL, Shen R, Murray SS:Power to detect risk alleles using genome-wide tag SNP panels.PLoS Genet2007,
3:1827–1837.
8. Shendure J, Mitra RD, Varma C, Church GM:Advanced sequencing technologies: methods and goals.Nat Rev Genet2004,5:335–344. 9. Barbazuk WB, Emrich SJ, Chen HD, Li L, Schnable PS:SNP discovery via 454
transcriptome sequencing.Plant J2007,51:910–918.
10. Trick M, Long Y, Meng J, Bancroft I:Single nucleotide polymorphism (SNP) discovery in the polyploid Brassica napus using Solexa transcriptome sequencing.Plant Biotechnol J2009,7:334–346.
11. Li R, Li Y, Fang X, Yang H, Wang J, Kristiansen K, Wang J:SNP detection for massively parallel whole-genome resequencing.Genome Res2009,
19:1124–1132.
12. Livak KJ, Marmaro J, Todd JA:Towards fully automated genome-wide polymorphism screening.Nat Genet1995,9:341–342.
13. Myakishev MV, Khripin Y, Hu S, Hamer DH:High-throughput SNP genotyping by allele-specific PCR with universal energy-transfer-labeled primers.Genome Res2001,11:163–169.
14. Huang J, Wei W, Zhang J, Liu G, Bignell GR, Stratton MR, Futreal PA, Wooster R, Jones KW, Shapero MH:Whole genome DNA copy number changes identified by high density oligonucleotide arrays.Hum Genomics
2004,1:287–299.
15. Shapero MH, Zhang J, Loraine A, Liu W, Di X, Liu G, Jones KW:MARA: a novel approach for highly multiplexed locus-specific SNP genotyping using high-density DNA oligonucleotide arrays.Nucleic Acids Res2004,
32:e181.
16. Matsuzaki H, Dong S, Loi H, Di X, Liu G, Hubbell E, Law J, Berntsen T, Chadha M, Hui H, Yang G, Kennedy GC, Webster TA, Cawley S, Walsh PS, Jones KW, Fodor SP, Mei R:Genotyping over 100,000 SNPs on a pair of oligonucleotide arrays.Nat Methods2004,1:109–111.
17. Shen R, Fan JB, Campbell D, Chang W, Chen J, Doucet D, Yeakley J, Bibikova M, Wickham Garcia E, McBride C, Steemers F, Garcia F, Kermani BG, Gunderson K, Oliphant A:High-throughput SNP genotyping on universal bead arrays.Mutat Res2005,573:70–82.
18. Konieczny A, Ausubel FM:A procedure for mapping Arabidopsis mutations using co-dominant ecotype-specific PCR-based markers.Plant J1993,4:403–410.
19. Neff MM, Turk E, Kalishman M:Web-based primer design for single nucleotide polymorphism analysis.Trends Genet2002,18:613–615. 20. Thiel T, Kota R, Grosse I, Stein N, Graner A:SNP2CAPS: a SNP and INDEL
analysis tool for CAPS marker development.Nucleic Acids Res2004,32:e5. 21. Cha RS, Zarbl H, Keohavong P, Thilly WG:Mismatch amplification mutation
assay (MAMA): application to the c-H-ras gene.PCR Methods Appl1992,
2:14–20.
22. Kwok S, Chang SY, Sninsky JJ, Wang A:A guide to the design and use of mismatched and degenerate primers.PCR Methods Appl1994,3:S39–S47. 23. Drenkard E, Richter BG, Rozen S, Stutius LM, Angell NA, Mindrinos M, Cho
RJ, Oefner PJ, Davis RW, Ausubel FM:A simple procedure for the analysis of single nucleotide polymorphisms facilitates map-based cloning in Arabidopsis.Plant Physiol2000,124:1483–1492.
24. Hayashi K, Hashimoto N, Daigen M, Ashikawa I:Development of PCR-based SNP markers for rice blast resistance genes at thePizlocus.Theor Appl
Genet2004,108:1212–1220.
25. Hirotsu N, Murakami N, Kashiwagi T, Ujiie K, Ishimaru K:Protocol: a simple gel-free method for SNP genotyping using allele-specific primers in rice and other plant species.Plant Methods2010,6:12.
26. Wangkumhang P, Chaichoompu K, Ngamphiw C, Ruangrit U, Chanprasert J, Assawamakin A, Tongsima S:WASP: a Web-based Allele-Specific PCR
assay designing tool for detecting SNPs and mutations.BMC Genomics
2007,8:275.
27. Bui M, Liu Z:Simple allele-discriminating PCR for cost-effective and rapid genotyping and mapping.Plant Methods2009,5:1.
28. Tsuchihashi Z, Dracopoli NC:Progress in high throughput SNP genotyping methods.Pharmacogenomics J2002,2:103–110. 29. Little S:Amplification-refractory mutation system (ARMS) analysis of
point mutations.Curr Protoc Hum Genet2001,9:9.8.1–9.8.12. 30. Hua W, Li RJ, Zhan GM, Liu J, Li J, Wang XF, Liu GH, Wang HZ:Maternal
control of seed oil content inBrassica napus: the role of silique wall photosynthesis.Plant J2012,69:432–444.
31. Li R, Li Y, Kristiansen K, Wang J:SOAP: short oligonucleotide alignment program.Bioinformatics2008,24:713–714.
doi:10.1186/1746-4811-8-34
Cite this article as:Liuet al.:An improved allele-specific PCR primer
design method for SNP marker analysis and its application.Plant
Methods20128:34.
Submit your next manuscript to BioMed Central and take full advantage of:
• Convenient online submission
• Thorough peer review
• No space constraints or color figure charges
• Immediate publication on acceptance
• Inclusion in PubMed, CAS, Scopus and Google Scholar
• Research which is freely available for redistribution