R E S E A R C H A R T I C L E
Open Access
Proteome changes in the small intestinal mucosa
of broilers (Gallus gallus) induced by high
concentrations of atmospheric ammonia
Jize Zhang, Cong Li, Xiangfang Tang, Qingping Lu, Renna Sa and Hongfu Zhang
*Abstract
Background:Ammonia is a well-known toxicant both existing in atmospheric and aquatic system. So far, most studies of ammonia toxicity focused on mammals or aquatic animals. With the development of poultry industry, ammonia as a main source of contaminant in the air is causing more and more problems on broiler production, especially lower growth rate. The molecular mechanisms that underlie the negative effects of ammonia on the growth and intestine of broilers are yet unclear. We investigated the growth, gut morphology, and mucosal proteome of Arbor Acres broilers (Gallus gallus) exposed to high concentrations of atmospheric ammonia by performing a proteomics approach integrated with traditional methods.
Results:Exposure to ammonia interfered with the development of immune organ and gut villi. Meanwhile, it greatly reduced daily weight gain and feed intake, and enhanced feed conversion ratio. A total of 43 intestinal mucosal proteins were found to be differentially abundant. Up-regulated proteins are related to oxidative phosphorylation and apoptosis. Down-regulated proteins are related to cell structure and growth, transcriptional and translational regulation, immune response, oxidative stress and nutrient metabolism. These results indicated that exposure to ammonia triggered oxidative stress, and interfered with nutrient absorption and immune function in the small intestinal mucosa of broilers.
Conclusions:These findings have important implications for understanding the toxic mechanisms of ammonia on intestine of broilers, which provides new information that can be used for intervention using nutritional strategies in the future.
Keywords:Proteome, Ammonia, Small intestinal mucosa, Broilers
Background
Ammonia is a colorless and highly water-soluble gas, which is a well-known toxicant both in aquatic and at-mospheric system. In animal houses, ammonia may be formed mainly from animal manure by hydrolysis, mineralization, and volatilization [1]. Animal produced ammonia accounts for almost 50% of the total annual anthropogenic emission of ammonia, in which poultry operations produced the highest ammonia emission as compared with other animal groups [2,3]. The limiting level of ammonia for poultry is under 25 μL/L. But in practice, birds are often exposed to higher concentrations
of ammonia (50–200μL/L) in some poorly ventilated fa-cilities. High level of atmospheric ammonia induces sev-eral problems in broiler production, such as decreased growth rate, body weight, and increased feed conversion [4,5]. Longtime exposure can create many health issues in broilers and severely interfere with broiler welfare [6,7].
In previous research, degenerative vacuole and necro-sis of renal tubulae were observed in livers and kidneys of ammonia-exposed broilers, respectively [8]. Apoptosis of epithelium cells of tracheal mucosa has been demon-strated in ammonia-exposed broilers in our study (un-published data). The neurotoxicity of ammonia induces an increase in expression of tumor necrosis factor α (TNF-α) and interleukin 1 β(IL-1β), which can be asso-ciated with the production of reactive oxygen species (ROS), nitric oxide (NO) involved with protein kinase A * Correspondence:[email protected]
State Key Laboratory of Animal Nutrition, Institute of Animal Sciences, Chinese Academy of Agricultural Sciences, Beijing 100193, People’s Republic of China
© 2015 Zhang et al.; licensee BioMed Central. This is an Open Access article distributed under the terms of the Creative Commons Attribution License (http://creativecommons.org/licenses/by/4.0), which permits unrestricted use, distribution, and reproduction in any medium, provided the original work is properly credited. The Creative Commons Public Domain Dedication waiver (http://creativecommons.org/publicdomain/zero/1.0/) applies to the data made available in this article, unless otherwise stated.
Zhanget al. Proteome Science (2015) 13:9
(PKA), extracellular signal regulated kinase (ERK) path-way and nuclear factor-κB (NF-κB) activation in astro-cytes in rats [9].
Negative effects of ammonia on gastrointestinal (GI) tract were also reported in previous studies that may be related to nutrient metabolism and energy production. In rat colonocytes, it showed that ammonia suppressed short-chain fatty acid (SCFA) oxidation [10]. Inhibition of oxygen consumption induced lower energetic effi-ciency and decreased cellular energy production were also observed in the similar animal model due to ele-vated concentration of ammonia by the ingestion of high protein diet [11]. Tsujii et al. [12] reported that ammonia impaired mitochondrial and cellular respiration, and energy metabolism of gastric mucosa, which triggered a decrease of mucosal cell viability leading to mucosal damage subsequently. Moreover, Igarashi et al. [13]
demonstrated that ammonia accelerated
cytokine-induced apoptosis in human gastric epithelial cell lines. Gastrointestinal (GI) tract is regarded as the essential sensory organ for nutrition absorption, immune re-sponse, and pathogen prevention [14]. Previous research have demonstrated that changes of animal growth per-formance are closely related to alterations of protein expression in the small intestinal mucosa [15-17]. There are numerous enzymes in the small intestinal mucosa in-volved in different physiological functions, such as
pro-tein metabolism, lipid metabolism, carbohydrates
metabolism, energy production, mucosal integrity and so on [18-21]. However, it is almost impossible to detect a huge number of proteins in the GI mucosa at the same time using traditional methods, for example western blots, immunohistochemical staining or ELISAs. Cur-rently, most studies relevant to toxic mechanisms of am-monia are on mammals and aquatic animals. Little is known about the alteration of proteins in the small intestinal mucosa of broilers that have been exposed to high concentrations of atmospheric ammonia.
Based on previous research, we hypothesized that high concentrations of atmospheric ammonia exposure can confer negative effects on growth via changes of proteins involved in different physiological processes in the small intestinal mucosa of broilers, which requires further study to elucidate. Therefore, in this study, we utilized a label-based iTRAQ procedure (isobaric tags for relative and absolute quantitation), followed by LC-MS/MS to quantitate altered proteins that are induced differentially in the small intestinal mucosa of broilers exposed to high concentrations of atmospheric ammonia.
Materials and methods Animals and exposure conditions
A total of 60 1-day-old Arbor Acers (AA) male broilers were obtained from a commercial hatchery in Beijing
(Beijing Arbor Acers Broiler Co., Beijing, China). All birds were housed in individual wire-bottom cages in an environmentally controlled room under standard brood-ing practices, and givenad libitumaccess to water and a maize-soybean basal diet during the first 21 days. Then, broilers were transferred to environmentally controlled ex-posure chambers. The diet during the experiment was for-mulated to achieve the National Research Council (NRC, 1994) recommended requirements for all nutrients con-taining ME, 12.76 MJ kg−1; and crude protein 19.94% (Additional file 1: Table S1). The concentrated ammonia was delivered in a whole-body animal exposure chamber [7] from days 22 to 42. Each exposure chamber was a 4500 × 3000 × 2500 mm (length × width × height) sealed unit, sectioned for housing 30 birds per chamber. Temperature and airflow were controlled during the expo-sures to ensure adequate ventilation, minimize buildup of animal-generated contaminants (dander, H2S, CO2) and to avoid thermal stress [22].
The setting of the concentration of ammonia in the present study was according to previous studies that the growth performance of broilers was severely interfered with ammonia level over 70 μL/L [4,7,8]. Treatment (TRET) group of broilers were exposed to 75 ± 3 μL/L ammonia during the experimental period. Control (CTRL) broilers were raised in a separated chamber without ammonia for the same period, and the concen-tration of ambient ammonia was kept at 3 ± 3μL/L. The concentration of ammonia in both chambers was moni-tored with a LumaSense Photoacoustic Field Gas-Monitor Innova-1412 (Santa Clara, CA, USA) during the entire experimental period. Body weight (BW) and feed consumption were recorded weekly for feed-conversion ratio evaluation. This study was carried out in strict accordance with the Regulations for the Adminis-tration of Affairs Concerning Experimental Animals of the State Council of the People’s Republic of China. The protocol was approved by the Committee on Experi-mental Animal Management of Chinese Academy of Agricultural Sciences.
Sample collection
At day 42, all birds were weighed after a 12 h-fasting (12 h food withdrawal) period. The growth parameters (n = 30) including body weight gain, feed intake and feed-conversion ratio were determined. Twelve birds (6 per each group) were randomly selected for blood and small intestine sample collection. Each blood sample was obtained from a wing vein using a sterilized syringe within 30 s. Blood was incubated in a water bath for 1 h at 37°C then centrifuged at 400 × g for 10 min at 4°C, and the sera obtained were stored at −80°C for further analysis [23]. After blood sampling, the chickens were sacrificed by cer-vical dislocation and then exsanguinated. Immediately
after death, the intestinal mucosa was scraped from the intestinum tenue with the back of a surgery knife as de-scribed by Luo et al. [24], frozen in liquid nitrogen, and stored at−80°C for further proteome and qPCR analyses. Samples of about 1 cm of medial duodenum (apex of the duodenum), medial jejunum (midway between the point of entry of the bile duct and Meckel’s diverticulum) and medial ileum (midway between Meckel’s diverticulum to the ileocecal junction) were taken and fixed in buffered 4% formal-saline solution before processing for embedding in paraffin. To calculate the indices of immune organs, an-other twelve birds (6 per each group) were killed as de-scribed above, and the bursa of Fabricius, spleen, thymus and intestine of were excised and weighted, respectively.
Biochemical and histological analyses
For biochemical analysis, the activities of creatine kinase (CK) and total superoxide dismutase (T-SOD) in the serum were measured using a corresponding diagnostic kit (Nanjing Jiancheng Bioengineering Institute, Nanjing, China) according to the instructions of the manufac-turer. Histological examination was carried out accord-ing to the method described by [25]. Briefly, villus height was determined from the tip of the villus to the villus crypt junction and crypt depth was defined as the depth of invaginations between adjacent villi.
Small intestinal mucosa preparation and protein extraction
Sample pooling is a commonly used strategy to reduce the influence of individual variation on candidate target selection in proteomic studies [24,26,27]. To avoid erro-neous conclusions due to individual variations, the same amount of the intestinal mucosa (weight: weight as 1: 1 ratio) from two chickens in the same group was pooled as a biological replicate, and three biological replicates were acquired for each group.
Each pooled small intestinal mucosal sample (~0.5 g) was ground in a Dounce glass grinder using liquid nitro-gen. Ground samples were precipitated with 10% trichloroacetic acid (TCA) (w/v), 90% ice-cold acetone at −20°C for 2 h. The samples were then centrifuged at 20,000 × g for 30 min at 4°C. The supernatants were decanted and the pellets washed with ice-cold acetone. The pellets were lysed in lysis buffer consisting of 8 M urea, 30 mM 4-(2-hydroxyethyl)-1-piperazineethanesul-fonic acid (HEPES), 1 mM phenylmethanesulfonyl fluoride (PMSF), 2 mM ethylene diamine tetraacetic acid (EDTA), and 10 mM dithiothreitol (DTT). The crude tissue extracts were centrifuged for 30 min at 20,000 × g to remove the undissolved pellets. The tissue lysates were reduced for 1 h at 36°C in water bath by addition of 1 M DTT to a final concentration of 10 mM DTT and then alkylated for 1 h by addition of
1 M iodoacetamide (IAM) to a final concentration of 55 mM in the dark. After reduction and alkylation, pro-teins were precipitated by adding 4 volumes of ice-cold acetone. The pellets were then washed three times with ice-cold pure acetone and resuspended in buffer con-sisting of 50% tetraethyl ammonium bromide (TEAB) and 0.1% sodium dodecyl sulfonate (SDS). The samples were then centrifuged for 30 min at 20,000 × g and the undissolved pellets were removed and protein quantita-tion performed using a Bio-Rad Bradford Protein Assay Kit (Hercules, CA, USA).
Trypsin digestion, iTRAQ labeling and strong cation exchange chromatography
Modified sequence grade trypsin (Promega Corpor-ation, Madison, WI) was added to each sample at a 1:30 ratio (3.3 μg trypsin : 100 μg target) and digested overnight at 37°C.
Each isobaric tag was solubilized in 70μL isopropanol. Tags (113, 114, 115, 116, 117 and 121) were added to re-spective pooled samples (3 pooled replicates in each group) individually and incubated at room temperature for 2 h. Additional isopropanol was added to samples to ensure an organic composition > 60% prior to incubation.
The strong cation exchange fractionation protocol followed a previous report [28] with slight modification. Briefly, the samples were loaded onto a strong cation ex-change column (Phenomenex Luna SCX 100A) equili-brated with buffer A (10 mM KH2PO4in 25% acetonitrile, pH 3.0) using an Agilent 1100 (Santa Clara, CA) system. The peptides were separated using a linear gradient of buffer B (10 mM KH2PO4 and 2 M KCl in 25% aceto-nitrile, pH 3.0) increasing to 5% after 36 min, 50% after 66 min and 100% after 71 min, at a flow rate of 1 ml/min. Elution was monitored by setting the absorbance at 214 nm. The eluted peptides were pooled into 10 frac-tions, desalted with a Strata X C18 column (Phenomenex) and vacuum-dried.
Mass spectrometry
Each fraction was resuspended in buffer A (2% aceto-nitrile, 0.1% formic acid) and centrifuged at 20,000 × g for 10 min. In each fraction, the final concentration of peptides was approximately 0.25 μg/μl. Using an auto-sampler, 20 μl of supernatant was loaded onto a 2 cm
C18 trap column (inner diameter 200 μm) on an
UltiMate® 3000 Nano LC system (Bannockburn, IL). Peptides were eluted onto a resolving 100 mm × 75μM analytical C18 column containing 5-μm particles that was assembled in-house. Samples were loaded at 15μl/min for 4 min and eluted with a 45-min gradient at 400 nl/min from 5 to 60% buffer B (98% acetonitrile, 0.1% formic acid), separated with a 3 min linear gradient to 80% B, maintained at 80% B for 7 min, returned to 5% B over
3 min, and finally combined with a Q-Exactive mass spectrometer (Thermo Scientific, MA, USA). The mass spectrometer was operated in data dependent acquisi-tion mode, with MS performed in the Q-Exactive at a resolution of 70,000 full width at half maximum (FWHM). MS/MS was performed in high-energy colli-sion dissociation (HCD) operating mode and product ions were detected in the Q-Exactive at 17,500 FWHM resolution. Data were acquired using a data-dependent data acquisition mode in which, for each cycle, the ten most abundant multiply charged peptides (2+ to 4+) with an m/z between 350 and 2000 were selected for MS/MS with a 15-s dynamic exclusion setting.
Data processing and analyses
For iTRAQ protein identification, the raw mass data were processed with Proteome Discover 1.3 (Thermo Fisher Scientific) and searched with in-house MASCOT software (Matrix Science, London, U.K.; version 2.3.0) against the database Uniprot_Gallus gallus_9031 (Apr 11th, 2014) the following parameters: enzyme: trypsin; fixed modifica-tion: carbamidomethyl (C); variable modifications: oxi-dation (M), gln-pyro-glu (N-term Q), iTRAQ 8-plex (N-term, K, Y); peptide tolerance:15 ppm; MS/MS tol-erance: 20 mmu; maximum missed cleavages: 1. All identified peptides had an ion score above the Mascot peptide identity threshold, and a protein was consid-ered identified if at least one such unique peptide match was apparent for the protein. For iTRAQ quanti-tation, MASCOT software was also used. Protein
quan-titative values were derived only from uniquely
assigned peptides. Intra-sample channels were normal-ized based on the median ratio for each channel across all proteins. Ratios for each iTRAQ label were obtained using a pooled sample in the control group (sample tagged with 113) as the denominator. Inter-sample, protein reference, and spectrum normalizations were performed. Differential expression in the TRET samples was then presented as a log2-foldchange relative to the CTRL. Thus, the fold change for each individual re-porter ion is based on referencing a rere-porter channel which is then log transformed to base 2. Proteins were deemed to be differentially expressed using Student’st-test corrected for multiple testing using the Benjamini and Hochberg correction [29]. Proteins with a 1.2-fold change or greater were considered to be differentially expressed.
Bioinformatics analysis of proteins differential abundance Gene Ontology (GO) distribution for all of the proteins that were significantly altered in the small intestinal samples of ammonia exposed chickens were classified using Blast2GO software (http://www.blast2go.com/) and WEGO (http://wego.genomics.org.cn) that were provided by the Institute for Genomic Research [30,31].
Validation of proteins of differential abundance
Real-time quantitative PCR (qPCR) was used to verify seven intestinal mucosal proteins of differential abun-dance at the mRNA level.
Total RNA from intestinal mucosal samples was iso-lated using a Qiagen RNeasy Plus Mini Kit (Valencia, CA). The quality of the RNA was evaluated by electro-phoresis on an agarose gel, and the quantity of the RNA was measured with a spectrophotometer (Nanodrop 2000, Thermo Scientific, Waltham, MA).
Reverse transcription was performed immediately fol-lowing total RNA isolation using PrimeScript™ Reverse Transcriptase, D2680A (Takara, Dalian, China). RT-qPCR was performed using an Applied Biosystems 7500 Fast Real-Time PCR System (Foster City, CA). RT-qPCRs were performed at 95°C for 30 s, followed by 40 cycles of 95°C for 10 s and 60°C for 30 s. SYBR green fluorescence was detected at the end of each cycle to monitor the amount of PCR product. A stand-ard curve was constructed using a 10-fold dilution series, and its slope was used to calculate the efficiency of the qPCR primers. Primer sequences are listed in Additional file 2: Table S2.
The relative amount of a target gene mRNA was cal-culated as previously described [23]. The expression level of a target gene mRNA was normalized to the
mRNA level of β-actin. The ΔΔCT was calibrated
against an average from the control group. The linear amount of the target gene expression to the calibrator was calculated by 2−ΔΔCT. Therefore, all gene expres-sion results are reported as the fold difference between treated and control groups. The specificity of the real-time PCR product was verified using a melting curve and DNA sequencing.
Statistical analysis
Data on growth parameters, immune organ indices, serum parameters, gut morphological structure and gene expressions were analyzed by one-way ANOVA (SAS Version 9.2, SAS institute Inc., Cary, NC). A group dif-ference was assumed to be statistically significant when
P< 0.05. All results were expressed as means ± S.D.
Results
Body weight gain, feed intake, feed-conversion ratio and immune organ indices
The body weight gain and feed intake are key parame-ters to assess the growth of animal. In this study, all birds (CTRL and TRET) started at the same age (d 22). During the entire experimental period (20 days), TRET birds had 15.4% less (P< 0.05) body weight gain and 9.6% less (P< 0.05) feed intake. On the contrary, feed-conversion ratio (FCR) in TRET group was greatly in-creased (P< 0.05) compared with CTRL group (Table 1).
Of four tested immune organs, indices of spleen and in-testine of chickens in TRET group were lighter than those of CTRL group (P< 0.05). Thus, exposure to high concentrations of atmospheric ammonia interfered with immune organ development of AA broilers and resulted in a reduction of feed conversion efficiency [24].
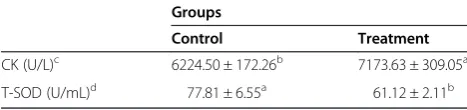
Serum parameters and gut morphological structure Activity of serum CK is an important indicator under stress in the body [25,32]. T-SOD represents the oxida-tion resistance in the animal [33]. In TRET broilers, ac-tivity of serum CK was significantly elevated (P< 0.05) compared with the control group indicating extensive organ injury (Table 2). Antioxidase T-SOD was de-creased significantly compared with the control group (P< 0.05), illustrating lower oxidation resistance (Table 2). As shown in Figure 1A, B, C, D, E and F the VH and CD in all small intestinal segments of birds in CTRL group were significantly higher than those in TRET group, which implicates the absorptive area of small intestine was greatly reduced in broilers under high level of ambient ammonia.
Identification and comparison of proteins of differential abundance
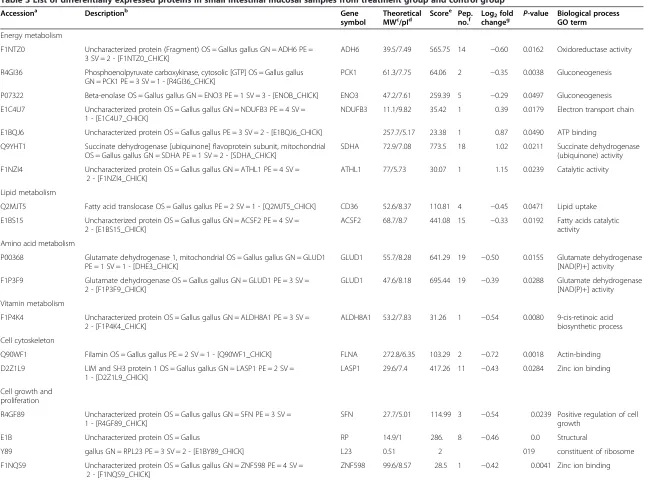
Using iTRAQ analysis, a total of 2726 proteins were identified within the FDR of 1% (Additional file 3: Table S3). Following statistical analysis, 70 proteins were found to be differentially expressed in the small intestinal mucosa between CTRL and TRET broilers, with 26 being up-regulated and 44 down-regulated (Additional file 4: Table S4).
A total of 43 proteins of differential abundance were grouped into eleven classes based on putative functions: transcriptional and translational regulation (23.3%), im-mune response (18.6%), energy metabolism (16.3%), cell
growth and proliferation (9.3%), oxidative stress (7.0%), apoptosis (7.0%), cell cytoskeleton (4.7%), lipid metabol-ism (4.7%), amino acid metabolmetabol-ism (4.7%), vitamin me-tabolism (2.3%) and neurotoxicity (2.3%) (Figure 2). Those related to transcriptional and translational regula-tion, immune response and energy metabolism were pre-dominant and accounted for approximately 60% of the differentially-expressed proteins. A comparison of pro-teins of differential abundance with functional grouping between the groups indicated that fewer protein species were up-regulated in ammonia-exposed chickens (11 versus 32, respectively) (Table 3). These 11 up-regulated protein species were distributed in five categories: four in energy metabolism, three in apoptosis, two in tran-scriptional and translational regulation, one in oxidative, and one in neurotoxicity. The 32 down-regulated protein species were distributed in nine categories: eight in tran-scriptional and translational regulation, eight in immune response, four in cell growth and proliferation, three in energy metabolism, two in oxidative stress, two in lipid metabolism, two in amino acid metabolism, two in cell cytoskeleton and one in vitamin metabolism.
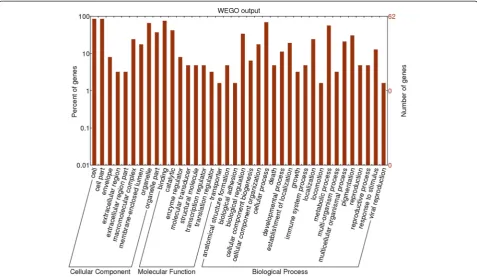
GO annotations of proteins of differential abundance In the cellular component group, the differentially expressed proteins are concentrated in intracellular organelles (mitochondrion, cytoskeletal part and nu-clear part) and the cytoplasm part (Figure 3). In the
molecular functional group, the differentially
expressed proteins that are metabolic enzymes (oxido-reductase activity and hydrolase activity), binding pro-teins (protein binding and nucleotide binding) and enzyme regulator were ranked at the top of the cat-egory occupancy, suggesting that the relevant func-tions were important in the small intestinal mucosa of broilers (Figure 3). In the biological process category, the proteins that participate in cellular processes, me-tabolism and biological regulation were at the top ra-tio in the differentially expressed proteins (Figure 3), suggesting that exposure to ammonia changes the cel-lular metabolic process, like celcel-lular biosynthetic
process, nucleotide and nucleic acid metabolic
process, alters metabolism in the intestine, such as
Table 1 Effect of atmospheric ammonia on the body weight gain, feed intake, feed-conversion ratio and immune organ indices of broilers
Groups
Control Treatment
Body weight gain (g/day) 91 ± 3.6a 77 ± 2.5b
Feed intake (g/day) 150 ± 1.9a 135 ± 2.8b
Feed-conversion ratioc 1.64 ± 0.09b 1.75 ± 0.05a
Index of bursal (%)d 0.73 ± 0.06 0.61 ± 0.05
Index of spleen (%)d 1.07 ± 0.04a 0.75 ± 0.02b
Index of thymus (%)d 2.35 ± 0.50 2.19 ± 0.44
Index of intestine (%)d 3.70 ± 0.15a 2.67 ± 0.11b
a, b
Values within a row not sharing a common superscript letter indicate significant difference atP< 0.05. Numbers are means ± S.D. (n = 30 for growth parameters; n = 6 for indices of immune organs).
c
Feed-conversion ratio = the ratio of feed intake to body weight gain. d
The ratio of organ weight to body weight.
Table 2 Effect of atmospheric ammonia on the serum biochemical parameters of broilers
Groups
Control Treatment
CK (U/L)c 6224.50 ± 172.26b 7173.63 ± 309.05a
T-SOD (U/mL)d 77.81 ± 6.55a 61.12 ± 2.11b
a, b
Values within a column not sharing a common superscript letter indicate significant difference atP< 0.05. Numbers are means ± S.D. (n = 6). c
CK = creatine kinase. d
T-SOD = total superoxide dismutase.
nutrient (carbohydrate, amino acid and lipid) me-tabolism, and have various effects on biological pro-cesses, for example transcriptional and translational regulation, cell growth and proliferation, oxidative stress and so on.
Validation of proteins of differential abundance
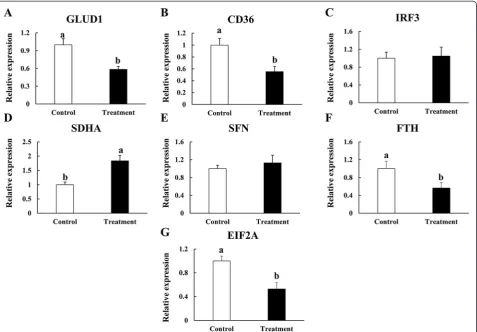
Seven differentially expressed proteins (GLUD1 involved in amino acid metabolism; fatty acid translocase (CD36) involved in lipid metabolism; IRF3 involved in immune response; FTH involved in oxidative stress; SDHA
Figure 2Functional classification of the proteins of differential abundance identified from the small intestinal mucosa of 42-day-old broilers. Figure 1Effects of atmospheric ammonia on villus height (VH) and crypt depth (CD) of duodenum (A and B), jejunum (C and D) and ileum (E and F) in control and treatment groups.Vertical lines represent ± S.D, and different letters denote significant difference atP< 0.05 (n = 6).
Table 3 List of differentially expressed proteins in small intestinal mucosal samples from treatment group and control group
Accessiona Descriptionb Gene
symbol
Theoretical
MWc/pId Score
e Pep.
no.f Log2changefoldg P-value Biological processGO term
Energy metabolism
F1NTZ0 Uncharacterized protein (Fragment) OS = Gallus gallus GN = ADH6 PE = 3 SV = 2 - [F1NTZ0_CHICK]
ADH6 39.5/7.49 565.75 14 −0.60 0.0162 Oxidoreductase activity
R4GI36 Phosphoenolpyruvate carboxykinase, cytosolic [GTP] OS = Gallus gallus GN = PCK1 PE = 3 SV = 1 - [R4GI36_CHICK]
PCK1 61.3/7.75 64.06 2 −0.35 0.0038 Gluconeogenesis
P07322 Beta-enolase OS = Gallus gallus GN = ENO3 PE = 1 SV = 3 - [ENOB_CHICK] ENO3 47.2/7.61 259.39 5 −0.29 0.0497 Gluconeogenesis
E1C4U7 Uncharacterized protein OS = Gallus gallus GN = NDUFB3 PE = 4 SV = 1 - [E1C4U7_CHICK]
NDUFB3 11.1/9.82 35.42 1 0.39 0.0179 Electron transport chain
E1BQJ6 Uncharacterized protein OS = Gallus gallus PE = 3 SV = 2 - [E1BQJ6_CHICK] 257.7/5.17 23.38 1 0.87 0.0490 ATP binding
Q9YHT1 Succinate dehydrogenase [ubiquinone] flavoprotein subunit, mitochondrial OS = Gallus gallus GN = SDHA PE = 1 SV = 2 - [SDHA_CHICK]
SDHA 72.9/7.08 773.5 18 1.02 0.0211 Succinate dehydrogenase
(ubiquinone) activity
F1NZI4 Uncharacterized protein OS = Gallus gallus GN = ATHL1 PE = 4 SV = 2 - [F1NZI4_CHICK]
ATHL1 77/5.73 30.07 1 1.15 0.0239 Catalytic activity
Lipid metabolism
Q2MJT5 Fatty acid translocase OS = Gallus gallus PE = 2 SV = 1 - [Q2MJT5_CHICK] CD36 52.6/8.37 110.81 4 −0.45 0.0471 Lipid uptake
E1BS15 Uncharacterized protein OS = Gallus gallus GN = ACSF2 PE = 4 SV = 2 - [E1BS15_CHICK]
ACSF2 68.7/8.7 441.08 15 −0.33 0.0192 Fatty acids catalytic activity
Amino acid metabolism
P00368 Glutamate dehydrogenase 1, mitochondrial OS = Gallus gallus GN = GLUD1 PE = 1 SV = 1 - [DHE3_CHICK]
GLUD1 55.7/8.28 641.29 19 −0.50 0.0155 Glutamate dehydrogenase [NAD(P)+] activity
F1P3F9 Glutamate dehydrogenase OS = Gallus gallus GN = GLUD1 PE = 3 SV = 2 - [F1P3F9_CHICK]
GLUD1 47.6/8.18 695.44 19 −0.39 0.0288 Glutamate dehydrogenase [NAD(P)+] activity
Vitamin metabolism
F1P4K4 Uncharacterized protein OS = Gallus gallus GN = ALDH8A1 PE = 3 SV = 2 - [F1P4K4_CHICK]
ALDH8A1 53.2/7.83 31.26 1 −0.54 0.0080 9-cis-retinoic acid biosynthetic process
Cell cytoskeleton
Q90WF1 Filamin OS = Gallus gallus PE = 2 SV = 1 - [Q90WF1_CHICK] FLNA 272.8/6.35 103.29 2 −0.72 0.0018 Actin-binding
D2Z1L9 LIM and SH3 protein 1 OS = Gallus gallus GN = LASP1 PE = 2 SV = 1 - [D2Z1L9_CHICK]
LASP1 29.6/7.4 417.26 11 −0.43 0.0284 Zinc ion binding
Cell growth and proliferation
R4GF89 Uncharacterized protein OS = Gallus gallus GN = SFN PE = 3 SV = 1 - [R4GF89_CHICK]
SFN 27.7/5.01 114.99 3 −0.54 0.0239 Positive regulation of cell growth
E1B Uncharacterized protein OS = Gallus RP 14.9/1 286. 8 −0.46 0.0 Structural
Y89 gallus GN = RPL23 PE = 3 SV = 2 - [E1BY89_CHICK] L23 0.51 2 019 constituent of ribosome
F1NQS9 Uncharacterized protein OS = Gallus gallus GN = ZNF598 PE = 4 SV = 2 - [F1NQS9_CHICK]
ZNF598 99.6/8.57 28.5 1 −0.42 0.0041 Zinc ion binding
Zhang
et
al.
Proteome
Science
(2015) 13:9
Page
7
of
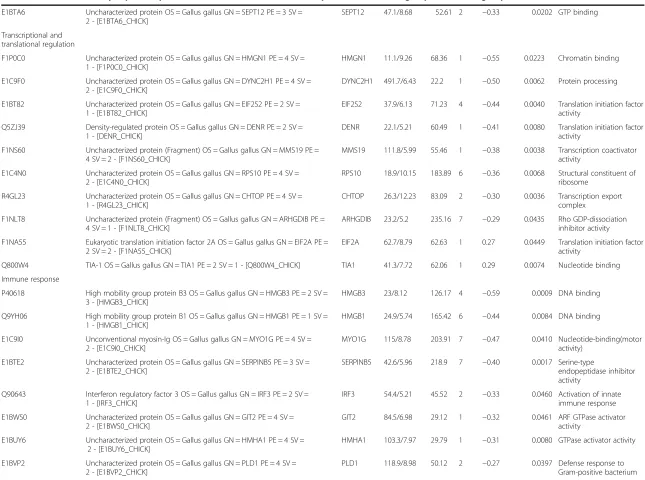
Table 3 List of differentially expressed proteins in small intestinal mucosal samples from treatment group and control group(Continued)
E1BTA6 Uncharacterized protein OS = Gallus gallus GN = SEPT12 PE = 3 SV = 2 - [E1BTA6_CHICK]
SEPT12 47.1/8.68 52.61 2 −0.33 0.0202 GTP binding
Transcriptional and translational regulation
F1P0C0 Uncharacterized protein OS = Gallus gallus GN = HMGN1 PE = 4 SV = 1 - [F1P0C0_CHICK]
HMGN1 11.1/9.26 68.36 1 −0.55 0.0223 Chromatin binding
E1C9F0 Uncharacterized protein OS = Gallus gallus GN = DYNC2H1 PE = 4 SV = 2 - [E1C9F0_CHICK]
DYNC2H1 491.7/6.43 22.2 1 −0.50 0.0062 Protein processing
E1BT82 Uncharacterized protein OS = Gallus gallus GN = EIF2S2 PE = 2 SV = 1 - [E1BT82_CHICK]
EIF2S2 37.9/6.13 71.23 4 −0.44 0.0040 Translation initiation factor activity
Q5ZJ39 Density-regulated protein OS = Gallus gallus GN = DENR PE = 2 SV = 1 - [DENR_CHICK]
DENR 22.1/5.21 60.49 1 −0.41 0.0080 Translation initiation factor activity
F1NS60 Uncharacterized protein (Fragment) OS = Gallus gallus GN = MMS19 PE = 4 SV = 2 - [F1NS60_CHICK]
MMS19 111.8/5.99 55.46 1 −0.38 0.0038 Transcription coactivator activity
E1C4N0 Uncharacterized protein OS = Gallus gallus GN = RPS10 PE = 4 SV = 2 - [E1C4N0_CHICK]
RPS10 18.9/10.15 183.89 6 −0.36 0.0068 Structural constituent of ribosome
R4GL23 Uncharacterized protein OS = Gallus gallus GN = CHTOP PE = 4 SV = 1 - [R4GL23_CHICK]
CHTOP 26.3/12.23 83.09 2 −0.30 0.0036 Transcription export complex
F1NLT8 Uncharacterized protein (Fragment) OS = Gallus gallus GN = ARHGDIB PE = 4 SV = 1 - [F1NLT8_CHICK]
ARHGDIB 23.2/5.2 235.16 7 −0.29 0.0435 Rho GDP-dissociation inhibitor activity
F1NA55 Eukaryotic translation initiation factor 2A OS = Gallus gallus GN = EIF2A PE = 2 SV = 2 - [F1NA55_CHICK]
EIF2A 62.7/8.79 62.63 1 0.27 0.0449 Translation initiation factor activity
Q800W4 TIA-1 OS = Gallus gallus GN = TIA1 PE = 2 SV = 1 - [Q800W4_CHICK] TIA1 41.3/7.72 62.06 1 0.29 0.0074 Nucleotide binding
Immune response
P40618 High mobility group protein B3 OS = Gallus gallus GN = HMGB3 PE = 2 SV = 3 - [HMGB3_CHICK]
HMGB3 23/8.12 126.17 4 −0.59 0.0009 DNA binding
Q9YH06 High mobility group protein B1 OS = Gallus gallus GN = HMGB1 PE = 1 SV = 1 - [HMGB1_CHICK]
HMGB1 24.9/5.74 165.42 6 −0.44 0.0084 DNA binding
E1C9I0 Unconventional myosin-Ig OS = Gallus gallus GN = MYO1G PE = 4 SV = 2 - [E1C9I0_CHICK]
MYO1G 115/8.78 203.91 7 −0.47 0.0410 Nucleotide-binding(motor activity)
E1BTE2 Uncharacterized protein OS = Gallus gallus GN = SERPINB5 PE = 3 SV = 2 - [E1BTE2_CHICK]
SERPINB5 42.6/5.96 218.9 7 −0.40 0.0017 Serine-type
endopeptidase inhibitor activity
Q90643 Interferon regulatory factor 3 OS = Gallus gallus GN = IRF3 PE = 2 SV = 1 - [IRF3_CHICK]
IRF3 54.4/5.21 45.52 2 −0.33 0.0460 Activation of innate
immune response
E1BWS0 Uncharacterized protein OS = Gallus gallus GN = GIT2 PE = 4 SV = 2 - [E1BWS0_CHICK]
GIT2 84.5/6.98 29.12 1 −0.32 0.0461 ARF GTPase activator
activity
E1BUY6 Uncharacterized protein OS = Gallus gallus GN = HMHA1 PE = 4 SV = 2 - [E1BUY6_CHICK]
HMHA1 103.3/7.97 29.79 1 −0.31 0.0080 GTPase activator activity
E1BVP2 Uncharacterized protein OS = Gallus gallus GN = PLD1 PE = 4 SV = 2 - [E1BVP2_CHICK]
PLD1 118.9/8.98 50.12 2 −0.27 0.0397 Defense response to
Gram-positive bacterium
Zhang
et
al.
Proteome
Science
(2015) 13:9
Page
8
of
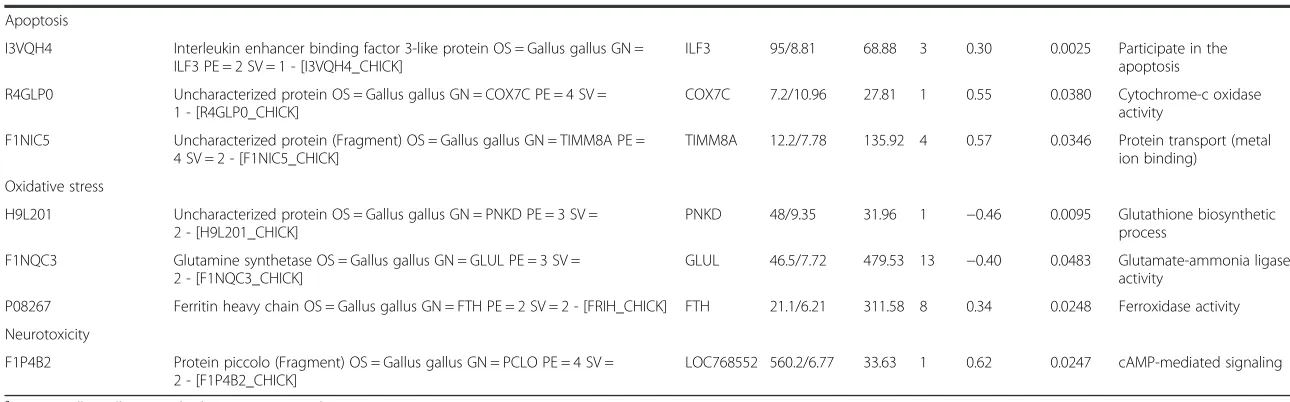
Table 3 List of differentially expressed proteins in small intestinal mucosal samples from treatment group and control group(Continued)
Apoptosis
I3VQH4 Interleukin enhancer binding factor 3-like protein OS = Gallus gallus GN = ILF3 PE = 2 SV = 1 - [I3VQH4_CHICK]
ILF3 95/8.81 68.88 3 0.30 0.0025 Participate in the
apoptosis
R4GLP0 Uncharacterized protein OS = Gallus gallus GN = COX7C PE = 4 SV = 1 - [R4GLP0_CHICK]
COX7C 7.2/10.96 27.81 1 0.55 0.0380 Cytochrome-c oxidase
activity
F1NIC5 Uncharacterized protein (Fragment) OS = Gallus gallus GN = TIMM8A PE = 4 SV = 2 - [F1NIC5_CHICK]
TIMM8A 12.2/7.78 135.92 4 0.57 0.0346 Protein transport (metal ion binding)
Oxidative stress
H9L201 Uncharacterized protein OS = Gallus gallus GN = PNKD PE = 3 SV = 2 - [H9L201_CHICK]
PNKD 48/9.35 31.96 1 −0.46 0.0095 Glutathione biosynthetic
process
F1NQC3 Glutamine synthetase OS = Gallus gallus GN = GLUL PE = 3 SV = 2 - [F1NQC3_CHICK]
GLUL 46.5/7.72 479.53 13 −0.40 0.0483 Glutamate-ammonia ligase activity
P08267 Ferritin heavy chain OS = Gallus gallus GN = FTH PE = 2 SV = 2 - [FRIH_CHICK] FTH 21.1/6.21 311.58 8 0.34 0.0248 Ferroxidase activity
Neurotoxicity
F1P4B2 Protein piccolo (Fragment) OS = Gallus gallus GN = PCLO PE = 4 SV = 2 - [F1P4B2_CHICK]
LOC768552 560.2/6.77 33.63 1 0.62 0.0247 cAMP-mediated signaling
a
Uniprot_Gallus gallus_9031 database accession number. b
The name of the protein exclusive of the identifier that appears in the database. c
Theoretical molecular mass (kDa). d
Theoretical pI. e
The sum of the scores of the individual peptides. f
The number of distinct peptide sequences in the protein group. g
Differential protein expression in the treatment group was presented as a log2fold change relative to the control group.
Zhang
et
al.
Proteome
Science
(2015) 13:9
Page
9
of
involved in energy metabolism; SFN involved in cell growth and proliferation; and EIF2A involved in tran-scriptional and translational regulation) were selected for functional validation at the mRNA level using qPCR (Figure 4). The protein levels of GLUD1, CD36, SDHA and EIF2A were consistent with their mRNA expres-sion levels. The results for the remaining three proteins were inconsistent between the mRNA levels and the protein levels. Possible reasons for these inconsistent results include the following: 1) the relationships be-tween the mRNA levels and the protein levels were indirect, 2) there were some post-translational effects and/or the function of other regulatory mechanisms, and 3) there was a time delay between responses on the mRNA and protein levels [24].
Discussion
Ammonia influences different organs and physiological functions in animals due to oxidative stress and inflam-mation; therefore, excess concentration of ammonia lead to plenty of health problems in the body. More and more evidence demonstrates that high concentrations of ammonia impairs energy metabolism, and induces cell apoptosis and mitochondrial damage in the mucosa of GI tract [10,12,13]. To identify the molecular mecha-nisms related to the exposure to high concentration of
atmospheric ammonia in broilers, we compared the growth parameters, immune organ development, gut morphology, serum parameters and small intestinal mucosa proteome of control (ammonia concentration, 3 ± 3μL/L) with those exposed to high level of ambient
ammonia (ammonia concentration, 75 ± 3 μL/L). On
the whole, exposure to high concentrations of ambient am-monia (75 ± 3μL/L) greatly reduced the growth of broilers. In addition to the reduction of growth performance, exposure to high concentrations of ammonia also re-sulted in interference with multiple physiological func-tions in broilers. As two of the most important immune organs, indices of intestine and spleen were reduced in TRET group compared to CTRL group. Moreover, ammonia-exposed chickens had much lower villus height and crypt depth among different segments of small intestine. These results indicated that exposure to high concentrations of atmospheric ammonia mainly ex-erts negative impacts on intestine mucosal structure and immune organ development of chickens [25], which may cause huge damages to nutrients absorption and im-mune system. Increased activity of serum CK and de-creased activity of serum T-SOD indicated oxidative stress in ammonia-exposed broilers. Previous study also reports that obvious pathomorphological changes were observed in kidneys and livers in broiler chickens
Figure 3GO distribution analysis of differentially expressed proteins in small intestinal mucosal samples from treatment group and control group.The right coordinate axis indicates the number of proteins for each GO annotation, and the left one represents the proportion of proteins for every GO annotation.
under the dynamic range of atmospheric ammonia (31–95 ppm) [8].
A total of 43 proteins related to nutrient metabolism, apoptosis, immune and oxidative response, transcrip-tional and translatranscrip-tional regulation, and cell cytoskeleton and growth altered in abundances corresponding to the change in intestinal histomorphology of ammonia-exposed broilers. Of these, up-regulation proteins in-volved in energy metabolism and apoptosis may induce the mitochondrial apoptosis resulting in an increase rate of oxidative phosphorylation under stress, whereas down-regulation of immune and nutrient metabolic pro-teins may decrease the anti-microbial ability and nutri-ent absorption in the intestine itself.
Cytoskeletal proteins have crucial roles in the matur-ation, migrmatur-ation, and renewal of epithelial cells along the crypt-villus axis [24,34,35]. In this study, two differential protein species related to cytoskeleton were down-regulated in the small intestinal mucosa of ammonia exposed broilers. FLNA is an actin cross-linking protein that is crucial for actin cytoskeleton organization partici-pating in cellular architectural and signaling functions
[36-38]. LASP1 is a cytoskeletal adaptor protein, which has been reported as a signal molecule playing role in the differentiation of parietal cells [39,40]. This is con-sistent with the finding in this study that lower villus height and crypt depth among different segments of small intestine was observed in TRET group. As a result, the surface area of the intestine was decreased, and finally resulted in impairment of digestion and absorp-tion efficiency in the gut. Other proteins involved in cell
growth and proliferation, including SFN, RPL23,
ZNF598 and SEPT12, are also down-regulated, and may harm the mucosal regeneration in GI tract due to ammonia exposure related injury [41-43]. Furthermore, the reduced abundance of proteins relevant to transcrip-tional and translatranscrip-tional regulation, including HMGN1, DYNC2H1, EIF2S2, DENR, MMS19, RPS10, CHTOP and ARHGDIB, is observed in TRET group, which indi-cates a decreased capacity for protein synthesis to impair overall gut function and integrity [44-50].
Excess concentration of ammonia induces oxidative stress in various tissues, which can trigger inflammation and subsequent apoptosis [13]. In the present study,
Figure 4qPCR validation of seven proteins of differential abundance from the intestinal mucosa of 42-day-old AA broilers at the mRNA level (A, B, C, D, E, F and G).Samples were normalized with the reference geneβ-actin. Vertical lines represent ± S.D, and different letters denote significant difference atP< 0.05 (n = 6).
three and three differential protein species were identi-fied in the categories of oxidative stress and apoptosis, respectively. Of these proteins, PNKD protein plays an important role in maintaining cellular redox status [51]; GLUL activity is an indicator of free radical-mediated oxidative damage in tissue injury [52]; FTH is a core subunit of iron-binding protein ferritin, which is induced to protect against oxidative stress [53,54]; ILF3 partici-pates in apoptosis, its expression is up-regulated during apoptosis induced by H2O2in murine macrophages [55]; COX7C is shown to represent the rate-limiting step of mitochondrial electron transport chain in normal condi-tion [56], however, its expression cannot be controlled under oxidative stress induced apoptosis, increasing thermogenesis and the rate of oxidative phosphorylation [57]; TIMM8A is a mitochondrial intermembrane space (IMS) protein that is involved in caspase-independent cell death [58]. Down-regulation of PNKD and GLUL along with up-regulation of FTH, ILF3, COX7C and TIMM8A in the treatment group suggests that, the small intestinal mucosa of ammonia-exposed broilers are under oxidative stress, which triggers the elevation of apoptosis. Moreover, previous research has proven that oxidative stress is related to the impairment of energy metabolism [59]. In this study, proteins involved in oxi-dative phosphorylation, including NDUFB3, SDHA and ATHL1 [60,61], are up-regulated, and indicate that ATP production and oxidative phosphorylation are uncoupled due to oxidative stress induced by ammonia, which may explain why the feed-conversion efficiency is reduced in ammonia-exposed broilers.
As the biggest immune organ in the body, intestine plays very important roles in defense of invasion of harmful bacteria and xenobiotics [14]. In the present study, eight differential protein species related to im-mune response were down-regulated in the treatment group. HMGB1 and HMGB3 serve as immunogenic nu-cleic acids binding proteins that are generally involved in the nucleic acid receptor-mediated activation of innate
immune responses [62,63]; MYO1G is a plasma
membrane-associated class I myosin contributing to T-cell activation [64]; SERPINB5 is a tumor suppressor that plays a role in protein binding [65]; IRF3 is a tran-scription factor that plays distinct role in innate antiviral response [66]; GIT2 is one of regulators of G protein-coupled receptor (GPCR), and loss of GIT2in vivoleads to an immunodeficient state [67]; HMHA1 is a major target of immune responses also playing a role in T-cell activation [68]; and PLD1 contributes to the essential function of macrophages for protecting against a wide
variety of invading microorganisms [69].
Down-regulation of these proteins in the treatment group sug-gests that, the immunity of gut is under low condition in ammonia-exposed broilers, which increases possibilities
of bacterial or viral infection and probably leads to lower growth rate.
Ammonia has been reported to interfere with nutrient metabolism in mammals, such as reduced fatty acid oxidation, vitamins and amino acids synthesis disorder, and inhibitory of gluconeogenesis [10,70,71]. In the in-testinal mucosa of ammonia-exposed broilers, differen-tial proteins involved in carbohydrate/amino acid/lipid/ vitamin metabolism indicate that impairment of nutrient absorption and digestion is related to metabolic changes in the intestine, which affects gluconeogenesis, vitamin A synthesis and fatty acid metabolism.
Conclusions
This study integrates traditional nutritional, morpho-logical and state of the art proteomic approaches to identify the impact of high concentrations of atmos-pheric ammonia exposure on intestine of broilers. Reduced growth rate was observed in broilers exposed to high level of environmental ammonia. Possible rea-sons for exposure to ammonia derived influence on broilers are related to intestinal immune and histomor-phology. Integrative data analysis indicates that exposure to high amount environmental ammonia resulted in sig-nificant changes in the development of immune organs and intestinal villi, and mucosal proteome of AA broilers. These changes might be resulting from oxida-tive stress induced by ammonia. Several proteins are identified to related to immune response, oxidative stress, apoptosis and mucosal structure, and thus play key roles in nutrient consumption and absorption. This study identifies the potential molecular mechanisms of high concentrations of atmospheric ammonia exposure to broilers and provides new knowledge that can be used for possible intervention using nutritional strat-egies in the future.
Additional files
Additional file 1: Table S1.Composition of the experimental diet and calculated proximate composition of the diet.
Additional file 2: Table S2.The qPCR primers used for verification of the differentially expressed genes of the AA broiler small intestinal mucosa.
Additional file 3: Table S3.List of all proteins (n = 2726) identified in the study.
Additional file 4: Table S4.List of all differently expressed proteins (n = 70) identified in the study.
Abbreviations
CD36:Cluster of differentiation 36; SFN: Stratifin; RPL23: Ribosomal protein L23; ZNF598: Zinc finger protein 598; SEPT12: Septin 12; HMGN1: High mobility group nucleosome binding domain 1; DYNC2H1: Dynein, cytoplasmic 2, heavy chain 1; EIF2S2: Eukaryotic translation initiation factor 2, subunit 2 beta; MMS19: MMS19 nucleotide excision repair homolog; RPS10: Ribosomal protein S10; CHTOP: Chromatin target of PRMT1; ARHGDIB: Rho GDP dissociation inhibitor (GDI) beta; PNKD: Paroxysmal nonkinesigenic dyskinesia; COX7C: Cytochrome c oxidase subunit VIIc; TIMM8A: Translocase of inner
mitochondrial membrane 8 homolog A; NDUFB3: NADH dehydrogenase (ubiquinone) 1 beta subcomplex, 3; ATHL1: Acid trehalase-like 1;
SERPINB5: Serpin peptidase inhibitor, clade B (Ovalbumin), member 5; GIT2: G protein-coupled receptor kinase interacting ArfGAP 2; HMHA1: Histocompatibility (Minor) HA-1; PLD1: Phospholipase D1.
Competing interests
The authors declare that they have no competing interests.
Authors’contributions
JZ and HZ designed the study. JZ and CL performed the experiments and analyzed the data. JZ, XT, QL and RS contributed reagents/materials/analysis tools. JZ prepared the manuscript and all of the authors contributed to, read and approved the final manuscript.
Acknowledgements
This research was supported by the Chinese National Science and Technology Pillar Program (No: 2012BAD39B0) and the Special Fund for Innovation Team of the Chinese Academy of Agricultural Sciences (No: ASTTP-IAS07).
Received: 27 October 2014 Accepted: 11 February 2015
References
1. NRC. Air emissions from animal feeding operations: current knowledge, future needs. Washington DC: The National Academies Press; 2003. 2. van Aardenne JA, Dentener FJ, Olivier JGJ, Goldewijk C, Lelieveld J. A 1
degrees × 1 degrees resolution data set of historical. anthropogenic trace gas emissions for the period 1890–1990. Glob Biogeochem Cycles. 2001;15:909–28.
3. US EPA. National emission inventory: ammonia emissions from animal husbandry operations. Washington DC: U.S. EPA; 2004.
4. Miles DM, Branton SL, Lott BD. Atmospheric ammonia is detrimental to the performance of modern commercial broilers. Poult Sci. 2004;83:1650–4. 5. Shlomo Y. Ammonia affects performance and thermoregulation of male
broiler chickens. Anim Res. 2004;53:289–93.
6. Sherlock L, McKeegan DE, Cheng Z, Wathes CM, Wathes DC. Effects of contact dermatitis on hepatic gene expression in broilers. Br Poult Sci. 2012;53:439–52.
7. Wei FX, Xu B, Hu XF, Li SY, Liu FZ, Sun QY, et al. The effect of ammonia and humidity in poultry houses on intestinal morphology and function of broilers. J Anim Vet Adv. 2012;11:3641–6.
8. Witkowska D, Sowinska J, Iwanczuk Czernik K, Mituniewicz T, Wojcik A, Szarek J. The effect of a disinfectant on the ammonia concentration on the surface of litter, air and the pathomorphological picture of kidneys and livers in broiler chickens. Archiv fur Tierzucht. 2006;49:249–56. 9. Bobermin LD, Quincozes-Santos A, Guerra MC, Leite MC, Souza DO,
Gonçalves CA, et al. Resveratrol prevents ammonia toxicity in astroglial cells. PLoS One. 2012;7:e52164.
10. Cremin Jr JD, Fitch MD, Fleming SE. Glucose alleviates ammonia-induced inhibition of short-chain fatty acid metabolism in rat colonic epithelial cells. Am J Physiol Gastrointest Liver Physiol. 2003;285:105–14.
11. Andriamihaja M, Davila AM, Eklou-Lawson M, Petit N, Delpal S, Allek F, et al. Colon luminal content and epithelial cell morphology are markedly modified in rats fed with a high-protein diet. Am J Physiol Gastrointest Liver Physiol. 2010;299:1030–7.
12. Tsujii M, Kawano S, Tsuji S, Fusamoto H, Kamada T, Sato N. Mechanism of gastric mucosal damage induced by ammonia. Gastroenterology. 1992;102:1881–8.
13. Igarashi M, Kitada Y, Yoshiyama H, Takagi A, Miwa T, Koga Y. Ammonia as an accelerator of tumor necrosis factor alpha-induced apoptosis of gastric epithelial cells in Helicobacter pylori infection. Infect Immun. 2001;69:816–21.
14. Furness JB, Kunze WA, Clerc N. Nutrient tasting and signaling mechanisms in the gut. II. The intestine as a sensory organ: neural, endocrine, and immune responses. Am J Physiol. 1999;277:922–8.
15. Wang X, Yang F, Liu C, Zhou H, Wu G, Qiao S, et al. Dietary
supplementation with the probiotic Lactobacillus fermentum I5007 and the antibiotic aureomycin differentially affects the small intestinal proteomes of weanling piglets. J Nutr. 2012;142:7–13.
16. Wang X, Ou D, Yin J, Wu G, Wang J. Proteomic analysis reveals altered expression of proteins related to glutathione metabolism and apoptosis in the small intestine of zinc oxide-supplemented piglets. Amino Acids. 2009;37:209–18.
17. Soler L, Niewold TA, Moreno Á, Garrido JJ. Proteomic approaches to study the pig intestinal system. Curr Protein Pept Sci. 2014;15:89–99.
18. Choi PM, Guo J, Erwin CR, Wandu WS, Leinicke JA, Xie Y, et al. Disruption of retinoblastoma protein expression in the intestinal epithelium impairs lipid absorption. Am J Physiol Gastrointest Liver Physiol. 2014;306:909–15. 19. Ahmad MK, Khan AA, Mahmood R. Alterations in brush border membrane
enzymes, carbohydrate metabolism and oxidative damage to rat intestine by potassium bromate. Biochimie. 2012;94:2776–82.
20. Keszthelyi D, Troost FJ, Jonkers DM, van Eijk HM, Lindsey PJ, Dekker J, et al. Serotonergic reinforcement of intestinal barrier function is impaired in irritable bowel syndrome. Aliment Pharmacol Ther. 2014;40:392–402. 21. Li C, Li Q, Liu YY, Wang MX, Pan CS, Yan L, et al. Protective effects of
Notoginsenoside R1 on intestinal ischemia-reperfusion injury in rats. Am J Physiol Gastrointest Liver Physiol. 2014;306:111–22.
22. Kleinman MT, Araujo JA, Nel A, Sioutas C, Campbell A, Cong PQ, et al. Inhaled ultrafine particulate matter affects CNS inflammatory processes and may act via MAP kinase signaling pathways. Toxicol Lett. 2008;178:127–30.
23. Huang J, Zhang Y, Zhou Y, Zhang Z, Xie Z, Zhang J, et al. Green tea polyphenols alleviate obesity in broiler chickens through the regulation of lipid-metabolism-related genes and transcription factor expression. J Agric Food Chem. 2013;61:8565–72.
24. Luo J, Zheng A, Meng K, Chang W, Bai Y, Li K, et al. Proteome changes in the intestinal mucosa of broiler (Gallus gallus) activated by probiotic Enterococcus faecium. J Proteomics. 2013;91:226–41.
25. Uni Z, Gal-Garber O, Geyra A, Sklan D, Yahav S. Changes in growth and function of chick small intestine epithelium due to early thermal conditioning. Poult Sci. 2001;80:438–45.
26. Diz AP, Truebano M, Skibinski DO. The consequences of sample pooling in proteomics: an empirical study. Electrophoresis. 2009;30:2967–75. 27. Su L, Cao L, Zhou R, Jiang Z, Xiao K, Kong W, et al. Identification of novel
biomarkers for sepsis prognosis via urinary proteomic analysis using iTRAQ labeling and 2D-LC-MS/MS. PLoS One. 2013;8:e54237.
28. Olsen JV, Blagoev B, Gnad F, Macek B, Kumar C, Mortensen P, et al. Global, in vivo, and site-specific phosphorylation dynamics in signaling networks. Cell. 2006;127:635–48.
29. Hakimov HA, Walters S, Wright TC, Meidinger RG, Verschoor CP, Gadish M, et al. Application of iTRAQ to catalogue the skeletal muscle proteome in pigs and assessment of effects of gender and diet dephytinization. Proteomics. 2009;9:4000–16.
30. Ye J, Fang L, Zheng H, Zhang Y, Chen J, Zhang Z, et al. WEGO: a web tool for plotting GO annotations. Nucleic Acids Res. 2006;34:293–7.
31. Zi J, Zhang J, Wang Q, Zhou B, Zhong J, Zhang C, et al. Stress responsive proteins are actively regulated during rice (Oryza sativa) embryogenesis as indicated by quantitative proteomics analysis. PLoS One. 2013; 8:e74229.
32. Chulayo AY, Muchenje V. The effects of pre-slaughter stress and season on the activity of plasma creatine kinase and mutton quality from different sheep breeds slaughtered at a smallholder abattoir. Asian-Australas J Anim Sci. 2013;26:1762–72.
33. Dong XY, Azzam MM, Rao W, Yu DY, Zou XT. Evaluating the impact of excess dietary tryptophan on laying performance and immune function of laying hens reared under hot and humid summer conditions. Br Poult Sci. 2012;53:491–6.
34. Di Garbo A, Johnston MD, Chapman SJ, Maini PK. Variable renewal rate and growth properties of cell populations in colon crypts. Phys Rev E Stat Nonlin Soft Matter Phys. 2010;81:061909.
35. Gordon JI, Hermiston ML. Differentiation and self-renewal in the mouse gastrointestinal epithelium. Curr Opin Cell Biol. 1994;6:795–803.
36. van der Flier A, Sonnenberg A. Structural and functional aspects of filamins. Biochim Biophys Acta. 2001;1538:99–117.
37. Tu Y, Wu S, Shi X, Chen K, Wu C. Migfilin and Mig-2 link focal adhesions to filamin and the actin cytoskeleton and function in cell shape modulation. Cell. 2003;113:37–47.
38. Stossel TP, Condeelis J, Cooley L, Hartwig JH, Noegel A, Schleicher M, et al. Filamins as integrators of cell mechanics and signalling. Nat Rev Mol Cell Biol. 2001;2:138–45.
39. Iiizumi G, Sadoya Y, Hino S, Shibuya N, Kawabata H. Proteomic
characterization of the site-dependent functional difference in the rat small intestine. Biochim Biophys Acta. 2007;1774:1289–98.
40. Jain RN, Samuelson LC. Differentiation of the gastric mucosa. II. Role of gastrin in gastric epithelial cell proliferation and maturation. Am J Physiol Gastrointest Liver Physiol. 2006;291:762–5.
41. Murphy EF, Hooiveld GJ, Muller M, Calogero RA, Cashman KD. Conjugated linoleic acid alters global gene expression in human intestinal-like Caco-2 cells in an isomer-specific manner. J Nutr. 2007;137:2359–65.
42. Wanzel M, Russ AC, Kleine-Kohlbrecher D, Colombo E, Pelicci PG, Eilers M. A ribosomal protein L23-nucleophosmin circuit coordinates Mizl function with cell growth. Nat Cell Biol. 2008;10:1051–61.
43. Morita M, Ler LW, Fabian MR, Siddiqui N, Mullin M, Henderson VC, et al. A novel 4EHP-GIGYF2 translational repressor complex is essential for mammalian development. Mol Cell Biol. 2012;32:3585–93.
44. Ostergaard M, Hansen GA, Vorum H, Honoré B. Proteomic profiling of fibroblasts reveals a modulating effect of extracellular calumenin on the organization of the actin cytoskeleton. Proteomics. 2006;6:3509–19. 45. Birger Y, West KL, Postnikov YV, Lim JH, Furusawa T, Wagner JP, et al.
Chromosomal protein HMGN1 enhances the rate of DNA repair in chromatin. EMBO J. 2003;22:1665–75.
46. Schmidts M, Arts HH, Bongers EM, Yap Z, Oud MM, Antony D, et al. Exome sequencing identifies DYNC2H1 mutations as a common cause of asphyxiating thoracic dystrophy (Jeune syndrome) without major polydactyly, renal or retinal involvement. J Med Genet. 2013;50:309–23. 47. Skabkin MA, Skabkina OV, Dhote V, Komar AA, Hellen CU, Pestova TV.
Activities of Ligatin and MCT-1/DENR in eukaryotic translation initiation and ribosomal recycling. Genes Dev. 2010;24:1787–801.
48. van Wietmarschen N, Moradian A, Morin GB, Lansdorp PM, Uringa EJ. The mammalian proteins MMS19, MIP18, and ANT2 are involved in cytoplasmic iron-sulfur cluster protein assembly. J Biol Chem. 2012;287:43351–8. 49. Fanis P, Gillemans N, Aghajanirefah A, Pourfarzad F, Demmers J, Esteghamat
F, et al. Five friends of methylated chromatin target of protein-arginine-methyltransferase[prmt]-1 (chtop), a complex linking arginine methylation to desumoylation. Mol Cell Proteomics. 2012;11:1263–73.
50. Marc Rhoads J, Wu G. Glutamine, arginine, and leucine signaling in the intestine. Amino Acids. 2009;37:111–22.
51. Shen Y, Lee HY, Rawson J, Ojha S, Babbitt P, Fu YH, et al. Mutations in PNKD causing paroxysmal dyskinesia alters protein cleavage and stability. Hum Mol Genet. 2011;20:2322–32.
52. Oliver CN, Starke-Reed PE, Stadtman ER, Liu GJ, Carney JM, Floyd RA. Oxidative damage to brain proteins, loss of glutamine synthetase activity, and production of free radicals during ischemia/reperfusion-induced injury to gerbil brain. Proc Natl Acad Sci U S A. 1990;87:5144–7.
53. Aung W, Hasegawa S, Furukawa T, Saga T. Potential role of ferritin heavy chain in oxidative stress and apoptosis in human mesothelial and mesothelioma cells: implications for asbestos-induced oncogenesis. Carcinogenesis. 2007;28:2047–52.
54. Polyzos S, Kountouras J, Zavos C, Papatheodorou A, Katsiki E, Patsiaoura K, et al. Serum ferritin in patients with nonalcoholic fatty liver disease: evaluation of ferritin to adiponectin ratio and ferritin by homeostatic model of assessment insulin resistance product as non-invasive markers. Immuno-Gastroenterology. 2012;1:119–26.
55. Fong CC, Zhang Y, Zhang Q, Tzang CH, Fong WF, Wu RS, et al. Dexamethasone protects RAW264.7 macrophages from growth arrest and apoptosis induced by H2O2through alteration of gene expression patterns
and inhibition of nuclear factor-kappa B (NF-kappaB) activity. Toxicology. 2007;236:16–28.
56. Villani G, Greco M, Papa S, Attardi G. Low reserve of cytochrome c oxidase capacity in vivo in the respiratory chain of a variety of human cell types.
J Biol Chem. 1998;273:31829–36.
57. Kadenbach B, Arnold S, Lee I, Hüttemann M. The possible role of cytochrome c oxidase in stress-induced apoptosis and degenerative diseases. Biochim Biophys Acta. 2004;1655:400–8.
58. Arnoult D, Rismanchi N, Grodet A, Roberts RG, Seeburg DP, Estaquier J, et al. Bax/Bak-dependent release of DDP/TIMM8a promotes Drp1-mediated mitochondrial fission and mitoptosis during programmed cell death. Curr Biol. 2005;15:2112–8.
59. Zaza G, Granata S, Masola V, Rugiu C, Fantin F, Gesualdo L, et al. Downregulation of nuclear-encoded genes of oxidative metabolism in dialyzed chronic kidney disease patients. PLoS One. 2013;8:e77847.
60. Sparks LM, Xie H, Koza RA, Mynatt R, Hulver MW, Bray GA, et al. A high-fat diet coordinately downregulates genes required for mitochondrial oxidative phosphorylation in skeletal muscle. Diabetes. 2005;54:1926–33.
61. SokolovićM, Wehkamp D, SokolovićA, Vermeulen J, Gilhuijs-Pederson LA, van Haaften RI, et al. Fasting induces a biphasic adaptive metabolic response in murine small intestine. BMC Genomics. 2007;8:361.
62. Yanai H, Ban T, Taniguchi T. Essential role of high-mobility group box proteins in nucleic acid-mediated innate immune responses. J Intern Med. 2011;270:301–8.
63. Zhang Q, Wang Y. High mobility group proteins and their post-translational modifications. Biochim Biophys Acta. 2008;1784:1159–66.
64. Lopez GP, Ostap EM, Shaw S. Myosin 1G is a hematopoietic-restricted protein highly enriched in lymphocyte plasma membrane/microvilli whose deficiency impairs lymphocyte activation. J Immunol. 2009;182:35.40. 65. Ding Y, Lu B, Chen D, Meng L, Shen Y, Chen S. Proteomic analysis of
colonic mucosa in a rat model of irritable bowel syndrome. Proteomics. 2010;10:2620–30.
66. Collins SE, Noyce RS, Mossman KL. Innate cellular response to virus particle entry requires IRF3 but not virus replication. J Virol. 2004;78:1706–17. 67. Mazaki Y, Hashimoto S, Tsujimura T, Morishige M, Hashimoto A, Aritake K,
et al. Neutrophil direction sensing and superoxide production linked by the GTPase-activating protein GIT2. Nat Immunol. 2006;7:724–31.
68. Nicholls S, Piper KP, Mohammed F, Dafforn TR, Tenzer S, Salim M, et al. Secondary anchor polymorphism in the HA-1 minor histocompatibility antigen critically affects MHC stability and TCR recognition. Proc Natl Acad Sci U S A. 2009;106:3889–94.
69. Tian Y, Pate C, Andreolotti A, Wang L, Tuomanen E, Boyd K, et al. Cytokine secretion requires phosphatidylcholine synthesis. J Cell Biol. 2008;181:945–57. 70. Comar JF, Suzuki-Kemmelmeier F, Constantin J, Bracht A. Hepatic zonation
of carbon and nitrogen fluxes derived from glutamine and ammonia transformations. J Biomed Sci. 2010;17:1.
71. Essa MM, Subramanian P. Pongamia pinnata modulates the oxidant-antioxidant imbalance in ammonium chloride-induced hyperammonemic rats. Fundam Clin Pharmacol. 2006;20:299–303.
Submit your next manuscript to BioMed Central and take full advantage of:
• Convenient online submission
• Thorough peer review
• No space constraints or color figure charges
• Immediate publication on acceptance
• Inclusion in PubMed, CAS, Scopus and Google Scholar
• Research which is freely available for redistribution
Submit your manuscript at www.biomedcentral.com/submit