Abstract—To obtain optimal process parameter for efficient operation of castor oil for lubricant by using Taguchi Method
Index Terms— Castor oil, Jojoba oil, Lubricant,
Tribology /Taguchi method,
I. INTRODUCTION
India is growing as a developing country which economic growth is stable in india’s and abroad for industrial sector and power foundation units to establishing generation of power, transformation and consumption of lubricants. Lubricant is a substance which is primarily used to minimize friction between two contacting surfaces in relative motion by forming a protective layer between moving surfaces. The formation of layer depends upon lubricant properties and operational condition such as load, speed, temperature and environmental condition. The most important single factor that determines the effectiveness of the oil is the viscosity of the oil.
Main purposes of lubrication are as follows;
- To prevent wear and premature fatigue by forming the lubrication film on the surface of load transferring parts to prevent contacts between metals.
- To enhance the favorable driving characteristics, such as low noise or friction.
-To prevent overheating of bearings and to prevent lubricant s own deterioration by radiating the generated heat to outside. It works particularly well if the circulation lubrication method is adopted.
- To prevent foreign material penetration, rust, and corrosion.
Mechanism of Lubrication
To provide motion to a body relative to another one there is a need of constant tangential force, this constant force depends upon the normal force exerting on the body. The
Manuscript received June, 2016.
Abhinay Dewangan, Department of Mechanical Engineering, Dr. C.V.Raman Institute of Science and Technology, Kota, Chhattisgarh, India. Bilaspur, India, Phone/ Mobile No- 7043349908
Narendra Kumar Ppatel,(Asst. Professor), Department of Mechanical
Engineering, Dr. C.V.Raman Institute of Science and Technology, Kota, Chhattisgarh, India. Bilaspur, India, Phone/ Mobile No- 9407689335
ratio of tangential force and normal force is called coefficient of friction.
Coefficient of friction (f) = Tangential force / Normal force To keep the body is in motion a constant tangential force is required to overcome the frictional resistance between the two surfaces. Frictional resistance arises due torough moving surfaces and hence small irregularities will fit together at the contact area to give mechanical lock to the motion. If moving surfaces are to smooth the molecular attraction will be more at interface and will resist the motion. Friction between the dry surfaces arises either from surface irregularities or molecular attraction or both.
The resistance between moving surfaces can be reduced by introducing a small film of lubrication between the moving surfaces so that there is no physical contact. By application of lubricant small irregularities are filled by it so mechanical lock problem is reduced and since there is no contact hence there is no molecular attraction and there is reduction in friction force and energy loss is reduced. Selection Criteria of Lubricant
Selection of lubricants depends upon many factors such as application, machines, working
Environment, conditions etc. But the oil viscosity is the most important property to provide maximum lubricant effectiveness, followed closely by additives.
There is a minimum acceptable limit for the components based on the component geometry, surface area, surface contact (sliding or rolling), surface contact speed, expected load and environmental condition. Selection of lubricants is decided mainly on the basis of load and speed combination such as
A. Low load and low speed B. Low load and high speed C. High load and low speed D. High load and high speed Lubricant characteristics
Viscosity Index (VI) - The Viscosity index indicates changes in viscosity with changes in temperature. A high VI indicates small changes in temperature; where as a low VI
To obtain optimal process parameter for efficient
operation of castor oil for lubricant by using
Taguchi Method
Abhinay Dewangan, Narendra Kumar Patelindicates high changes in temperature. Vegetable oil-based bio lubricants have higher VI than mineral oils, which ensures that bio lubricants remain effective even at high temperatures by maintaining the thickness of the oil film. Hence, bio lubricants are suitable for a wide temperature range.
Flash Point & Fire Point - Flash point is the lowest temperature at which a lubricant must be heated before it vaporizes.
Oxidation Stability-Oxidation stability is the ability to exhibit resistance toward oxide-forming tendency, which increases when temperature rises.
Pour Point -Pour point is the lowest temperature at which oil flows or pours. Pour point is an important factor in coiling system lubrication.
Antiwear Properties
Cloud Point – Cloud point is a temperature at which solids dissolve in oil. Wax crystallizes and becomes visible when temperature drops
Aniline Point – It is the minimum equilibrium solution temperature for equal volumes of aniline and lubricating oil samples
Tribology
Lubrication is done to minimize friction between two solid surfaces in relative motion due to that friction is occurs. Every surface has peaks and valleys called 'roughness'. When two such surfaces come into contact, it is only the peaks on the surfaces that make actual contact. These contacts support the normal load and spots and get cold welded. Depending upon the magnitude of the normal load spots or peaks come into contact This phenomenon is called adhesion. Friction is considered by this adhesion. When two such surfaces have to be moved in relation to each other, some force will be need to be sheer contact. This force is called frictional force. Study of the phenomenon is called Tribology. This helps to visualizing the problems of friction, wear and lubrication involved in relative motion between surfaces.
Friction: Friction can be defined as resistance to movement between any two surfaces in contact with each other. When friction occurs in machinery, it is not so desirable. It destroys the effectiveness of the equipment through wear, heat and shortened life.
Wear: Wear can be defined as undesired removal of material due to mechanical action. It is a side way displacement of material from its derivative and original position on a solid surface performed by the action of another surface.
Lubrication: Lubrication is the reduction of friction to a minimum by replacing solid friction with fluid friction. Bio lubricants
Bio lubricants are made from vegetable oils and also made from synthetic esters and petroleum that satisfies the established biodegradability and toxicity criteria.
Vegetable oils are mainly made of triglycerides of fatty acids. Triglycerides are glycerol molecules with three long fatty acids are attached at the hydroxyl group via ester linkage.
Fatty acids in all vegetable oils are of similar length between 14 and 22 long carbon with varying level of un-saturation. Seed oil quality and utility is determined mainly by its fatty acid composition. Vegetable oils can be categorized as A. Edible oil – Coconut oil, Olive oil, Soybean oil, Palm oil,
Rapeseed oil, Corn etc.
B. Non edible oil – Jatropha oil, Jojoba oil, Castor oil, Mahua oil, Neem etc.
Jojoba oil (Pongamia Pinnata) – Jojoba oil kernels are white and covered by thin reddish skin. The composition of kernel is Moisture 19%, Oil 27.5%, and Protein 17.4 %.
I. Fatty acid composition of Jojoba oil
Fatty acid Structure Amount
Palmitic acid 16:0 3.7- 7.9
Stearic acid 18:0 2.4-8.9
Oleic acid 18:1 44.5-71.3
Linoleic acid 18:2 10.8-18.3
Lignoceric acid 24:0 1.1-3.5
Process of Oil Plant
EXPERIMENTAL WORK- Selection of oil plant seeds
OPTIMIZATION OF PROCESS PARAMETER FOR EFFECIENT OPERATION BLENDING OF OILS IN DIFFERENTRATIOS EXTRACTION OF OIL FROM THE PLANT AND SEEDS
PURIFYING OF EXTRACTED OIL SELECTION OF OIL PLANT
SEEDS
ARRANGEMENT OF OIL
SEEDS
There are so many non edible oils such as castor, Jojoba, mahua, neem, jatropha, kusum etc. Selection of oil is done on the basis of desired property and production and availability. Selected oil bearing plant species:-
Castor:Castor oil or ricinus oil is non-volatile fatty acid oil extracted from Castor bean seeds. Castor oil is color less to very pale yellow liquid with mild or odor or no taste. It has two derivatives known as blown castor oil. Hydrogenated castor oil is used in textiles, paints, varnishes, plastics, cosmetics etc.
The availability of castor oil is mainly in India and African country. It has good physical property such as high boiling point 319⁰C, high density 920 kg/m3. It is a triglyceride in which 90% fatty acid are ricinoleic acid. Oleic acid and linoleic acid are significant.[51]
Jojoba:: It’s scientific name is Millettia Pinnata. Jojoba is
widely distributed in tropical Asia. The tree is hardy, reasonably drought resistant and tolerant to salinity.
Fig. Refined Castor Oil Fig. Jojoba Oil Extraction of oil
A. Mechanical extraction:
B. Solvent extraction: The processing vegetable oil in commercial application is commonly done by chemical extraction, using solvent extracts, which produces higher yields and is quicker and less expensive.
Blending Plan: Castor oil blends with Jojoba are prepared in a definite ratio for the test the blending plan is as follows.
II. S. No. Refined Castor Oil (ml) Refined Jojoba Oil (ml) Mixing Ratio (%) Name 1 900 100 10 BLEND 1 2 850 150 15 BLEND 2 3 800 200 20 BLEND 3 4 750 250 25 BLEND 4 Test Setup:
Four Ball Wear Testing Machine with Data acquisition system TR 30 L Series& Digital Microscope
Fig- Four Ball Wear Testing Machine
Fig- ball pot and one ball pad
Technical Specification:
A. Maximum axial load – 11000 N B. Maximum speed – 2998 RPM C. Temperature – 100 degree centigrade D. Test ball diameter – 12.1 mm E. Scar range – 100 to 4000 micron F. Make - Ducom Engineers G. Standard – ASTM 4172 Testing Procedure:
A. Switch on the main MCB watch for all the RYB is glowing.
B. Switch on the controller and give some maximum time to set speed as per the test standard. C. Prepare ball pot assembly with test sample. D. Place ball pot over anti friction disc.
E. Bring down the loading arm and make zero on controller.
F. Place the required load as per the required test standard.
G. Make friction torque zero on controller. H. Now set the time as per the test standard. I. Open Winducom 2010 Software .
J. Click on RUN button. K. Click start Button . Input Parameters A. Load B. Speed C. Temperature D. Time Output parameters: A. Coefficient of friction B. Scar diameter Orthogonal Arrays
Taguchi provide a design passage to conducting the number of experiments. Conducting experiments depends upon the number of parameters and level of operation. Orthogonal arrays table shown that will give the number of experiments has to be conduct.
Table Orthogonal Arrays by Taguchi Number Of Parameter
Selection of Factors and their Levels
The Tribological experiment is carried out on Ducom 4 ball tester for the test of castor- Jojoba bio lubricant blends mechanical characteristic. The operating parameters are speed, load, and blends. There are three parameters for the experiment. The loading condition varies from 100 to 400N, speed varies from 400 to 700 rpm and 4 blends are prepared for the experiment, so there is 4 level of experiment. Time and temperature are held constant for the operation, which are generally controllable in all maintenance application.
From the orthogonal array table for 4 Level and 3 Variable L16 is selected for experimental design, which means total 16 experiments has to be conducted.
III. Process Parameter and their Levels Parameter
s
Code Level -1
Level-2 Level-3 Level-4
Load (N) A 100 200 300 400 Speed (RPM) B 400 500 600 700 Blends (%) C 10 15 20 25
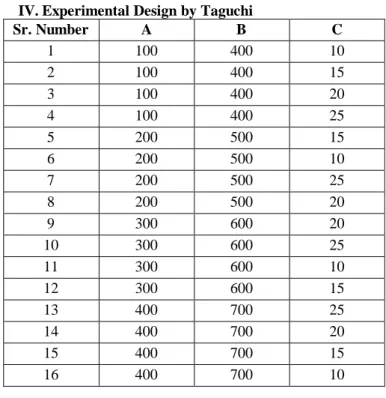
IV. Experimental Design by Taguchi
Sr. Number A B C 1 100 400 10 2 100 400 15 3 100 400 20 4 100 400 25 5 200 500 15 6 200 500 10 7 200 500 25 8 200 500 20 9 300 600 20 10 300 600 25 11 300 600 10 12 300 600 15 13 400 700 25 14 400 700 20 15 400 700 15 16 400 700 10
Parameters Designed for the Experiment V. Parameters Designed for the Experiment Experiment No. Load (N) Speed (RPM) Blends (%) 1 100 400 10 2 200 500 15 3 300 600 20 4 400 700 25 5 100 400 15 6 200 500 10 7 300 600 25 8 400 700 20 9 100 400 20 10 200 500 25 11 300 600 10 12 400 700 15 13 100 400 25 14 200 500 20 15 300 600 15 16 400 700 10
Results and Discussion
5.1 Experiment Results of mechanical Testing
1 2 3 4 5 6 7 8 9 2 L 4 L4 L 8 L 8 L 8 L 8 L 12 L 12 3 L 9 L 9 L 9 L 18 L 18 L 27 4 L 16 L 16 L 16
Experiment designed by Taguchi method is performed on four ball tester and output parameters coefficient of friction and Scar Diameter is observed and calculated.
Temperature- 40⁰ C , Time – 15 Minute
VI. Experiments Results Data Obtained from Testing Input Param eters Output Parame ters Experi ment No. Load (N) Speed (RPM) Blen d (%) Coefficie nt of friction Scar Diamet er(mm) 1 100 400 10 0.02912 0.4515 2 100 500 15 0.06511 0.584 3 100 600 20 0.01909 0.8315 4 100 700 25 0.09019 2.581 5 200 400 15 0.08756 2.2015 6 200 500 10 0.03225 0.501 7 200 600 25 0.02543 0.5315 8 200 700 20 0.03926 2.671 9 300 400 20 0.04018 0.4515 10 300 500 25 0.04224 0.501 11 300 600 10 0.04997 1.5815 12 300 700 15 0.04997 0.501 13 400 400 25 0.05203 0.5015 14 400 500 20 0.05087 0.501 15 400 600 15 0.05648 1.6715 16 400 700 10 0.11016 4.581
Analysis of Tribological Characteristic
Effect of Coefficient of friction with load and blends at various speed GRAPH 1 LOAD-COF at 400 RPM 0 0.02 0.04 0.06 0.08 0.1 100 200 300 400 C.O.F.
GRAPH-2:- LOAD – COF at 500 RPM
0 0.01 0.02 0.03 0.04 0.05 0.06 0.07 100 200 300 400 C.O.F. GRAPH-3 LOAD – COF at 600 RPM
0 0.01 0.02 0.03 0.04 0.05 0.06 100 200 300 400 C.O.F. GRAPH-4 :- LOAD-COF at 700 RPM 0 0.02 0.04 0.06 0.08 0.1 0.12 100 200 300 400 C.O.F.
Effect of Scar Diameter with load and blends at various speed
GRAPH-5 :- LOAD-SCAR DIAMETER at 400 RPM
0 0.5 1 1.5 2 2.5 100 200 300 400 Scar Diameter
GRAPH-6 :- LOAD- SCAR DIAMETER at 500 RPM 0.44 0.46 0.48 0.5 0.52 0.54 0.56 0.58 0.6 100 200 300 400 Scar Diameter
GRAPH-7 :- LOAD – SCAR DIAMETER at 600 RPM
0 0.5 1 1.5 2 100 200 300 400 Scar Diameter
GRAPH -8 :- LOAD-SCAR DIAMETER at 700 RPM
0 1 2 3 4 5 100 200 300 400 Scar Diameter
Calculation of Signal to Noise ratio for Coefficient of Friction and Scar Diameter
VII. Signal to Noise ratio for coefficient of friction. Expe rime nt No. C.O.F. Scar Diamete r (mm) S /N ratio for C.O.F. Mean valve of S/N for C.O.F. 1 0.02912 0.4515 30.71617 27.431 2 0.06511 0.584 23.72705 3 0.01909 0.8315 34.38388 4 0.09019 2.581 20.89683 5 0.08756 2.2015 21.15388 6 0.03225 0.501 29.82941 27.749 7 0.02543 0.5315 31.89307 8 0.03926 2.671 28.12099 9 0.04018 0.4515 27.9198 26.864 10 0.04224 0.501 27.48552 11 0.04997 1.5815 26.02581 12 0.04997 0.501 26.02581 13 0.05203 0.5015 25.67492 23.917 14 0.05087 0.501 25.87077 15 0.05648 1.6715 24.96211 16 0.11016 4.581 19.15952 VIII. Signal to Noise ratio for Scar Diameter.
Expe rime nt No. C.O.F. Scar Diamete r (mm) S /N ratio for C.O.F. Mean valve of S/N for C.O.F. 1 0.02912 0.4515 6.906845 1.2364 2 0.06511 0.584 4.671743 3 0.01909 0.8315 1.602755 4 0.09019 2.581 -8.23576 5 0.08756 2.2015 -6.85437 2.0261 6 0.03225 0.501 6.003245 7 0.02543 0.5315 5.489935 8 0.03926 0.671 3.46555 9 0.04018 0.4515 6.906845 3.733 10 0.04224 0.501 6.003245 11 0.04997 1.5815 -3.98138 12 0.04997 0.501 6.003245 13 0.05203 0.5015 5.994581 -1.421 14 0.05087 0.501 6.003245 15 0.05648 1.6715 -4.46213 16 0.11016 4.581 -13.2192
IX. Mean signal to Noise Ratio for Coefficient of Friction
Parameter s
Level -1 Level-2 Level-3 Level- 4 Load 27.431 27.749 26.864 23.917
Speed 27.1 27 30.14 24.17
% on 10% 15% 20% on 25% % of blend
mix
10% 15% 20% 25%
GRAPH 9 MEAN SIGNAL TO NOISE RATIO RESPONSERGRAPH FOR COEFFICIENT OF FRICTION 0 5 10 15 20 25 30 35
Level-1 Level-2 Level-3 Level-4
Load Speed Blends
X. Mean signal to Noise ratio for Scar Diameter Parameter Level
-1
Level-2 Level-3 Level-4
Load 1.2364 2.0261 3.733 -1.421 Speed 3.263 5.686 4.655 2.7875 Blend on % 1.05 on 10% .14757 on 15% 4.509 on 20% 2.45 on 25% % of blend mix 10% 15% 20% 25%
GRAPH 10. MEAN SIGNAL TO NOISE RATIO FOR SCAR DIAMETER -4 -2 0 2 4 6 8
Level-1 Level-2 Level-3 Level-4
Load Speed Blends
the final formatting of your paper is limited in scale, you need to position figures and tables at the top and bottom of each column. Large figures and tables may span both columns. Place figure captions below the figures; place table titles above the tables. If your figure has two parts, include the labels ―(a)‖ and ―(b)‖ as part of the artwork. Please verify
that the figures and tables you mention in the text actually exist.
C. Equations
Signal to Noise ratio By Taguchi Signal to Noise ratio
Taguchi uses Signal to Noise ratio to measure the quality characteristic deviating from its desired value. Signal to Noise ratio is used for variation reduction and parameter design Optimization. Signal to Noise ratio is informer of quality after making some adjustment to products function. The signal to Noise ratio is log function for optimization that helps in data analysis and to predict optimum result. Depends upon the objective of the parameter design Taguchi gave three different statics formula that are called Signal to Noise ratio. This is used to measure the variation of response with respect to Noise factor.
These three static formulas of Signal to Noise ratio for optimization the data depends upon the objective of problem that is output response.
A. Smaller is better B. Larger is better C. Normal is better
Smaller is better – If the objective is that output parameter should be minimum than the data optimization is carried out by this formula.
S/N = -10 log (1/NΣ Y2/N) (1) Larger is better – If the objective of the problem is that the output should be maximum than the data optimization is take care by this formula.
S/N = -10 log (Mean of sum of square of measured data) (2) CONCLUSION
This research explores that friction modifying tendency of refined Jojoba oil as additives to refined castor oil. It is observed that these blends of refined castor oil with refined Jojoba have very good capacity In gear application.
A. Performances of these blends with reduction in coefficient of friction point of view are 20%, 10%, 25% and 15%. B. Performance of these blends with reduction in scar or wear
of metals are 20%, 25%, 15 %, 10%.
C. Optimal mixing ratio for blend formulation is 20% and this can be used at various maintenance applications. Jojoba oil can used at additives and may replace toxic and unfriendly additives.
D. The optimal combination of the operations are
For minimum Coefficient of Friction – 200 N- 600 RPM- 20% Blend
For minimum Scar Diameter - 300 N- 500 RPM- 20% Blend
E. Higher safety on a shop floor because of higher flash point at some viscosities. Due to their higher flash and fire points these oil can be recommended as fire resistance hydraulic fluids in mining, die casting, aviation application.
F. High corrosion prevention which eliminates micro pitting and improves reliability.
G. High cleanliness at the work place. Eliminating all injuries, occupational illnesses, unsafe practices and incidents of environmental pollution. Oil mist and oil vapour reduction, leading to less dermatological problems.
H. Environmental capability of vegetable oils grants them an upper hand over the conventional mineral oils on account of overall operating costs. It is perfect harmless towards the environment due to self renewing, total free of aromatics, over 90% biodegradable, non water polluting and non toxic nature.
I. Slowly but steadily due to the concern towords the nature safety and environment regulation restrictions,
lubricants used in open application like two stroke engines, chain saws, forestry etc. That can have direct exposure to environment means soil, water bodies. In these cases lubricants can be disposed directly to the environment without any risk.
J. Vegetable oils and mainly the Non edible oils have a huge potential in formulation of lubricants boosting the agriculture practices and strengthening the rural economy.
Future Scope
The future work of current work can be extended in a way as follows-
A. To find the role of other non edible vegetable oils in pure form or blending form for bio lubricants application whose availability does not affect the economy.
B. Chemical modification of vegetable oil improves the quality of oil that makes the applicability in a wide area.
C. Development of mathematical tool and analysis for finding the optimal blinding ration for every application.
D. Search for compatibility of formulated bio lubricants in wider industrial and maintenance application. E. Continues research in these areas promises to lead to
a more detailed understanding of tribological characteristic of various non edible vegetable oils. REFERENCES
1. Gerbig Y, Ahmed SIU, Gerbig FA, Haefke H. Suitability of vegetable oils as industrial lubricants. J Synth Lubr 2004;21:177–91.
2. Asadauskas S, Perez JM, Duda JL. Oxidative stability and anti wear properties of high oleic vegetable oils.LubrEng1996;52:877–82.
3. Erhan SZ, AsadauskasS. Lubricant base stocks from vegetable oils. Ind Crops Prod 2000;11:277–82. 4. Rhee I. Evaluation of environmentally acceptable
hydraulic fluids. NLGI Spokesman 1996;60 (5):28–35.
5. Zisman WA. Historical review lubricants and lubrication, synthetic lubricants. Newyork Reinhold; 1962.
6. Avilino Jr. S. Lubricant base oil and Wax processing. New York: Marcel Dekker, Inc;1994.
7. Mortier RM, Orzulic ST, Base Oils from petroleum. London, UK : Blackie Academic and professional, an imprint of chapman & Hall; 1992.
8. Norrby T. Environmentally adopted lubricants- where are the opportunities? Stat oil
Lubricants R&D, 2003.
9. Matthew TS, Nader S, Bigyan A, Lambert AD. Influence of fatty acid composition on the tribological performance of two vegetable based lubricants. J Synth Lubr 2007;24:101-10.
10. Kumar A, Sharma S. Potential Non edible oil resources as biodiesel feed stock: an Indian perspective, Renew Sustain energy Rev 2011:15: 1791-800.
11. Battres NS. Biodegradable lubricant, what does biodegradable really mean. J Synth Lubricated 2005; 22:3-18.
12. F. Willing, B European Ecolables for biodegradable hydraulic oils, a challenges to base material producers and formulators. J Synth Lubr 2003;20:53-68.
13. Fox NJ, Stackowiak GW. Vegetable oil based lubricants- A review of oxidation. Tribol lnt 2007;40:1035-46.
14. Mongkolwongrojn M, Arunmetta P. Theoretical characteristic of hydrodynamic journal bearing lubricated with soybean based oil. J Synth Lubr 2002 (19):213.
15. Waleska C, David EW, Kraipat C, Joseph MP. The effect of chemical structure of basefluids on antiwear effectiveness of additives. Tribol lnt 2005 (38):321-6.
16. J. Van Gerpen, B. Shanks, R. Pruszko, D. Clements, G. Knothe, Biodiesel Production Technology, National Renewable Energy Laboratory /www.nrel. gov >, August2002–January2004.
17. Matthew TS , Nadar S, Bigyan A, Labmbert AD, Influence of fatty acid composition on the tribological performance of two vegetable based lubricants. J synth Lubr 2007;24:101-10.
18. Helena W, Rolf L, Theo M. Lubricant base fluids based on renewable raw materials their catalytic manufacture and modification. Appl Catal A: Gen 2001;221:429-42.
19. Titipong Issariyakul, Ajay K. Dalai Biodiesel from vegetable oils.2013:446-471.
20. Romas MJ, Fernandez CM, Casas A, Rodriguez L, Perez A. Influence of fatty acid composition of raw material on biodiesel properties Bioresour Technol 2009;100:261-8.S
21. Itoh T, Tamura T, Matsumoto T. Sterol composition of 19 vegetable oils J Am Oil Chem. Soc 1973;50:122-5.
22. Hitesh J. Yadav; Pravin P.rathod; Sorhatiya Arvinda S.; International Journal of Advanced Engineering Research and Studies, 2012, 1(3), 42-46.
23. Altin R, Cetinkaya S; Yucesu HS; J. Energy Converse Manage 2001, 42, 529-38.
24. Gubitz , G. M.; Mittelbach, M.; J. Bioresource Technology, 1999, 67, 73-82.
25. K.V. Radha ; G. Manikandan, J. Bioenergy Technology, 8, 2011.
26. Chhetri, A.B.; Pokharel, Y.R. ; Mann, H and Islam, M.R., Int. Journal of Material and Product Technology, 2007.
27. http://en.wikipe.org /wiki/soybean (accessed 10:05 am 23-06-2014).
28. Sauber FD, Kramer JKG, The problems associated with feeding of high erucic acid rapeseed oils and some fish oil to experimental analysis. Ontario academic Press Canada: 1983.
29. Pantzaric TP, Basiron Y, The lauric (coconut and palmkernel) oils, Gunstone FD, editor. Vegetable oils in food Technology Composition, properties and uses. Boca Raton, FI, USA: Blackwell Publishing, CRC Press LLC:2002.
First Author- Abhinay Dewangan, Bachelor of Mechanical Engineering
Achievement:
A. Attended the two days ENTERPRENEURSHIP AWARNESS jointly organized by E.D.C. (ENTERPRENEURSHIP DEVELOPMENT CELL) OF INSTITUTE OF TECHNOLOGY at I.T.G.G.U. Bilaspur c.g.
B. Participate in ONE DAY WORKSHIP ― LATEST
DEVELOPMENT STATUS OF RENEWABLE ENERGY SOURCE IN INDIA‖ at I.T.G.G.U. Bilaspur c.g.
C. I was BEST CADET in N.C.C senior division in 2005 and also attached the FOURTH GENEDIOUR ARMY on July 2005 at Ranchi.
D. Achieve the N.C.C. ―B‖ Certificate with ―B‖ grading.
E. Participate in SCIENCE EXHIBITION AT JONE and
DISTRICT LEVEL jointly sponsored by (NATIONAL
INSTITUTE OF TECHNOLOGY NEW DELHI and STATE INSTITUTE OF TECHNOLOGY C.G. and TRANING CENTER) 2003-2004, Bilaspur c.g.
Second Author - Narendra Kumar Patel,(Asst. Professor), Department of Mechanical Engineering,