R E S E A R C H A R T I C L E
Open Access
Adjusted color probability codes for peripapillary
retinal nerve fiber layer thickness in healthy
Koreans
Samin Hong
1, Sang-Myung Kim
1, Kyoungsoo Park
2, Jun Mo Lee
2, Chan Yun Kim
1and Gong Je Seong
1*Abstract
Background:Though a newly developed spectral domain optical coherence tomography (OCT) is at the center of interests for many ophthalmologic researchers and clinicians, its own characteristics are not fully evaluated yet. The main purpose of this study was to establish the adjusted color probability codes for peripapillary retinal nerve fiber layer (RNFL) thickness in healthy Koreans and to compare them with original color codes provided by spectral domain OCT.
Methods:Two hundred ninety-five healthy Korean eyes were enrolled and their peripapillary RNFL thickness was measured by Cirrus OCT. For each decade of age, the normal thickness reference was determined on the basis of z-scores and the adjusted color probability codes were established. Then the agreements between adjusted and original color codes were calculated using weighted Kappa (Kw) coefficient.
Results:On the basis of Kwcoefficient, the overall agreement between the adjusted and original probability color codes was not excellent (Kwrange of 0.500 to 0.806). If the adjusted probability codes were assumed as a standard of comparison, the original color codes showed the false-negative in 11% of eyes and the false-positive in 0.3% of eyes for average RNFL thickness.
Conclusions:Adjusted color probability codes judged by the Korean normative data showed a discrepancy with original codes. It implies that normal reference and adjusted probability codes for each ethnicity might be needed to determine whether a certain RNFL thickness is within normal range or not.
Keywords:Glaucoma, Optical coherence tomography, Probability code, Retinal nerve fiber layer
Background
Due to the glaucomatous optic nerve damage and visual field loss often are asymptomatic in the early stages, the identification of individuals with glaucoma at the earliest possible time is important to prevent a calamitous loss in vision [1]. In the last decade, various new advanced technologies to assess the structural loss of retinal ganglion cell (RGC) axons have been introduced [2-11], one of which is optical coherence tomography (OCT) [12]. Using low coherence interferometry, it al-lows for noninvasive in vivo high-resolution
cross-sectional tomographic retinal images and quantitative measurements of retinal nerve fiber layer (RNFL) thickness [13]. Since spectral domain OCT acquires real-time depth scans and recognizes them as a whole cube, it can provide three dimensional intraretinal im-aging data from a single scan [14-16]. Even after scan-ning a fundus, clinicians can re-analyze the data in various ways. Although this seems to be an amazing new ophthalmic imaging device, its baseline characteristics must be evaluated before coming into use. In particular, we used the Cirrus OCT (Carl Zeiss Meditec, Inc., Dublin, CA) in this study [17,18].
Even in normal subjects, there are many factors in-cluding age, refractive error, ethnicity, axial length, and optic disc size may influence to the RNFL thickness [19-28]. However, when OCTs judge whether a certain * Correspondence:[email protected]
1Institute of Vision Research, Department of Ophthalmology, Yonsei
University College of Medicine, 50 Yonsei-ro, Seodaemun-gu, Seoul 120-752, Republic of Korea
Full list of author information is available at the end of the article
© 2014 Hong et al.; licensee BioMed Central Ltd. This is an Open Access article distributed under the terms of the Creative Commons Attribution License (http://creativecommons.org/licenses/by/2.0), which permits unrestricted use, distribution, and reproduction in any medium, provided the original work is properly credited. The Creative Commons Public Domain Dedication waiver (http://creativecommons.org/publicdomain/zero/1.0/) applies to the data made available in this article, unless otherwise stated.
RNFL thickness measurement is within normal range or not, they only take into consideration the subject’s age. Normal RNFL thickness ranges according to race are not available for the Cirrus OCT. In addition, although some report that the mean RNFL thickness of Asians may be thicker than that of Caucasians [24-29], their de-tailed information stratified by age and sectors is insuffi-cient, especially for the Korean population.
In the present study, using the spectral domain Cirrus OCT, the Korean normative data of peripapillary RNFL thickness and the adjusted probability color codes were established. And the agreement between the adjusted and original probability codes was determined.
Methods Subjects
After obtaining the approval of the Institutional Review Board, 166 healthy Korean subjects (age, 20 to 65 years old) who visited the Health Promotion Center of Gangnam
Severance Hospital, Yonsei University College of Medicine, Seoul, Republic of Korea between September and October, 2008 were enrolled in this study. All study protocol ad-hered to the tenets of the Declaration of Helsinki. They underwent a comprehensive medical examination (including an ophthalmologic exam) and their clinical records were retrospectively reviewed. The subjects were excluded if they had any history of ocular trauma or intraocular surgical or laser treatment. All partici-pants with diabetes or any other systemic disease or medication affecting the visual field or RNFL were also excluded.
Ophthalmologic examination
The comprehensive ophthalmologic exam included cor-rected visual acuity (CVA), intraocular pressure (IOP), spher-ical and cylindrspher-ical refractive errors (Auto Ref-Keratometer RK-3, Canon, Inc., Tokyo, Japan), nonmydriatic fundus and optic disc photographs (Fundus Camera VX-10, Kowa
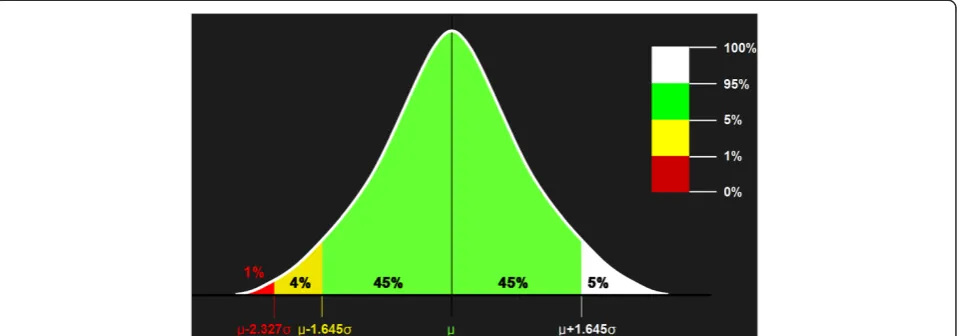
Figure 1Adjusted probability codes obtained on the basis of each z-score for a one-tailed normal probability of 5% (z = 1.645) and 1% (z = 2.327).μ= mean;σ= standard deviation.
Table 1 Subjects’characteristics stratified by decade of age
Decade p-value
3rd (20–29 yrs) 4th (30–39 yrs) 5th (40–49 yrs) 6th (50–59 yrs) 7th (60–65 yrs)
Number of eyes 27 83 90 75 20
-Age (yrs) 26.70 ± 2.93 35.31 ± 2.33 44.13 ± 2.74 54.03 ± 3.24 63.15 ± 1.66 <0.001*
Gender (M : F) 15 : 12 49 : 34 38 : 52 44 : 31 14 : 6 0.071
Laterality (RE : LE) 14 : 13 40 : 43 46 : 44 38 : 37 9 : 11 0.982
CVA (LogMAR) 0.050 ± 0.061 0.021 ± 0.056 0.041 ± 0.085 0.067 ± 0.086 0.074 ± 0.081 0.002*
IOP (mmHg) 14.78 ± 2.90 14.41 ± 3.05 14.53 ± 2.83 14.59 ± 2.70 14.50 ± 2.24 0.983
CVA = corrected visual acuity; F = female; IOP = intraocular pressure; LE = left eye; M = male; RE = right eye. Values are mean ± standard deviation.
Company, Ltd., Tokyo, Japan). According to the examination guidelines of our Health Promotion Center, CVA was de-fined as visual acuity in the habitual glass state when it was equal to or better than 20/25; when it was worse than 20/25, CVA was defined as the best-corrected visual acuity after the manifested refraction. IOP was checked with noncontact pneumotonometry (Tonometer TX-10, Canon, Inc.) first, and was re-checked with Goldmann applanation tonometry when repeated measurements were higher than 21 mmHg.
Peripapillary RNFL thickness was measured by an Optic Disc Cube 200 × 200 scan of the spectral domain Cirrus
OCT (Model 4000, Software version 3.0.0.64, Carl Zeiss Meditec Inc.) without pupil dilation. The same instrument was used by the same operator. Scans with blinks or with low signal strength (less than six) were excluded from the analysis.
Only healthy eyes with a CVA of 20/30 or better, an IOP of below 21 mmHg, a spherical refractive error within +/− 4.00 diopters and a cylinder refractive error within +/−3.00 diopters, and normal appearance of the optic nerve head, RNFL and fundus were included the study. Both eyes of each subject were included if they satisfied the entry criteria.
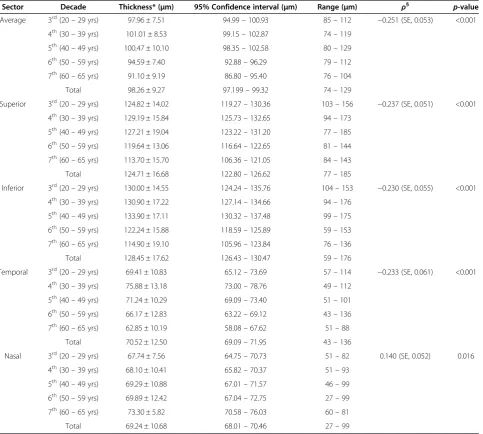
Table 2 Peripapillary retinal nerve fiber layer thickness in healthy Koreans
Sector Decade Thickness* (μm) 95% Confidence interval (μm) Range (μm) ρ§ p-value
Average 3rd(20
–29 yrs) 97.96 ± 7.51 94.99–100.93 85–112 −0.251 (SE, 0.053) <0.001
4th(30
–39 yrs) 101.01 ± 8.53 99.15–102.87 74–119
5th(40
–49 yrs) 100.47 ± 10.10 98.35–102.58 80–129
6th(50
–59 yrs) 94.59 ± 7.40 92.88–96.29 79–112
7th(60–65 yrs) 91.10 ± 9.19 86.80–95.40 76–104
Total 98.26 ± 9.27 97.199–99.32 74–129
Superior 3rd(20–29 yrs) 124.82 ± 14.02 119.27–130.36 103–156 −0.237 (SE, 0.051) <0.001
4th(30–39 yrs) 129.19 ± 15.84 125.73–132.65 94–173
5th(40–49 yrs) 127.21 ± 19.04 123.22–131.20 77–185
6th(50–59 yrs) 119.64 ± 13.06 116.64–122.65 81–144
7th(60–65 yrs) 113.70 ± 15.70 106.36–121.05 84–143
Total 124.71 ± 16.68 122.80–126.62 77–185
Inferior 3rd(20–29 yrs) 130.00 ± 14.55 124.24–135.76 104–153 −0.230 (SE, 0.055) <0.001
4th(30
–39 yrs) 130.90 ± 17.22 127.14–134.66 94–176
5th(40
–49 yrs) 133.90 ± 17.11 130.32–137.48 99–175
6th(50
–59 yrs) 122.24 ± 15.88 118.59–125.89 59–153
7th(60
–65 yrs) 114.90 ± 19.10 105.96–123.84 76–136
Total 128.45 ± 17.62 126.43–130.47 59–176
Temporal 3rd(20
–29 yrs) 69.41 ± 10.83 65.12–73.69 57–114 −0.233 (SE, 0.061) <0.001
4th(30
–39 yrs) 75.88 ± 13.18 73.00–78.76 49–112
5th(40
–49 yrs) 71.24 ± 10.29 69.09–73.40 51–101
6th(50
–59 yrs) 66.17 ± 12.83 63.22–69.12 43–136
7th(60–65 yrs) 62.85 ± 10.19 58.08–67.62 51–88
Total 70.52 ± 12.50 69.09–71.95 43–136
Nasal 3rd(20–29 yrs) 67.74 ± 7.56 64.75–70.73 51–82 0.140 (SE, 0.052) 0.016
4th(30–39 yrs) 68.10 ± 10.41 65.82–70.37 51–93
5th(40–49 yrs) 69.29 ± 10.88 67.01–71.57 46–99
6th(50–59 yrs) 69.89 ± 12.42 67.04–72.75 27–99
7th(60–65 yrs) 73.30 ± 5.82 70.58–76.03 60–81
Total 69.24 ± 10.68 68.01–70.46 27–99
*Values are mean ± standard deviation.
§
Pearson’s correlation coefficient between age and retinal nerve fiber layer thickness. SE = standard error.
Honget al. BMC Ophthalmology2014,14:38 Page 3 of 10
Figure 2Peripapillary retinal nerve fiber layer thickness according to age in healthy Koreans.Asterisks indicate statistically significant differences (p < 0.050).
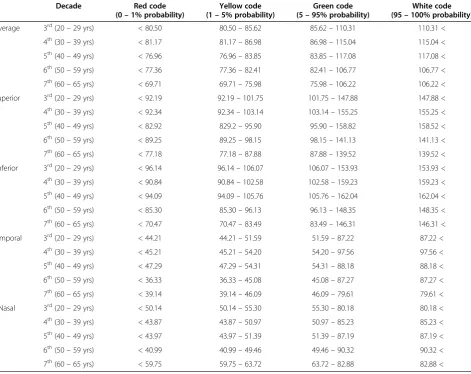
Table 3 Reference ranges of retinal nerve fiber layer thickness for adjusted probability codes for Korean population
Decade Red code
(0–1% probability)
Yellow code (1–5% probability)
Green code (5–95% probability)
White code (95–100% probability)
Average 3rd(20–29 yrs) < 80.50 80.50–85.62 85.62–110.31 110.31 <
4th(30–39 yrs) < 81.17 81.17–86.98 86.98–115.04 115.04 <
5th(40–49 yrs) < 76.96 76.96–83.85 83.85–117.08 117.08 <
6th(50–59 yrs) < 77.36 77.36–82.41 82.41–106.77 106.77 <
7th(60–65 yrs) < 69.71 69.71–75.98 75.98–106.22 106.22 <
Superior 3rd(20–29 yrs) < 92.19 92.19–101.75 101.75–147.88 147.88 <
4th(30–39 yrs) < 92.34 92.34–103.14 103.14–155.25 155.25 <
5th(40–49 yrs) < 82.92 829.2–95.90 95.90–158.82 158.52 <
6th(50–59 yrs) < 89.25 89.25–98.15 98.15–141.13 141.13 <
7th(60–65 yrs) < 77.18 77.18–87.88 87.88–139.52 139.52 <
Inferior 3rd(20–29 yrs) < 96.14 96.14–106.07 106.07–153.93 153.93 <
4th(30–39 yrs) < 90.84 90.84–102.58 102.58–159.23 159.23 <
5th(40–49 yrs) < 94.09 94.09–105.76 105.76–162.04 162.04 <
6th(50–59 yrs) < 85.30 85.30–96.13 96.13–148.35 148.35 <
7th(60–65 yrs) < 70.47 70.47–83.49 83.49–146.31 146.31 <
Temporal 3rd(20–29 yrs) < 44.21 44.21–51.59 51.59–87.22 87.22 <
4th(30–39 yrs) < 45.21 45.21–54.20 54.20–97.56 97.56 <
5th(40–49 yrs) < 47.29 47.29–54.31 54.31–88.18 88.18 <
6th(50–59 yrs) < 36.33 36.33–45.08 45.08–87.27 87.27 <
7th(60–65 yrs) < 39.14 39.14–46.09 46.09–79.61 79.61 <
Nasal 3rd(20–29 yrs) < 50.14 50.14–55.30 55.30–80.18 80.18 <
4th(30–39 yrs) < 43.87 43.87–50.97 50.97–85.23 85.23 <
5th(40–49 yrs) < 43.97 43.97–51.39 51.39–87.19 87.19 <
6th(50–59 yrs) < 40.99 40.99–49.46 49.46–90.32 90.32 <
7th(60–65 yrs) < 59.75 59.75–63.72 63.72–82.88 82.88 <
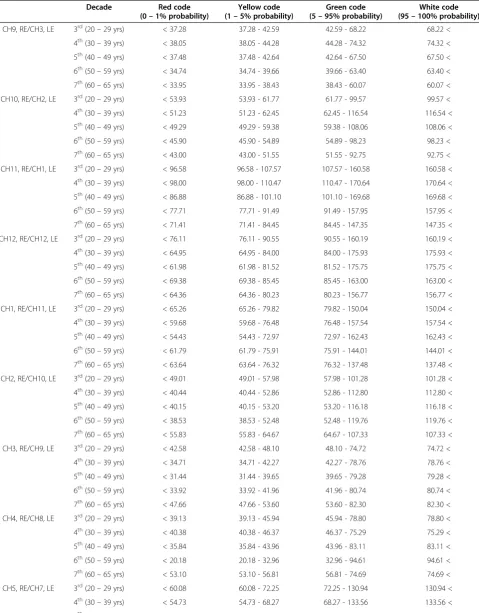
Table 4 Reference ranges of clock-hour retinal nerve fiber layer thickness for adjusted probability codes for Korean population
Decade Red code
(0–1% probability)
Yellow code (1–5% probability)
Green code (5–95% probability)
White code (95–100% probability)
CH9, RE/CH3, LE 3rd(20–29 yrs) < 37.28 37.28 - 42.59 42.59 - 68.22 68.22 <
4th(30–39 yrs) < 38.05 38.05 - 44.28 44.28 - 74.32 74.32 <
5th(40–49 yrs) < 37.48 37.48 - 42.64 42.64 - 67.50 67.50 <
6th(50–59 yrs) < 34.74 34.74 - 39.66 39.66 - 63.40 63.40 <
7th(60–65 yrs) < 33.95 33.95 - 38.43 38.43 - 60.07 60.07 <
CH10, RE/CH2, LE 3rd(20–29 yrs) < 53.93 53.93 - 61.77 61.77 - 99.57 99.57 <
4th(30–39 yrs) < 51.23 51.23 - 62.45 62.45 - 116.54 116.54 <
5th(40–49 yrs) < 49.29 49.29 - 59.38 59.38 - 108.06 108.06 <
6th(50–59 yrs) < 45.90 45.90 - 54.89 54.89 - 98.23 98.23 <
7th(60–65 yrs) < 43.00 43.00 - 51.55 51.55 - 92.75 92.75 <
CH11, RE/CH1, LE 3rd(20–29 yrs) < 96.58 96.58 - 107.57 107.57 - 160.58 160.58 <
4th(30–39 yrs) < 98.00 98.00 - 110.47 110.47 - 170.64 170.64 <
5th(40–49 yrs) < 86.88 86.88 - 101.10 101.10 - 169.68 169.68 <
6th(50–59 yrs) < 77.71 77.71 - 91.49 91.49 - 157.95 157.95 <
7th(60–65 yrs) < 71.41 71.41 - 84.45 84.45 - 147.35 147.35 <
CH12, RE/CH12, LE 3rd(20–29 yrs) < 76.11 76.11 - 90.55 90.55 - 160.19 160.19 <
4th(30–39 yrs) < 64.95 64.95 - 84.00 84.00 - 175.93 175.93 <
5th(40–49 yrs) < 61.98 61.98 - 81.52 81.52 - 175.75 175.75 <
6th(50–59 yrs) < 69.38 69.38 - 85.45 85.45 - 163.00 163.00 <
7th(60–65 yrs) < 64.36 64.36 - 80.23 80.23 - 156.77 156.77 <
CH1, RE/CH11, LE 3rd(20–29 yrs) < 65.26 65.26 - 79.82 79.82 - 150.04 150.04 <
4th(30–39 yrs) < 59.68 59.68 - 76.48 76.48 - 157.54 157.54 <
5th(40–49 yrs) < 54.43 54.43 - 72.97 72.97 - 162.43 162.43 <
6th(50–59 yrs) < 61.79 61.79 - 75.91 75.91 - 144.01 144.01 <
7th(60–65 yrs) < 63.64 63.64 - 76.32 76.32 - 137.48 137.48 <
CH2, RE/CH10, LE 3rd(20–29 yrs) < 49.01 49.01 - 57.98 57.98 - 101.28 101.28 <
4th(30–39 yrs) < 40.44 40.44 - 52.86 52.86 - 112.80 112.80 <
5th(40–49 yrs) < 40.15 40.15 - 53.20 53.20 - 116.18 116.18 <
6th(50–59 yrs) < 38.53 38.53 - 52.48 52.48 - 119.76 119.76 <
7th(60–65 yrs) < 55.83 55.83 - 64.67 64.67 - 107.33 107.33 <
CH3, RE/CH9, LE 3rd(20–29 yrs) < 42.58 42.58 - 48.10 48.10 - 74.72 74.72 <
4th(30–39 yrs) < 34.71 34.71 - 42.27 42.27 - 78.76 78.76 <
5th(40–49 yrs) < 31.44 31.44 - 39.65 39.65 - 79.28 79.28 <
6th(50–59 yrs) < 33.92 33.92 - 41.96 41.96 - 80.74 80.74 <
7th(60–65 yrs) < 47.66 47.66 - 53.60 53.60 - 82.30 82.30 <
CH4, RE/CH8, LE 3rd(20–29 yrs) < 39.13 39.13 - 45.94 45.94 - 78.80 78.80 <
4th(30–39 yrs) < 40.38 40.38 - 46.37 46.37 - 75.29 75.29 <
5th(40–49 yrs) < 35.84 35.84 - 43.96 43.96 - 83.11 83.11 <
6th(50–59 yrs) < 20.18 20.18 - 32.96 32.96 - 94.61 94.61 <
7th(60–65 yrs) < 53.10 53.10 - 56.81 56.81 - 74.69 74.69 <
CH5, RE/CH7, LE 3rd(20–29 yrs) < 60.08 60.08 - 72.25 72.25 - 130.94 130.94 <
4th(30–39 yrs) < 54.73 54.73 - 68.27 68.27 - 133.56 133.56 <
5th(40–49 yrs) < 60.65 60.65 - 73.75 73.75 - 136.94 136.94 <
Honget al. BMC Ophthalmology2014,14:38 Page 5 of 10
Statistical analysis
To establish the Korean normative dataset of peripa-pillary RNFL thickness for each decade of age, the mean and standard deviation of RNFL thickness were calculated for each scanned sector. After confirming the Korean normal distribution of RNFL thickness, the adjusted probability codes for Koreans were defined
on the basis of z-score for a one-tailed normal prob-ability of 5% (z = 1.645) and 1% (z = 2.327) (Figure 1). These adjusted probability codes for Koreans were compared with the original color probability codes, which were provided by built in analysis of Cirrus OCT, using the weighted Kappa (Kw) coefficient using
quadratic weights.
Table 4 Reference ranges of clock-hour retinal nerve fiber layer thickness for adjusted probability codes for Korean population(Continued)
6th(50–59 yrs) < 61.50 61.50 - 71.95 71.95 - 122.34 122.34 <
7th(60–65 yrs) < 59.86 59.86 - 68.94 68.94 - 112.76 112.76 <
CH6, RE/CH6, LE 3rd(20–29 yrs) < 83.80 83.80 - 99.93 99.93 - 177.77 177.77 <
4th(30–39 yrs) < 66.30 66.30 - 87.77 87.77 - 191.32 191.32 <
5th(40–49 yrs) < 84.45 84.45 - 101.92 101.92 - 186.19 186.19 <
6th(50–59 yrs) < 83.95 83.95 - 99.02 99.02 - 171.70 171.70 <
7th(60–65 yrs) < 58.66 58.66 - 77.75 77.75 - 169.85 169.85 <
CH7, RE/CH5, LE 3rd(20–29 yrs) < 109.26 109.26 - 121.04 121.04 - 177.85 177.85 <
4th(30–39 yrs) < 103.28 103.28 - 117.61 117.61 - 186.75 186.75 <
5th(40–49 yrs) < 99.86 99.86 - 115.18 115.18 - 189.13 189.13 <
6th(50–59 yrs) < 82.63 82.63 - 98.73 98.73 - 176.42 176.42 <
7th(60–65 yrs) < 60.09 60.09 - 80.62 80.62 - 179.68 179.68 <
CH8, RE/CH4, LE 3rd(20–29 yrs) < 30.05 30.05 - 42.32 42.32 - 101.53 101.53 <
4th(30–39 yrs) < 30.64 60.64 - 44.80 44.80 - 113.12 113.12 <
5th(40–49 yrs) < 41.93 41.93 - 51.64 51.64 - 98.51 98.51 <
6th(50–59 yrs) < 33.42 33.42 - 43.25 43.25 - 90.69 90.69 <
7th(60–65 yrs) < 31.26 31.26 - 41.73 41.73 - 92.27 92.27 <
CH = clock-hour. Unit,μm.
Calculation of the Kwcoefficients was performed using the
MedCalc program for Windows, version 9.6.4.0 (MedCalc Software, Mariakerke, Belgium), and all other statistical ana-lyses were performed using SPSS for Windows, version 12.0.1 (SPSS Inc., Chicago, IL).
Results
Two hundred ninety-five eyes of 166 healthy Korean subjects were analyzed, and their characteristics are shown in Table 1. The average age was 43.86 ± 10.33 years old (range 20 to 65). Thirty-seven eyes were excluded due to blinks during image scanning (7 eyes), low signal strength of the OCT image (3 eyes), poor CVA (14 eyes), and abnormal appearance of the optic nerve head or fundus (13 eyes). Although the CVA was worse in the 3rd decade group than the 4th decade group, all other characteristics except age and CVA were similar ac-cording to group.
The mean RNFL thicknesses for each scanned sector and decade of age are shown in Table 2 and Figure 2. Overall, average RNFL thickness progressively decreased with age (Pearson’s correlation coefficient ρ, −0.251; p < 0.001). Su-perior, inferior, and temporal RNFL thickness also decreased with age (ρrange of−0.237 to−0.230; all p < 0.001), while nasal RNFL thickness did not (ρ, 0.140; p = 0.016).
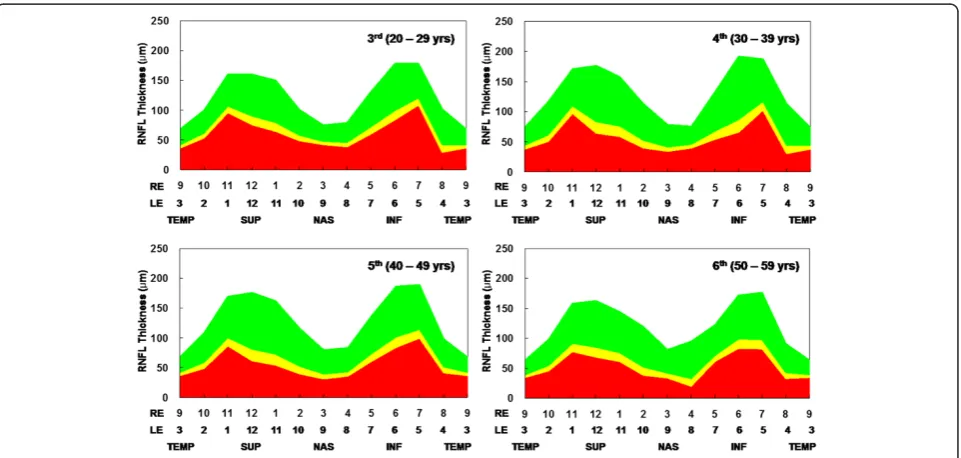
Reference ranges of adjusted probability color codes for Koreans established on the basis of z-scores were generated. Values for the average and quadrants are shown in Table 3; values for the clock-hour scanned sec-tors are provided in Table 4 and Figure 3.
The overall agreement between the adjusted and ori-ginal probability color codes was not excellent [30,31]. The Kw coefficients for average, superior, inferior,
tem-poral, nasal RNFL thickness were 0.500 (SE, 0.055), 0.729 (SE, 0.056), 0.642 (SE, 0.055), 0.803 (SE 0.057), and 0.806 (SE, 0.058), respectively.
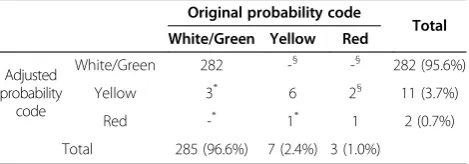
When the adjusted probability codes were assumed as a standard of comparison, 11 eyes (3.7%) were false negative but no eye was false positive for average RNFL thickness (Table 5). The superior (Table 6), inferior (Table 7), and temporal (Table 8) quadrants showed similar tendencies of greater false negative rate than false positive rate. On the contrary, for the nasal quadrant, the false positive rate (7 cases, 2.4%) was greater than the false negative (1 case, 0.3%) (Table 9). Overall, if the adjusted probability color codes for Koreans were used as a standard of comparison, about 11% of eyes for aver-age RNFL thickness measurement and about 7% of eyes for quadrant RNFL thickness measurement were judged differently from the original color codes. When the white and green codes were categorized as normal RNFL thickness, about 4% of eyes for average RNFL thickness measurement and about 2% of eyes for quadrant RNFL thickness measurement were judged as false negative.
Discussion
In this study, Korean normative data of peripapillary RNFL thickness as measured by spectral domain Cirrus OCT were established, and the reference ranges of RNFL thickness for adjusted color probability codes for the Korean population were generated. Our healthy eyes were selected by normal appearance of the optic nerve head and retinal nerve fiber rather without perimetric test. At present, diagnosis of glaucoma generally requires evidence of typical glaucomatous optic nerve atrophy in the absence of other potential causes. Due to these in-clude functional disturbance traditionally identified by visual field abnormalities and anatomical evidence of damage in optic nerve head and peripapillary retinal nerve fiber, it has been better to perform a standard au-tomated perimetric test. However, many glaucoma re-searchers have suggested that defects in the appearance of the retinal nerve fiber may represent early, clinically detectable manifestations of glaucomatous damage [30-39]. They also widely agreed the careful assessment of optic nerve head and retinal nerve fiber might identify patients with glaucomatous neuropathy before development of re-producible field defects. Assessment of optic nerve head and retinal nerve fiber is valuable as an early indicator of glaucomatous optic neuropathy.
The average and three quadrants (all except the nasal quadrant) showed RNFL thickness that gradually thinned Table 5 Agreement between adjusted and original probability codes for average retinal nerve fiber layer thickness
Original probability code
Total White/Green Yellow Red
Adjusted probability
code
White/Green 284 -§ -§ 284 (96.3%)
Yellow 10* - -§ 10 (3.4%)
Red -* 1* - 1 (0.3%)
Total 294 (99.7%) 1 (0.3%) 0 (0.0%)
*
False negative.§
False positive. Values are number of eyes (%).
Table 6 Agreement between adjusted and original probability codes for superior retinal nerve fiber layer thickness
Original probability code
Total White/Green Yellow Red
Adjusted probability
code
White/Green 282 -§ -§ 282 (95.6%)
Yellow 3* 6 2§ 11 (3.7%)
Red -* 1* 1 2 (0.7%)
Total 285 (96.6%) 7 (2.4%) 3 (1.0%)
*False negative.§
False positive. Values are number of eyes (%).
Honget al. BMC Ophthalmology2014,14:38 Page 7 of 10
with age. Regarding the agreements between the adjusted and original color probability codes, the overall agreements were not excellent. For average RNFL thickness, the value of the Kw coefficient was just 0.500, which only indicates
moderate agreement. Even for the superior and inferior RNFL thicknesses, the Kw coefficients were 0.729 and
0.642, respectively. Theoretically, since probability codes are based on a one-tailed normal probability of the entire population, probability codes adjusted for each ethnicity might be more useful than the original color codes judged by an internal database from mixed populations. In healthy Koreans, more than 10% of measurements were judged dif-ferently with the adjusted probability codes, and most were judged more seriously compared to the original codes.
Since the company (Carl Zeiss Meditec, Inc.) has not disclosed detailed information about the current internal database of Cirrus OCT, we can only know the proportion of each ethnic group and age category (Table 10). Regard-ing ethnicity, the Cirrus OCT only includes the data of 122 Caucasian, 35 Hispanic, 51 African American, 63 Chinese, 3 Korean, 3 Indian, 1 Japanese, and 6 other subjects.Even though the current built-in internal database in the Cirrus OCT includes more Asians than the time domain Stratus OCT (Carl Zeiss Meditec, Inc.) [23], normal RNFL thick-ness ranges according to race are not available for the Cir-rus OCT. Additionally, for the CirCir-rus OCT, the normative RNFL thickness data stratified by age are not available for
any ethnicity. Furthermore, except for Caucasians, only a small number of subjects are included for each ethnicity, and their age distribution is not uniform.
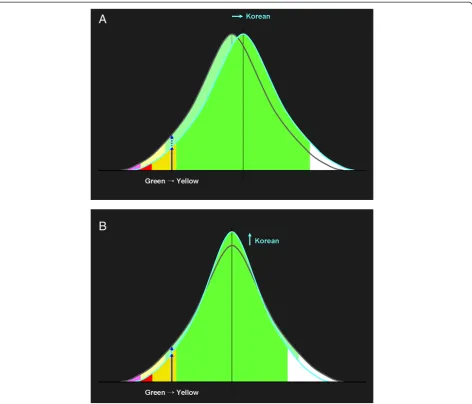
Next, we consider reasons for the discrepancy be-tween the adjusted and original color probability codes. Since the probability codes are based on z-scores, they are determined by the mean and standard deviation of RNFL thicknesses. Although exact information on the current internal database is not available, if the mean of Koreans is greater than the internal database, some probability codes should be adjusted (Figure 4A). How-ever, even if the mean is not different, the standard deviation might be, in which case the probability codes should also be adjusted (Figure 4B). Generally, it might be better to use probability codes adjusted for each ethnicity rather than the original codes. The adjusted probability codes might be a great help not only to glaucoma specialists but also to general ophthalmolo-gists when they face borderline cases. Furthermore, our data will be useful for comparing racial differences in normal RNFL thickness.
Table 9 Agreement between adjusted and original probability codes for nasal retinal nerve fiber layer thickness
Original probability code
Total White/Green Yellow Red
Adjusted probability
code
White/Green 277 7§ -§ 284 (96.3%)
Yellow 1* 8 -§ 9 (3.1%)
Red -* -* 2 2 (0.7%)
Total 278 (94.2%) 15 (5.1%) 2 (0.7%)
*FN 1 (0.3%)
§FP 7 (2.4%)
*
False negative.§
False positive. Values are number of eyes (%).
Table 10 Information about internal normartive data of spectral domain Cirrus OCT
Ethnic group Number of subjects (%)
Age category Number of subjects (%)
Caucasian 122 (43.0%) 18–29 yrs 60 (21.1%)
Hispanic 35 (12.3%) 30–39 yrs 53 (18.7%)
African American 51 (18.0%) 40–49 yrs 45 (15.8%)
Chinese 63 (22.2%) 50–59 yrs 53 (18.7%)
Korean 3 (1.1%) 60–69 yrs 42 (14.8%)
Indian 3 (1.1%) > 70 yrs 31 (10.9%)
Japanese 1 (0.4%)
Other 6 (2.1%)
Total 284 (100.0%) Total 284 (100.0%)
From Carl Zeiss Meditec, Inc., Dublin, CA. Table 7 Agreement between adjusted and original
probability codes for inferior retinal nerve fiber layer thickness
Original probability code
Total White/Green Yellow Red
Adjusted probability
code
White/Green 282 -§ -§ 282 (95.6%)
Yellow 4* 4 4§ 12 (4.1%)
Red 1* -* - 1 (0.3%)
Total 287 (97.3%) 4 (1.4%) 4 (1.4%)
*
False negative.§
False positive. Values are number of eyes (%).
Table 8 Agreement between adjusted and original probability codes for temporal retinal nerve fiber layer thickness
Original probability code
Total White/Green Yellow Red
Adjusted probability
code
White/Green 285 -§ -§ 285 (96.6%)
Yellow 7* 2 -§ 9 (3.1%)
Red -* 1* - 1 (0.3%)
Total 292 (99.0%) 3 (1.0%) 0 (0.0%)
*
False negative.§
Conclusion
The adjusted color probability codes for Koreans showed a discrepancy with the original color codes. Due to the normal reference ranges of peripapillary RNFL thicknesses and probability codes can differ ac-cording to race, the normative data might be needed for every ethnicity. When clinicians judge whether a certain RNFL thickness measurement is within normal limits or not, they need to take the race of the patient into consideration.
Abbreviations
CVA:Corrected visual acuity; IOP: Intraocular pressure; Kw: Weighted Kappa; OCT: Optical coherence tomography; RGC: Retinal ganglion cell; RNFL: Retinal nerve fiber layer.
Competing interest
None of authors has a financial competing interest.
Authors’contributions
SH and GJS designed the study; SH collected data and wrote the bulk of the manuscript; SMK, KP, and JML contributed to the data analysis; CYK and GJS revised the manuscript; GS has given final approval of the version to be published. All authors read and approved the final manuscript.
Acknowledgements
This work was supported by the Basic Science Research Program through the National Research Foundation of Korea (NRF) funded by the Ministry of Education, Science, and Technology (No. 2009-0077076 and 2011-0013288), and a grant from the Korea Health Technology R&D Project, Ministry of Health and Welfare (No. A101727).
Author details
1
Institute of Vision Research, Department of Ophthalmology, Yonsei University College of Medicine, 50 Yonsei-ro, Seodaemun-gu, Seoul 120-752, Republic of Korea.2Siloam Eye Hospital, Seoul, Republic of Korea.
Received: 10 December 2013 Accepted: 26 March 2014 Published: 29 March 2014
Figure 4Theoretical causes of the discrepancy between adjusted and original probability codes: the means (A) or standard deviations (B) might be different.
Honget al. BMC Ophthalmology2014,14:38 Page 9 of 10
References
1. Tuulonen A, Airaksinen PJ, Erola E, Forsman E, Friberg K, Kaila M, Klemetti A, Mäkelä M, Oskala P, Puska P, Suoranta L, Teir H, Uusitalo H, Vainio-Jylhä E, Vuori ML:The Finnish evidence-based guideline for open-angle glaucoma.
Acta Ophthalmol Scand2003,81:3–18.
2. Weinreb RN, Zangwill L, Berry CC, Bathija R, Sample PA:Detection of glaucoma with scanning laser polarimetry.Arch Ophthalmol1998,
116:1583–1589.
3. Zangwill LM, Williams J, Berry CC, Knauer S, Weinreb RN:A comparison of optical coherence tomography and retinal nerve fiber layer photography for detection of nerve fiber layer damage in glaucoma.Ophthalmology
2000,107:1309–1315.
4. Bagga H, Greenfield DS, Feuer W, Knighton RW:Scanning laser polarimetry with variable corneal compensation and optical coherence tomography in normal and glaucomatous eyes.Am J Ophthalmol2003,135:521–529. 5. Reus NJ, Colen TP, Lemij HG:Visualization of localized retinal nerve fiber
layer defects with the GDx with individualized and with fixed compensation of anterior segment birefringence.Ophthalmology2003,
110:1512–1516.
6. Hoffmann EM, Bowd C, Klein N, Stemberger K, Grus FH, Pfeiffer N:
Glaucoma detection using the GDx nerve fiber analyzer and the retinal thickness analyzer (RTA).Eur J Ophthalmol2006,16:251–258.
7. Hong S, Ahn H, Ha SJ, Yeom HY, Seong GJ, Hong YJ:Early glaucoma detection using the Humphrey Matrix Perimeter, GDx VCC, Stratus OCT, and retinal nerve fiber layer photography.Ophthalmology2007,114:210–215. 8. Burgansky-Eliash Z, Wollstein G, Bilonick RA, Ishikawa H, Kagemann L,
Schuman JS:Glaucoma detection with the Heidelberg retina tomograph 3.Ophthalmology2007,114:466–471.
9. Sehi M, Ume S, Greenfield DS:Scanning laser polarimetry with enhanced corneal compensation and optical coherence tomography in normal and glaucomatous eyes.Invest Ophthalmol Vis Sci2007,48:2099–2104. 10. Bowd C, Tavares IM, Medeiros FA, Zangwill LM, Sample PA, Weinreb RN:
Retinal nerve fiber layer thickness and visual sensitivity using scanning laser polarimetry with variable and enhanced corneal compensation.
Ophthalmology2007,114:1259–1265.
11. Ma KT, Lee SH, Hong S, Park KS, Kim CY, Seong GJ, Hong YJ:Relationship between the retinal thickness analyzer and the GDx VCC scanning laser polarimeter, Stratus OCT optical coherence tomograph, and Heidelberg retina tomograph II confocal scanning laser ophthalmoscopy.Korean J Ophthalmol2008,22:10–17.
12. Huang D, Swanson EA, Lin CP, Schuman JS, Stinson WG, Chang W, Hee MR, Flotte T, Gregory K, Puliafito CA:Optical coherence tomography.Science
1991,254:1178–1181.
13. Hee MR, Izatt JA, Swanson EA, Huang D, Schuman JS, Lin CP, Puliafito CA, Fujimoto JG:Optical coherence tomography of the human retina.Arch Ophthalmol1995,113:325–332.
14. Nassif N, Cense B, Park BH, Yun SH, Chen TC, Bouma BE, Tearney GJ, de Boer JF:In vivo human retinal imaging by ultrahigh-speed spectral domain optical coherence tomography.Opt Lett2004,29:480–482.
15. Wojtkowski M, Bajraszewski T, Gorczyńska I, Targowski P, Kowalczyk A, Wasilewski W, Radzewicz C:Ophthalmic imaging by spectral optical coherence tomography.Am J Ophthalmol2004,138:412–419. 16. Chen TC, Cense B, Pierce MC, Nassif N, Park BH, Yun SH, White BR, Bouma
BE, Tearney GJ, de Boer JF:Spectral domain optical coherence
tomography: ultra-high speed, ultra-high resolution ophthalmic imaging.
Arch Ophthalmol2005,123:1715–1720.
17. Legarreta JE, Gregori G, Punjabi OS, Knighton RW, Lalwani GA, Puliafito CA:
Macular thickness measurements in normal eyes using spectral domain optical coherence tomography.Ophthalmic Surg Lasers Imaging2008,39:S43–S49. 18. Kiernan DF, Hariprasad SM, Chin EK, Kiernan CL, Rago J, Mieler WF:Prospective
comparison of cirrus and stratus optical coherence tomography for quantifying retinal thickness.Am J Ophthalmol2009,147:267–275. 19. Varma R, Bazzaz S, Lai M:Optical tomography-measured retinal nerve fiber
layer thickness in normal latinos.Invest Ophthalmol Vis Sci2003,44:3369–3373. 20. Sony P, Sihota R, Tewari HK, Venkatesh P, Singh R:Quantification of the
retinal nerve fibre layer thickness in normal Indian eyes with optical coherence tomography.Indian J Ophthalmol2004,52:303–309. 21. Racette L, Boden C, Kleinhandler SL, Girkin CA, Liebmann JM, Zangwill LM,
Medeiros FA, Bowd C, Weinreb RN, Wilson MR, Sample PA:Differences in visual function and optic nerve structure between healthy eyes of blacks and whites.Arch Ophthalmol2005,123:1547–1553.
22. Savini G, Zanini M, Carelli V, Sadun AA, Ross-Cisneros FN, Barboni P:
Correlation between retinal nerve fibre layer thickness and optic nerve head size: an optical coherence tomography study.Br J Ophthalmol2005,89:489–492.
23. Ramakrishnan R, Mittal S, Ambatkar S, Kader MA:Retinal nerve fibre layer thickness measurements in normal Indian population by optical coherence tomography.Indian J Ophthalmol2006,54:11–15.
24. Budenz DL, Anderson DR, Varma R, Schuman J, Cantor L, Savell J, Greenfield DS, Patella VM, Quigley HA, Tielsch J:Determinants of normal retinal nerve fiber layer thickness measured by Stratus OCT.Ophthalmology2007,114:1046–1052. 25. Parikh RS, Parikh SR, Sekhar GC, Prabakaran S, Babu JG, Thomas R:Normal
age-related decay of retinal nerve fiber layer thickness.Ophthalmology
2007,114:921–926.
26. Harwerth RS, Wheat JL, Rangaswamy NV:Age-related losses of retinal ganglion cells and axons.Invest Ophthalmol Vis Sci2008,49:4437–4443. 27. Nagai-Kusuhara A, Nakamura M, Fujioka M, Fujioka M, Tatsumi Y, Negi A:
Association of retinal nerve fibre layer thickness measured by confocal scanning laser ophthalmoscopy and optical coherence tomography with disc size and axial length.Br J Ophthalmol2008,92:186–190.
28. Peng PH, Lin HS:Retinal nerve fiber layer thickness measured by optical coherence tomography in non-glaucomatous Taiwanese.J Formos Med Assoc2008,107:627–634.
29. Samarawickrama C, Wang JJ, Huynh SC, Pai A, Burlutsky G, Rose KA, Mitchell P:
Ethnic differences in optic nerve head and retinal nerve fibre layer thickness parameters in children.Br J Ophthalmol2010,94:871–876. 30. Landis JR, Koch GG:The measurement of observer agreement for
categorical data.Biometrics1977,33:159–174.
31. Altman DG:Practical statistics for medical research.London: Chapman and Hall; 1991:404.
32. Hoyt WF, Newman NM:The earliest observable defect in glaucoma?
Lancet1972,1:692–693.
33. Hoyt WF, Frisen L, Newman NM:Funduscopy of nerve fiber layer defects in glaucoma.Invest Ophthalmol Vis Sci1973,12:814–829.
34. Sommer A, Miller NR, Pollack I, Maumenee AE, George T:The nerve fiber layer in the diagnosis of glaucoma.Arch Ophthalmol1977,95:2149–2156. 35. Iwata K, Naba K, Abe H:Typical slit-like retinal nerve fiber layer defect
and corresponding scotoma.Acta Soc Ophthalmol Jpn1981,85:1791–1803. 36. Airaksinen PJ, Drance SM, Douglas GR, Mawson DK, Nieminen H:Diffuse and
localized nerve fiber loss in glaucoma.Am J Ophthalmol1984,98:566–571. 37. Sommer A, Quigley HA, Robin AL, Miller NR, Katz J, Arkell S:Evaluation of
nerve fiber layer assessment.Arch Ophthalmol1984,102:1766–1771. 38. Airaksinen PJ, Drance SM, Douglas GR, Schulzer M, Wijsman K:Visual field
and retinal nerve fiber layer comparisons in glaucoma.Arch Ophthalmol
1985,103:205–207.
39. Sommer A, Katz J, Quigley HA, Miller NR, Robin AL, Richter RC, Witt KA:
Clinically detectable nerve fiber atrophy precedes the onset of glaucomatous field loss.Arch Ophthalmol1991,109:77–83.
doi:10.1186/1471-2415-14-38
Cite this article as:Honget al.:Adjusted color probability codes for peripapillary retinal nerve fiber layer thickness in healthy Koreans.BMC Ophthalmology201414:38.
Submit your next manuscript to BioMed Central and take full advantage of:
• Convenient online submission
• Thorough peer review
• No space constraints or color figure charges
• Immediate publication on acceptance
• Inclusion in PubMed, CAS, Scopus and Google Scholar
• Research which is freely available for redistribution