Published online May 30, 2014 (http://www.sciencepublishinggroup.com/j/sjph) doi: 10.11648/j.sjph.20140203.24
Factorial invariance of bias scale, Trait version, in
engineering and social sciences Mexican university
students
Gabriel Gastélum Cuadras
1, Alejandro Chávez Guerrero
1,
Judith Margarita Rodríguez-Villalobos
1, *, Jeanette López Walle
2, Isabel Castillo Fernández
31
Faculty of Physical Culture Sciences, Autonomous University of Chihuahua, México
2
Faculty of Sport Organization, Autonomous University of Nuevo León, México
3
Faculty of Psychology, University of Valencia, Spain
Email address:
[email protected] (J. M. Rodríguez-Villalobos)
To cite this article:
Gabriel Gastélum Cuadras, Alejandro Chávez Guerrero, Judith Margarita Rodríguez-Villalobos, Jeanette López Walle, Isabel Castillo Fernández. Factorial Invariance of Bias Scale, Trait Version, in Engineering and Social Sciences Mexican University Students. Science Journal of Public Health. Vol. 2, No. 3, 2014, pp. 223-228. doi: 10.11648/j.sjph.20140203.24
Abstract:
This present study analyses the psychometric properties of BIAS (Body Image Anxiety Scale) testing, trait version, in engineering and social sciences students. A total sample of 918 participants; 460 from engineering and 458 from social sciences, with an average age of 18.27 years (DE = 0.70) and 18.13 years (DE = 0.74) respectively. Exploratory and confirmatory factorial analysis showed that a bi-factorial structure is feasible and convenient for both populations (engineering and social sciences) according to the established psychometric requirements because the students are the ones who provided the information. Furthermore the factorial structure, factorial loads and the intercepts are considered invariant in the engineering and social sciences areas; however there are differences in the mean of both factors among the two populations.Keywords:
Anxiety, Factorial Structure, Invariance of Measure, Confirmatory Multi-Sample Factorial Analysis1. Introduction
The ideal “thin” person and the concerns about weight come from a cultural ideal although nowadays it is considered aesthetic, this is, only a passing fashion and not necessarily healthy nor accessible which could have negative consequences as great concern about weight and body image that can be expressed as body size dissatisfaction, seen as the extent in which individuals value or despise their bodies in distortion to body image, that is the lack of accuracy in body size determination [1].
Body image and esthetic standards which currently rule Western World can affect psychological development of man and women, but pre pre-adolescent and adolescent women present a greater tendency to manage conflicts toward body image related to the eating behavioral problem development [2,3]. This is due to the “Slimness and Beauty” which are especially rigid for them [4].
The study about anxiety has traditionally been made in two different lines. First, from a psychological perspective,
anxiety is studied as an excited emotional state influenced by social environment elements as a permanent personality trait, which reflects individual differences, influenced by intrinsic elements of the individual [5,6], on the basis of psychometrical tools to analyze an illness or a mental disorder, based on qualitative categories as the ones offered by the Diagnostic and Statistical Manual of Mental Disorders (DSM) by the American Psychiatric Association, focused in the study of cases.
This study is based on the study of anxiety from a psychological point of view, using its own psychological measuring tools applied to this clinically healthy population to know their levels of anxiety state and feature in their body image [7,8].
for instance, nose, forehead, ears and hands, providing evidences and data that promotes Educational Intervention into a perspective of attention to diversity in the classroom.
The main interest of this study is not only the factorial instrument, but also the psychometrical equivalence of it in different groups; since in the context of inter-groupal comparison is crucial to consider the need of adapting an instrument of a psychological measure that contains all the equivalence criteria, but all above is consider if the same factorial structure is applicable to different groups of subjects or in a more generic form to different types of population [9-11], with the purpose of counting on valuable information for tutoring and the personal development systems in our universities; offering evidences and data that promotes Educational Intervention into a perspective of attention to diversity inside the classroom.
2. Method
2.1. Participants
The sample consisted of 1181 participants, 592 (50.1%) engineering students and 589 (49%) social sciences students. This was achieved from a convenience sampling trying to cover a representative sample from both areas (engineering and social sciences) offered at the Autonomous University of Chihuahua.
The students sample from engineering area was composed of 592 participants; 143 (24%) women and 449 (75.8%) man. The age was ranging from 17 and 20 years old, with a mean of 18016 and a standard deviation of 0.73 years old.
The students sample from social sciences was composed of 589 participants; 376 (63.8%) women and 449 (75%) man. The age was raging from 17 to 20 years old, with a mean of 18.24 and a standard deviation of 0.74 years old.
2.2. Instrument
Body Image Anxiety Scale (BIAS) in its original version, is a 15 items questionnaire which evaluates anxiety-trait related to weight (8 items related to Weight Factor) and with body parts not related to weight (7 items related to No-Weight Factor), where the respondent in a scale from 0 to 4 answered how anxious, tense, or nervous feels toward specific body parts. According to [7] the BIAS has a good internal consistency, good temporal stability and validity; which is consistent with internal consistency and validity reported by [12] with Cronbach alphas and congruent coeficients superior to .9. This type of survey was selected for its easy application [13]; in addition of providing a good base for a first individuals organization in the characteristic been measured.
Three adaptations to the original version were made for this study:
First adaptation. In the original scale it is scored with five answers, for this study, the subject chooses among eleven possible answers. The original was combined with
this new version as follows, nothing (0), slightly (1, 2 and 3), moderately (4, 5 and 6), a lot (7, 8, 9) and too much (10). This first adaptation is justified because the subjects are familiar to the scale from 0 to 10. They have been evaluatting this way by Mexico’s Educational System. [14] report a similar change in the validation scale with very similar characteristics, working with spanish subjects and [12] with mexican university students.
Second adaptation. In this version only 12 items were used according to the results reported by [15].
Third and last adaptation consisted in applying the instrument through a computer. This with the aim to store the data collected without previous codification stages, with more accurate precision and speed.
2.3. Procedure
Students from the first year at the engineering and social sciences areas at the Autonomous University of Chihuahua were invited to participate; the ones who accepted the invitation signed a consent letter. Then, the instrument explained above was applied through a computerized application using the instrument administrator module of scales editor, version 2.0 [16] in a session of about 25 minutes in the computer labs correspondent to each participating academic unit. At the beginning of each session students were given a brief introduction on the importance of the study and the protocol of how to access to the instrument was explained; instructions of how to answer were on the first computer screens, before the first instrument item. At the end of the session students were thanked for their contribution to the study.
Once the instrument was applied, data was collected by the results generator module of scales editor, version 2.0 [16].
2.4. Data Analysis
A psychometrical analysis was applied in two stages: 1) Factorial Confirmatory Analysis and 2) Invariance Factorial Analysis; so that it could obtain evidence that presents the best properties for the scores confirmation of body image anxiety of engineering and social sciences university students.
To conduct the confirmatory factorial analysis for each sample, AMOS 16 software was used [17], variances in terms of error were specified as free parameters, in every variable (factor) a structural coefficient was set associated to one, so that scale was equal to the superficial variables (items). The estimated method used was the maximum credibility; following the recommendation of [18], so when the confirmatory factorial analysis is used, it is necessary to verify not only the adjustment of the theoretical model but it is recommended to compare the adjustment of some alternative models to select the best.
as absolute adjustment measures. The goodness of fit index (GFI), the Tucker-Lewis index (TLI), the normed fit index (NFI) and the comparative fit index (CFI) measures of increasing adjustment. Parsimony normed fit index (PNFI), the Parsimony Goodness of fit index (PGFI), the Chi-squared fit index divided by degrees of freedom (CMIN/GL) and the Akaike information criterion (AIC) as adjusting measures of Parsimony [19,20].
To find out the factorial invariance of the body image anxiety scale (BIAS) among engineering and social sciences students, a series of multisampling confirmatory analysis were made through AMOS 16 software [17].
4. Results
4.1. Confirmatory Factorial Analysis
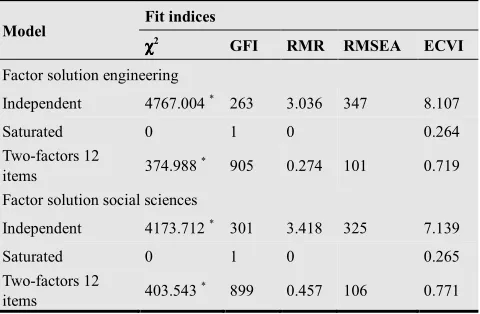
According to the results obtained in Table1 in the Confirmatory Factorial Analysis of 12 items grouped in two factors in the engineering sample is acceptable (GFI .905 y RMSEA .101) and according to the incremental adjustment measures and Parsimony (Tables 2 and 3) meaningfully superior to the independent model and very similar to the saturated model.
Furthermore the confirmatory factorial analysis the social sciences sample shows again the measuring model of two factor is acceptable (GFI .899 y RMSEA .106) and according to me incremental adjustment measures and Parsimony (Table 2 and 3) meaningfully superior to the independent model and very similar to the saturated model.
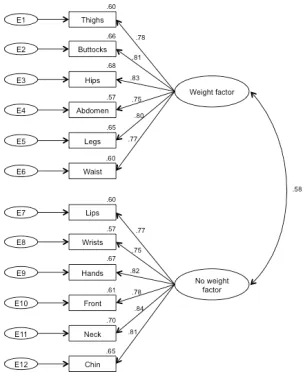
Figure 1 shows the measuring model of the first confirmatory factorial analysis (engineering students) for the 12 items grouped in three groups, including standardized regression coefficients among items and factors and the standardized factorial saturations (commonalities) of each item.
Both factors: anxiety “weight” trait and anxiety “no weight” trait present high standardized factorial saturations (higher than .50) therefore all the items result well explained from these factors.
The estimation of the correlation among the two factors of the scale is .58 shows that as it increases the level of anxiety in one of the factors, the other increases as well.
Figure 2 presents the measuring model of the second confirmatory factorial analysis (social sciences students) for the 12 items grouped in three groups, including standardized regression coefficients among items and factors and the standardized factorial saturations (commonalities) of each item.
Both factors: anxiety “weight” trait and anxiety “no weight” trait present high standardized factorial saturations (higher than .45) therefore all the items result well explained from these factors.
The estimation of the correlation among the two factors of the scale is .52 shows that as it increases the level of anxiety in one of the factors, the other increases as well.
Table 1. Absolute fit measurements for the generated models. Engineering and social sciences confirmatory factor analyses.
Model Fit indices
χχχχ2 GFI RMR RMSEA ECVI
Factor solution engineering
Independent 4767.004 * 263 3.036 347 8.107
Saturated 0 1 0 0.264
Two-factors 12
items 374.988
* 905 0.274 101 0.719
Factor solution social sciences
Independent 4173.712 * 301 3.418 325 7.139
Saturated 0 1 0 0.265
Two-factors 12
items 403.543
* 899 0.457 106 0.771
Note: * p < .01; ECVI = expected cross validation index; GFI = goodness of fit index; RMR = root mean square residual; RMSEA = root mean square error of approximation.
Table 2. Incremental fit measurements for the generated models. Engineering and social sciences confirmatory factor analyses.
Model Fit indices
AGFI TLI NFI CFI
Factor solution engineering
Independent .129 0 0 0
Saturated 1 1
Two-factors 12 items .861 .915 .921 .932
Factor solution social sciences
Independent .174 0 0 0
Saturated 1 1
Two-factors 12 items .851 .894 .877 .915
Note: AGFI = adjusted goodness of fit index; CFI = comparative fit index; NFI = normed fit index; TLI = Tucker-Lewis index.
Table 3. Parsimony fit measurements for the generated models. Engineering and social sciences confirmatory factor analyses.
Model Fit indices
PNFI PGFI CMIN/GL AIC Factor solution engineering
Independent 0 223 72.227 4791.004
Saturated 0 156.000
Two-factors 12 items 740 615 7.075 424.988
Factor solution social sciences
Independent 0 255 63.238 4197.712
Saturated 0 156.000
Two-factors 12 items 725 611 7.614 453.543
Note: AIC = Akaike information criterion; CMIN/DF = chi-squared fit index divided by degrees of freedom; PGFI = parsimony goodness of fit index; PNFI = parsimony normed fit index.
4.2. Invariance of the Factorial Structure among Engineering and Social Sciences Students
this conclusion (GFI .902; CFI .924; RMSEA .073; AIC 878.532) this allows us to accept the base model of invariance (model without restrictions).
Adding the base model restrictions on factorial charges, metric invariance is characterized. Values obtained from table permit to accept this invariance level. The Goodness of fit index (GFI= .889) and the approximation root mean square error (RMSEA= .071) continue offering convergent information in this direction. Besides Akaike information criteria (AIC= 888.984) and Bentler comparative fit index (CFI= .921) do not suffer big variations toward the previous model. The use of the criteria for the evaluation of the nested models proposed by [21] suggest that if the calculation of the difference of the CFI of both nested models diminish in .01 or less, the restricted model is taken for granted therefore the compliance of the factorial invariance. The difference of the CFIs obtained .003 allows accepting the metrical invariance model. We can conclude up to this point that factorial charges are equivalent in the two samples. Once the demonstrated metric invariance enters the samples, the next step to the evaluation is the equivalence among intercepts (strong factorial invariance). The indices in (Table 4) show a good adjustment model evaluated independent as well as analyzed toward it nesting with the metric invariance model. The difference between the two comparative indices of Bentler is .001; and the general adjustment index is .897 and the root mean square error of approximation is .071. Accepted then the strong invariance, the two evaluated models are equivalent toward the factorial coefficients and the intercepts.
4.3. Contrasts of the Means of the Factors among Students from Engineering and Social Sciences
Once proved the factorial invariance, the differences among the means of the factors from the two groups were estimated taking as a reference the Social Sciences sample establishing 0 as the value of the measures this sample, considering freely the value of the measures for the sample of engineering. Restrictions about regression coefficients and intercepts required for the contrast among the measures made automatically through the software AMOS 16
(Arbuckle, 2007). The results of the comparisons between means indicated that the mean of the factors “weight” and “no-weight” were meaningfully lower (-1.100, p <0.001 y -0.326, p <0.01 respectively) in engineering students.
Figure 1. Measuring model for the scale. Confirmatory factorial analysis of engineering students.
Figure 2. Measuring model for the scale. Confirmatory factorial analysis of Social Sciences students.
Table 4. Adjusted goodness of fit indices of each model analyzed from the factor invariance test.
Model Fit indices
χχχχ2 gl GFI NFI CFI RMSEA AIC
Model without restrictions 778.532 * 106 902 913 924 073 878.532
Metric Invariance 808.984 * 116 899 910 .921 071 888.984
Strong factor invariance 821.139 * 119 897 908 920 071 895.139
Note: * p < .05; AIC = Akaike information criterion; CFI = comparative fit index; GFI = goodness of fit index; NFI = normed fit index; RMSEA = root mean
square error of approximation.
5. Conclusions
From the results, analysis and discussion shown, and taking in consideration the main objective of this study which was to examine the factorial structure and the measure of the invariance of this structure in engineering
correlate among themselves in a positive way and statistically significant, shows that, as anxiety perceived increases in one of the factors, the other factor increases as well.
2) Factorial Invariance Analysis among samples shows a high congruency between the two pair of factors. This suggests the existence of strong validity evidences crossed with the mean and so the stability of the structure, until there is evidence to the contrary.
3) Comparisons among groups showed meaningful differences, in favor of engineering students in both factors means. This suggests that students from engineering show less levels of anxiety than students from social sciences in relation with their body.
In synthesis, the analysis of the psychometric properties has shown that a bi-factorial structure is feasible and appropriate according to the established psychometric requirements when the informants were the same students. The structure of the two factors, based on statistical and substantive criteria have demonstrated adequate adjustment indicators or reliability and validity; which is consistent with the results found by [12,15]. However, we consider that more studies are necessary to corroborate or refute data obtained in this present study.
If the square-shaped pixel size in our images was 8 × 8 screen-pixels, this amounted to about 21 pixels per face quantization (an equivalent of about 10.5 cycles/face). With this level of image detail, all three basic varieties of configural information change of spatial quantization between 11 pixels/face and 6 pixels/face levels altogether indicate that this ERP- component is especially sensitive to the first-order configural cues.
Acknowledgments
This study is part of a project funded by the Secretaría de Educación Pública-Subsecretaría de Educación Superior-Dirección General de Educación Superior Universitaria de México [Mexican Ministry of Education-Department of Higher Education-General Directorate of theUniversity Education] (OF-13-6894).
References
[1] Anuel, Bracho, Brito, Rondón, & Sulbarán. Cognitive mechanisms of self-acceptance and body image. Psicothema, 2012. 24(3): p. 390-395.
[2] Anuel, Bracho, Brito, Rondón, & Sulbarán. Autoaceptación y mecanismos cognitivos sobre la imagen corporal. Psicothema, 2012. 24(3): p. 390-395.
[3] Francisco, R., Alarcão, M., and Narciso, I. Evaluation of risk factors for development of eating disorders: Development and validation studies of the Portuguese version of the McKnight Risk Factor Survey IV. Revista Iberoamericana de Diagnóstico y Evaluación Psicológica, 2011. 32(2): p. 143-170.
[4] Francisco, R., Alarcão, M., and Narciso, I. Avaliação de factores de risco de desenvolvimento de perturbações alimentares: Desenvolvimento e estudos de validação da versão portuguesa do McKnight Risk Factor Survey IV. Revista Iberoamericana de Diagnóstico y Evaluación Psicológica, 2011. 32(2): p. 143-170.
[5] Thompson, J.K., Introduction: Body image, eating disorders, and obesity – An emerging synthesis, in Body image, eating disorders, and obesity: An Integrative Guide for Assessment and Treatment, J.K. Thompson, Editor. 2003, American Psychological Association: Washington, D C. p. 1-20.
[6] Calaf, León, Hilerio, & Rodríguez. Inventory of Body Image Teen Women (IICFA). Revista Interamericana de psicología, 2005. 39(3): p. 347-354.
[7] Calaf, León, Hilerio, & Rodríguez. Inventario de Imagen Corporal para Féminas Adolescentes (IICFA). Revista Interamericana de psicología, 2005. 39(3): p. 347-354.
[8] Spielberger, C.D., Current trends in theory and research on anxiety, in Anxiety: current trends in theory and research, C.D. Spielberger, Editor. 1972, Academic Press: New York.
[9] Lazarus, R.S. Emotion and adaptation. 1994, New York: Oxford University Press.
[10] Raich, R.M., Imagen corporal. Know and appreciate their own body. 2000, Madrid: Pirámide.
[11] Raich, R.M., Imagen corporal. Conocer y valorar el propio cuerpo. 2000, Madrid: Pirámide.
[12] Raich, R.M., A perspective from the health psychology of body image. Revista Avances en Psicología Latinoamericana, 2004. 22: p. 15-27.
[13] Raich, R.M., Una perspectiva desde la psicología de la salud de la imagen corporal. Revista Avances en Psicología Latinoamericana, 2004. 22: p. 15-27.
[14] Abalo, Lévy, Rial, & Varela. Factorial invariance with multiple samples, in Modelling with Covariance Structures in Social Sciences J. Lévy Mangin, Editor. 2006, Netbiblo: Madrid. p. 259-278
[15] Abalo, Lévy, Rial, & Varela. Invarianza factorial con muestras múltiples, en Modelización con Estructuras de Covarianzas en Ciencias Sociales J. Lévy Mangin, Editor. 2006, Netbiblo: Madrid. p. 259-278.
[16] Blanco, Martínez, Zueck, & Gastélum. Psychometric analysis of the self-efficacy scale in academic behaviors in college freshmen. Actualidades Investigativas en Educación, 2011. 11(3): p. 1-27.
[17] Blanco, Martínez, Zueck, & Gastélum. Análisis psicométrico de la escala autoeficacia en conductas académicas en universitarios de primer ingreso. Actualidades Investigativas en Educación, 2011. 11(3): p. 1-27.
[18] Castañeda, Pineda, Gutiérrez, Romero, & Peñalosa. Construction of instruments study strategies, self-regulation and personal epistemology. Construct validation. Revista Mexicana de Psicología, 2010. 27(1): p. 77-85.
[20] Ornelas, Blanco, Rodríguez y Flores. Psychometric analysis of the self-efficacy scale behavior of physical health care in university freshmen. Formación Universitaria, 2011. 4(6): p. 21-34.
[21] Ornelas, Blanco, Rodríguez y Flores. Análisis psicométrico de la escala autoeficacia en conductas de cuidado de la salud física en universitarios de primer ingreso. Formación Universitaria, 2011. 4(6): p. 21-34.
[22] Raviolo, Ramirez, López, & Aguilar. Conceptions of knowledge and scientific models: a preliminary study. Formación Universitaria, 2010. 3(5): p. 29-36.
[23] Raviolo, Ramirez, López, & Aguilar. Concepciones sobre el conocimiento y los modelos científicos: un estudio preliminar. Formación Universitaria, 2010. 3(5): p. 29-36.
[24] Viciana, J., E.M. Cervelló, and J. Ramírez, Effects of manipulating positive and negative feedback on goal orientation, perceived motivational climate, satisfaction, task choice, perception of ability, and attitude to physical education lessons. Perceptual and motor skills, 2007. 105(1): p. 67-82.
[25] Ornelas, Gastélum, Blanco y Peinado. Psychometric analysis of the test Trait Anxiety Scale Body Image version higher education students. Perfiles Educativos, 2014. 36(144): p. 120-137.
[26] Ornelas, Gastélum, Blanco y Peinado. Análisis psicométrico de la prueba Body Image Anxiety Scale Versión Rasgo en alumnos de educación superior. Perfiles Educativos, 2014. 36(144): p. 120-137.
[27] Blanco, H., et al., Editor for creating and applying computerise surveys. Procedia Social and Behavioral Sciences, 2013. 106: p. 935-940.
[28] Arbuckle, J.R., AMOS users guide version 16.0. 2007, Chicago, IL: Marketing Department, SPSS Incorporated.
[29] Thompson, B., Exploratory and Confirmatory Factor Analysis. Understanding concepts and applications. . 2004, Washington, D C: American Psychological Association.
[30] Gelabert, E., et al., Psychometric properties of the Spanish version of the Frost Multidimensional Perfectionism Scale in women. Psicothema, 2011. 23(1): p. 133-139.
[31] Leighton, J., R. Gokiert, and Y. Cui, Using Exploratory and Confirmatory Methods to Identify the Cognitive Dimensions In a Large-Scale Science Assessment. International Journal of Testing, 2007. 7(2): p. 141-189.