R E S E A R C H A R T I C L E
Open Access
Metabolic modeling of synthesis gas
fermentation in bubble column reactors
Jin Chen
1, Jose A. Gomez
2, Kai Höffner
2, Paul I. Barton
2and Michael A. Henson
1*Abstract
Background:A promising route to renewable liquid fuels and chemicals is the fermentation of synthesis gas (syngas) streams to synthesize desired products such as ethanol and 2,3-butanediol. While commercial development of syngas fermentation technology is underway, an unmet need is the development of integrated metabolic and transport models for industrially relevant syngas bubble column reactors.
Results:We developed and evaluated a spatiotemporal metabolic model for bubble column reactors with the syngas fermenting bacteriumClostridium ljungdahliias the microbial catalyst. Our modeling approach involved combining a genome-scale reconstruction ofC. ljungdahliimetabolism with multiphase transport equations that govern convective and dispersive processes within the spatially varying column. The reactor model was spatially discretized to yield a large set of ordinary differential equations (ODEs) in time with embedded linear programs (LPs) and solved using the MATLAB based code DFBAlab. Simulations were performed to analyze the effects of important process and cellular parameters on key measures of reactor performance including ethanol titer, ethanol-to-acetate ratio, and CO and H2conversions.
Conclusions:Our computational study demonstrated that mathematical modeling provides a complementary tool to
experimentation for understanding, predicting, and optimizing syngas fermentation reactors. These model predictions could guide future cellular and process engineering efforts aimed at alleviating bottlenecks to biochemical production in syngas bubble column reactors.
Keywords:Metabolic modeling, Bioprocess engineering, Microbial fermentation, Ethanol production
Background
The development of alternative, renewable sources of fuels and chemicals to reduce our dependence on petroleum has emerged as a paramount challenge for maintaining the economic security and environmental wellbeing of the USA. An essential component of this quest is to develop renewable, environmentally friendly sources of biochemi-cals via the conversion of readily available plant biomass and waste streams that represent a significant quantity of reduced carbon feedstock. An emerging conversion route with wide feedstock versatility is direct fermentation of waste gas streams and synthesis gas (syngas; mainly comprised of H2/CO/CO2) by specialized CO fermenting
microbes. Because syngas can be produced relatively cheaply from a wide variety of biomass feedstocks [1, 2],
the bottleneck in this route is the syngas fermentation step. Key considerations are the metabolic capabilities and performance of the microbial catalyst that converts syngas into the desired biochemical, gas–liquid mass transfer characteristics that determine the availability of soluble gas components for microbial conversion and the bio-reactor design that affects all aspects of the conversion process.
Gas fermentation for production of fuels and chemicals A model syngas-consuming organism is Clostridium ljungdahlii, a rod-shape anaerobic bacterium that was discovered in 1987 and found to have the ability to fer-ment CO and H2into ethanol and acetate [3]. This
dis-covery initiated a wave of research and development efforts aimed at understanding and optimizing syngas fer-mentation for ethanol production [4]. Several other bac-teria includingC. aceticum[5],Acetobacterium woodii[6], and C. carboxidivorans [7] also have been studied for
* Correspondence:[email protected]
1
Department of Chemical Engineering, University of Massachusetts, Amherst, MA 010003, USA
Full list of author information is available at the end of the article
© 2015 Chen et al. This is an Open Access article distributed under the terms of the Creative Commons Attribution License (http://creativecommons.org/licenses/by/4.0), which permits unrestricted use, distribution, and reproduction in any medium, provided the original work is properly credited. The Creative Commons Public Domain Dedication waiver (http:// creativecommons.org/publicdomain/zero/1.0/) applies to the data made available in this article, unless otherwise stated. Chenet al. Biotechnology for Biofuels (2015) 8:89
syngas fermentation. All these mesophilic bacteria syn-thesize ethanol through the reductive acetyl-CoA meta-bolic pathway, a non-cyclic, fermentative pathway which is active under anaerobic conditions [8]. Electrons re-quired in the pathway are supplied by the syngas com-ponents CO and H2. Optimal growth conditions for C. ljungdahliihave been reported as 37 °C and pH of 6.0 [9], but at least one study claims that ethanol synthesis was increased at lower pH values where growth was sig-nificantly reduced [10].
One of the most challenging problems in syngas fer-mentation is to establish culture conditions which offer favorable gas–liquid mass transfer characteristics such that the syngas is readily dissolved and available for mi-crobial conversion. A variety of reactor types including stirred tank reactors, trickle bed reactors, packed bed reactors, monolithic biofilm reactors, membrane-based reactors, and bubble column reactors have been investi-gated [9]. While more advanced designs based on bubble column reactors are being developed for large-scale pro-duction [8], most academic research has been performed in stirred tank reactors with continuous liquid and syn-gas flows. Stirred tank reactors can have CO mass trans-fer coefficients over 100 h−1through the use of specially designed impellers, high agitation rates, and microspar-gers that create small gas bubbles [9, 11]. However, sub-stantially enhanced syngas mass transfer can be achieved in bubble column reactors due to higher average mass transfer driving forces caused by favorable gas compos-ition spatial profiles and longer gas–liquid contact times. Another potential strategy for increasing syngas solu-bility is the use of elevated operating pressures [12]. This approach has not been widely studied because gas com-pression at the industrial scale is costly.
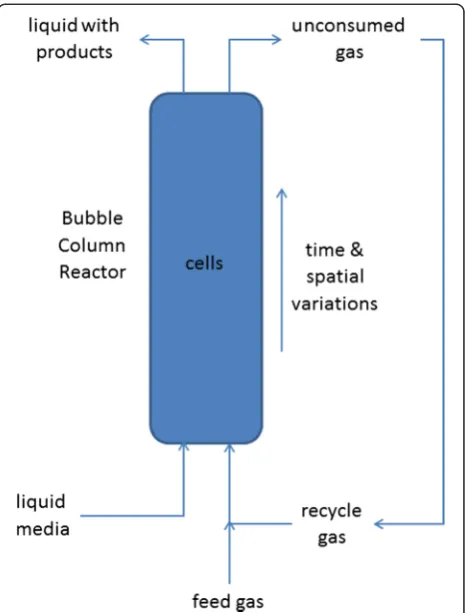
Because the syngas feed is introduced into the bottom of the bubble column (Fig. 1), CO and H2
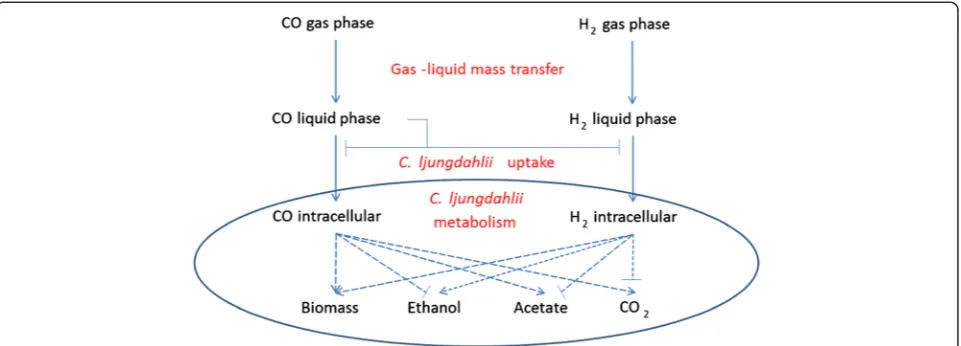
concentra-tions decrease as the gas flows up the column due to cellular consumption. Therefore, the column has spa-tially varying dissolved gas concentrations that affect cel-lular growth and product synthesis. In principle, high dissolved CO concentrations throughout the column are desirable since CO is the primary carbon source for growth. Previous experimental studies [8, 13] have sug-gested that high dissolved CO levels can inhibit both CO and H2 uptake rates (Fig. 2). Therefore, column
opti-mization requires that dissolved CO concentrations are sufficiently high near the top of the column to promote growth, but CO concentrations near the bottom of the column are not so high as to significantly inhibit gas up-take rates. The relative amounts of dissolved CO and H2
have a strong impact on the split between the desired product ethanol and the undesired byproduct acetate [14, 15]. While ethanol synthesis is promoted at high H2
concentrations, the ratio of ethanol to acetate increases
with increasing H2 concentration. Therefore, the
objec-tive is to establish desirable H2 and CO concentration
profiles along the column such that the ethanol pro-duction is maximized and the acetate propro-duction is minimized. The design and operation of bubble column reactors to achieve a suitable compromise between these competing objectives has proven to be a difficult chal-lenge that has limited commercial syngas fermentation technology. We believe that the development of model-based techniques for simulating and optimizing syngas bubble column reactors is essential to advance this technology.
Spatiotemporal modeling of microbial metabolism Steady-state [16] and dynamic [17–20] flux balance ana-lysis techniques based on genome-scale metabolic re-constructions have become standard tools for analyzing microbial metabolism. Recently, the first genome-scale metabolic reconstruction of a CO fermenting organism was introduced for the bacterium C. ljungdahlii [21]. The iHN637 model includes an extensive reaction net-work of central metabolism, including the pathways in-volved in carbon fixation and energy conservation. The model was shown to be capable of producing acetate, etha-nol, and 2,3-butanediol under conditions consistent with
experimental data. While a few very simple unstructured growth models of syngas fermentation have been de-veloped [22, 13], we are not aware of any dynamic models based on FBA and/or genome-scale metabolic reconstructions.
Dynamic modeling of syngas bubble column reactors poses an additional challenge not encountered in well-mixed stirred tank reactors. Namely, spatial gradients are present because the dissolved CO and H2concentrations
decrease as the gas flows up the column due to cellular consumption [8]. The cellular growth and product syn-thesis rates along the column are determined by these local dissolved gas concentrations. While spatiotemporal models that account for both spatial and temporal variations in the extracellular environment have been con-structed, these studies utilized table lookups of precom-puted FBA solutions [23–25] or heuristic lattice-based descriptions of nutrient diffusion [23–25]. We propose a general methodology for spatiotemporal metabolic mo-deling based on combining genome-scale reconstructions with fundamental transport equations that capture the relevant convection and/or diffusional processes. Add-itional details on the numerical solution procedure will be available in a forthcoming publication. The model solution procedure involved spatially discretizing the partial ferential equations (PDEs) to generate an ordinary dif-ferential equation (ODE) system with embedded linear programs (LPs) that was integrated with DFBAlab [26], a MATLAB code that performs reliable and efficient dy-namic FBA simulations. We demonstrated the capabilities of our approach by performing dynamic simulations with the syngas bubble column reactor model presented below. The contributions of the present study include the follow-ing: (1) a detailed presentation of the bubble column model including experimentally derived parameters and
(2) an extensive investigation into the effects of process and cellular parameters on bubble column performance.
Results and discussion
Impact of design and operating parameters on bubble column performance
The model was used to predict the effects of important design and operating parameters on bubble column performance, as measured by the liquid and gas phase concentrations exiting the reactor under steady-state conditions. Due to the lack of accurate dissolved gas up-take kinetic parameters and directly comparable experi-mental data for model validation, the model predictions should be viewed as qualitative rather than quantitative. This capability was deemed sufficient for predicting trends with respect to key parameters. Each prediction was generated by simulating bubble column startup with N= 100 node points and a final time of 1000 h to obtain the steady-state solution. Typically 5–10 simulations were performed for each parameter, and plots showing parameter trends were generated by linearly inter-polating the cases ran (indicated by asterisks) within MATLAB.
We first investigated the impact of the feed compos-ition by varying the CO mole fraction with the H2mole
fraction adjusted such that the mole fractions summed to unity. Experimental studies [27] have shown that ethanol synthesis is favored relative to acetate synthesis at high H2/CO feed ratios. We observed the same trend
in our bubble column simulations (Fig. 3). The ethanol titer was predicted to achieve a maximum of 120 g/L at a CO mole fraction of 0.45, which represents a H2rich
feed. As the mole fraction was increased beyond this value, the ethanol concentration was predicted to de-crease and acetate synthesis began. The ethanol and
Fig. 2The effects of CO and H2mass transfer and cellular uptake on biomass production and the distribution of metabolic products byC. ljungdahlii. The lines with arrows represent positive/activating effects and the lines with bars represent negative/inhibitory effects
acetate concentrations were approximately equal at a mole fraction of 0.55. Thereafter, the acetate titer in-creased rapidly, the ethanol titer dein-creased rapidly, and CO2 synthesis began due to low dissolved H2 levels.
Interestingly, the acetate concentration decreased at CO mole fractions beyond 0.75, presumably due to reduced biomass production. A maximum biomass concentration of about 35 g/L was predicted for a 50/50 CO/H2
mixture.
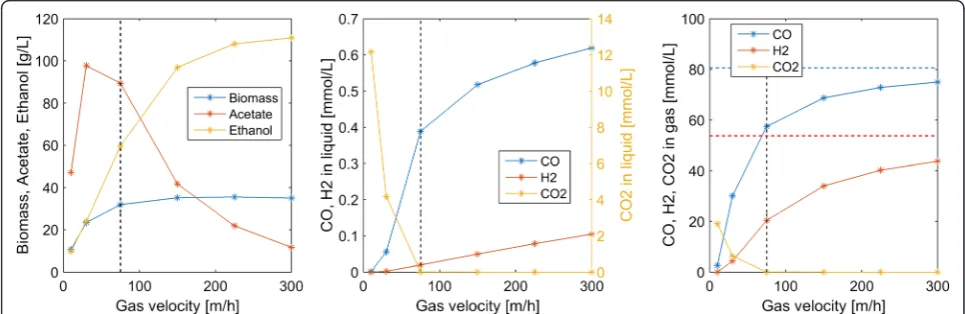
Next we explored the impacts of the superficial gas velocity (uG) reactor performance. Increasing uG also
caused the gas volume fractionεGto increase according
to Eq. 9. High uGvalues were predicted to increase
dis-solved CO and H2concentrations at the expense of
re-duced CO and H2conversions in the gas phase (Fig. 4).
Due to enhanced dissolved H2 concentrations, high uG
values produced more favorable ethanol/acetate splits.
For example,uG= 300 m/h produced an ethanol/acetate
ratio of 10:1 but CO and H2conversions of only 7 and
19 %, respectively. Conversely, low uG values produced
more favorable conversions but high acetate concentra-tions as well as substantial CO2synthesis.
Many experimental studies have argued that the effi-ciency of syngas fermentation is limited by gas–liquid mass transfer [28]. To explore this claim, we varied the CO gas–liquid mass transfer coefficients km,Cto cover a
range of values reported in the literature [9]. As with our nominal values, we set the H2mass transfer
coeffi-cientkm,Hto be 250 % larger than the CO value and the
CO2mass transfer coefficientkm,Dto be equal to the CO
value. As expected, the primary value of high mass transfer coefficients was predicted to increase dissolved CO and H2concentrations, with CO much more strongly
affected (Fig. 5). Below our nominal valuekm,C = 80 h−1, Fig. 3Effect of the feed CO mole fraction on steady-state concentrations in the exiting liquid and gas streams. Thedashed linesindicate the nominal feed CO mole fraction used in the other simulations
acetate was the primary byproduct and no CO2 was
synthesized. Above this nominal value, the acetate titer decreased rapidly and the ethanol titer increased rapidly such that the ethanol/acetate ratio was 5.75 at km,C = 500 h−1. Such high mass transfer coefficients can
be achieved in bubble column reactors through the use of syngas microsparging and/or internal packing to increase gas–liquid contact [9]. Enhanced gas–liquid mass transfer also improved syngas consumption, with the CO and H2
conversions increased to 34 and 89 %, respectively, at km,C= 500 h−1.
Most column operating conditions investigated in this study were predicted to produce low syngas conversions due to limited gas–liquid mass transfer and cellular up-take rates. For example, our nominal conditions resulted in 62 % H2 conversion and 29 % CO conversion. One
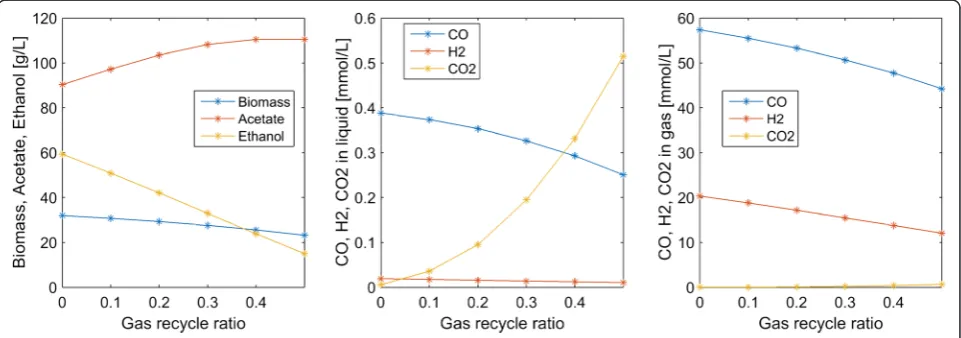
method for increasing these conversions is partial re-cycle of unconsumed gas exiting the top of the column (Fig. 1). We explored the effects of gas recycle by allow-ing a fraction α of the gas exiting the column to be recycled and mixed with the fresh syngas feed. While syngas conversion was predicted to be improved as ex-pected, gas recycling had the undesirable effect of sub-stantially reducing the ethanol titer and the ethanol/ acetate ratio (Fig. 6). This behavior seemed to be caused by decreasing dissolved H2concentrations as the recycle
ratio was increased.
Impact of gas uptake parameters on bubble column performance
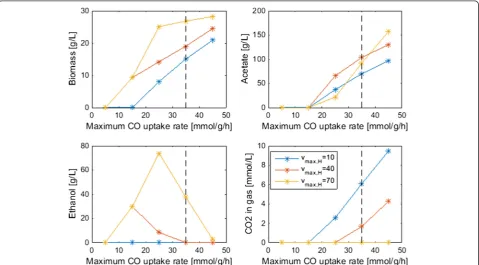
The model was used to predict the effects of important gas uptake parameters on bubble column performance, as
Fig. 5Effect of the CO gas–liquid mass transfer coefficientkm,Con steady-state concentrations in the exiting liquid and gas streams. The H2 and CO2mass transfer coefficients were set to be 2.5km,Candkm,C, respectively. Thedashed linesindicate the nominalkm,Cvalue used in the other simulations
Fig. 6Effect of the gas recycle ratio on steady-state concentrations in the exiting liquid and gas streams. No gas recycle was used in the other simulations
measured by steady-state concentrations at the column exit as before. Because our nominal CO and H2maximum
uptake rate values had substantial uncertainty, we varied these maximum rates to investigate their impact. Both up-take rate parameters were predicted to have substantial ef-fects on biomass production, with small rates insufficient to meet the ATP maintenance requirements of the cell and generating no growth (Fig. 7). The maximum rate pa-rameters also affected both the amount and distribution of metabolic byproducts. For a H2maximum uptake rate vmax,H = 10 mmol/gDW/h, the model predicted that no
ethanol would be synthesized regardless of the CO uptake rate. In this case, increasing amounts of acetate and CO2
were produced as the CO maximum uptake ratevmax,C
was increased. For larger H2 maximum uptake rates,
increasing amounts of ethanol were synthesized up to vmax, C = 25 mmol/gDW/h, at which point the ethanol
titer began to drop while the acetate titer continued to in-crease. We also varied the saturation constants in the CO and H2 uptake rate expressions (Eq. 2) to examine their
impacts. The main effect of increasing the CO saturation constant was to decrease the acetate titer and increase the ethanol titer by establishing more favorable ratios of the two gas uptake rates (results not shown). Decreasing the H2saturation constant had the same effect.
Previous experimental studies [8, 13] have suggested that high dissolved CO levels can inhibit the uptake of
CO and/or H2. To explore the impact of such inhibitory
effects, we modified the uptake rate expressions as follows:
vC¼
vmax;CC
Km;CþCþC
2.
KI;C
1
1þEþA KI
vH ¼
vmax;HC Km;HþH
1
1þEþA KI
1
1þ C KI;H
ð1Þ
whereKI,C andKI,H are parameters that account for CO
inhibition of CO uptake and H2uptake, respectively. Each
parameter was varied independently to obtain three values that corresponded to no inhibition (KI,C=KI,H= 106g/L),
moderate inhibition, and strong inhibition. As expected, inhibition of either CO or H2 uptake was predicted to
reduce steady-state biomass production throughout the column (Fig. 8). CO inhibition had the interesting effect of substantially reducing acetate synthesis but having very little impact on the exiting ethanol titer due to the estab-lishment of more favorable intracellular CO/H2levels. At
the highest level of inhibition, no acetate was produced and the ethanol titer was over 60 g/L. Conversely, CO in-hibition of H2 uptake shifted the product distribution
strongly towards acetate with no ethanol produced at the highest inhibition level.
Conclusions
Bubble columns are the preferred reactor technology for industrial production of fuels and chemicals from synthe-sis gas. A number of experimental studies have been per-formed to investigate the effects of the microbial catalyst, the column design parameters, and the column operating conditions on syngas fermentation performance [9]. Be-cause the effect of cellular and process parameters on column performance are complex, mathematical model-ing provides a complementary tool to experimentation for understanding, predicting, and optimizing syngas fer-mentation reactors. We developed a spatiotemporal meta-bolic model for bubble column reactors by combining a genome-scale metabolic reconstruction of the syngas fer-mentating bacteriumC. ljungdahliiwith multiphase trans-port equations that govern convective and dispersive processes within the spatially varying column. To obtain a computationally tractable model, we performed spatial discretization to yield a large set of ordinary differential equations (ODEs) in time with embedded linear programs (LPs). Our initial attempts to solve the discretized model within MATLAB using a straightforward combination of
built-in ODE solvers and the MOSEK LP solver proved unsuccessful. We found the recently developed MATLAB based code DFBAlab [26] to be a critical enabling tool, without which this study would not have been possible. Model translation into the DFBAlab format required min-imal work.
Column startup was dynamically simulated with dif-ferent process parameters to generate steady-state col-umn profiles for analysis of parameter trends. Because the liquid product stream was removed from the top of the column, we focused our analysis on liquid and gas phase concentrations at this point. Our analysis was limited to syngas feed streams containing only CO and H2. We predicted the following trends that could guide
column design and operation for maximization of etha-nol production:
A maximum ethanol titer of 120 g/L and no acetate production were achieved at a CO mole fraction of 0.45 (Fig.3). The ethanol concentration decreased rapidly, CO2synthesis occurred and acetate quickly
became the dominant byproduct at higher CO mole
Fig. 8Effect of CO inhibition of CO uptake (left) and H2uptake (right) on steady-state biomass and byproduct production throughout the column. The nominal case corresponds to no inhibition (KI,C=KI,H= 106g/L)
fractions, suggesting that H2augmentation of
CO-rich syngas feeds may be beneficial.
High superficial gas velocities enhanced the ethanol titer and ethanol/acetate split at the expense of low CO and H2conversions (Fig.4), indicating the
possible benefit of recycling unconsumed gas to achieve higher conversions.
Partial recycling of unconsumed gas showed the potential to substantially improve CO and H2
conversions at the expense of increased gas compression costs (Fig.6). Because recycling had the negative effect of reducing the ethanol titer and the ethanol/acetate ratio due to depleted H2levels,
H2augmentation may be necessary to achieve
acceptable process economics.
Enhanced ethanol titer and ethanol/acetate split were achieved with increasing liquid velocity up to a critical value at which the column was washed out (results not shown). The development of reactor monitoring and control strategies would be necessary to stably operate near this critical value.
Increasing reactor length enhanced both the ethanol titer and the ethanol/acetate split (results not shown). Because taller reactors required more syngas feed compression, an economic analysis would be needed to determine the optimal length.
Efficient gas–liquid mass transfer was found to be critical to achieve high ethanol production and high conversions (Fig.5). A CO mass transfer coefficient of 500 h−1was predicted to produce an ethanol titer of 130 g/L, an ethanol/acetate ratio of 6, and CO and H2conversions of 34 and 89 %, respectively, for
a syngas feed containing 60 % CO. These results demonstrate the need for continued development of advanced bubble column designs that achieve very high gas–liquid mass transfer rates.
The bubble column model also was used to investigate the effect of CO and H2uptake
parameters on reactor performance. The following trends were observed that could guide the engineering of bacterial syngas uptake kinetics for ethanol overproduction:
Enhanced H2uptake rates achieved either by
increasing the maximum uptake rate or by reducing the uptake saturation constant substantially
increased the ethanol titer and the ethanol/acetate ratio (Fig.7). Consequently,C. ljungdahlii
engineering efforts should focus on increasing H2
uptake rates.
Ethanol and/or acetate inhibition of growth modeled as inhibition of the CO and H2uptakes reduced
biomass production but increased the ethanol titer and the ethanol/acetate ratio (results not shown).
Therefore, cellular engineering efforts aimed at reducing byproduct inhibition may have limited effectiveness.
Inhibition of CO uptake at high CO levels reduced biomass production but had almost no effect on the ethanol titer while reducing acetate synthesis (Fig.8). Conversely, CO inhibition of H2uptake reduced
growth and shifted the product distribution strongly towards acetate. Consequently,C. ljungdahlii engineering efforts should focus on alleviating CO inhibition of H2uptake.
Future work on syngas bubble column modeling could include the incorporation of more realistic column hydrodynamics [29] to improve model fidelity.
Methods
Model formulation
The bubble column model was formulated by combining a genome-scale metabolic reconstruction ofC. ljungdahlii with uptake kinetics for dissolved gases and reaction-convection-dispersion type equations for gaseous and dis-solved substrates and synthesized metabolic byproducts. The C. ljungdahlii iHN637 reconstruction accounts for 637 genes, 698 metabolites, 690 intracellular reactions, and 95 exchange reactions that capture the primary meta-bolic pathways involved in synthesis gas fermentation [21]. The model has been shown to produce growth on several known substrates including CO and CO2/H2
mix-tures as well as to provide good agreement with experi-mentally determined growth and acetate production rates on fructose. Our preliminary flux balance calculations with the typical maximum growth objective showed that the primary metabolic byproducts for growth on CO/H2mixtures were ethanol, acetate, and CO2. We
as-sumed that the extracellular pH was maintained constant throughout the reactor such that the intracellular pH could be assumed constant at the value used for charge balancing of the metabolic reconstruction [21].
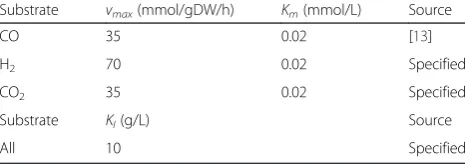
Uptake kinetics were specified for the dissolved gas-eous substrates CO and H2as well as for the dissolved
gaseous byproduct CO2that could be reassimilated.
Up-take kinetics were assumed to follow inhibited Monod expressions of the form,
vi¼
vmax;iSi Km;iþSi
1 1þEþA
KI
ð2Þ
where vi is the uptake rate (mmol/gDW/h) of the i-th
substrate, Si is the dissolved concentration (mmol/L) of
thei-th gaseous substrate,vmax,iis the maximum uptake
rate, Km,i is the saturation constant, and KI is an
to account for the known inhibitory effects of these two products on C. ljungdahlii growth [22, 30]. To reduce the number of model parameters, the two products were assumed to induce equal inhibition of all substrate up-take rates such that only a singleKIvalue was needed to
model inhibition of growth due to high ethanol and/or acetate concentrations. Equation (2) was used to estab-lish bounds on the possible uptake rates with the actual uptake rates being determined by the solution of the intracellular flux balance problem. Both vmax,i and Km,i
were important parameters due to the large dissolved gas concentration gradients in the bubble column re-actor (see Results).
Despite synthesis gas fermentation being an active re-search area, we found a dearth of literature for deter-mining the parameter values needed to calculate uptake rates for the three possible substrates (CO, H2, CO2).
Parameter values for the CO maximum uptake rate and saturation constant were obtained from a recent rimental study [13]. Based on our own limited expe-rimental data (unpublished), we assumed that the H2
maximum uptake rate was double the CO value. Because data was lacking for determination of the remaining pa-rameters, the CO2 maximum uptake rate and the H2
and CO2saturation constants were taken to be equal to
the corresponding CO values. The value of the inhib-ition constant was chosen based on our previous model-ing efforts involvmodel-ing uptake inhibition by ethanol and other toxic byproducts (Hanly and Henson 2014). Due to the large uncertainties associated with these param-eter values (Table 1), we explored the sensitivity of our model predictions to the dissolved gas uptake kinetics.
The genome-scale reconstruction of intracellular metab-olism and the substrate uptake kinetics were combined with reaction-convection-dispersion type equations for the bubble column transport processes. Because our focus was describing spatially varying cellular metabolism rather than detailed modeling of the potentially complex column hydrodynamics [29], we assumed ideal plug flow for the vapor phase and plug flow plus axial dispersion for the liquid phase. These assumptions represent reasonable simplifications given the gas superficial velocities within the bubbly flow regime (<5 cm/s; [29]) and the very small liquid velocities (<0.02 cm/s) used in our simulations. Convection and dispersion were assumed to occur only in
the axial direction of the bubble column reactor such that spatial variations could be captured with a single variablez.
The mass balance of C. ljungdahlii biomass had the form,
∂X zð Þ;t ∂t ¼μX−
uL
εL
∂X ∂z þDA
∂2X
∂z2
uLXð0;tÞ−εLDA∂
Xð Þ0;t ∂z ¼0
∂X L;tð Þ
∂z ¼0 X z;ð 0Þ ¼X0 ð3Þ
whereX is the biomass concentration (g/L),μis cellular growth rates (h−1) obtained from the flux balance calcu-lation, uL is the liquid phase velocity, εL is the liquid
phase volume fraction, andDAis the axial dispersion
co-efficient of the liquid phase. A typical Danckwerts boundary condition was imposed at the reactor entrance (z = 0), while a zero slope boundary condition was ap-plied at the reactor exit (z=L). A uniform biomass con-centration profile within the reactor was used as the initial condition.
Mass balances of the dissolved gaseous substrates had the form,
∂CLð Þz;t
∂t ¼vCXþ km;C
εL
C−CL ð Þ−uL
εL
∂CL
∂z þDA ∂2C
L
∂z2
uLCLð0;tÞ−εLDA
∂CLð0;tÞ
∂z ¼0
∂CLðL;tÞ
∂z ¼0 CLðz;0Þ ¼CL0 ∂HLð Þz;t
∂t ¼vHXþ km;H
εL
H−HL ð Þ−uL
εL
∂HL
∂z þDA ∂2H
L
∂z2
uLHLð0;tÞ−εLDA∂
HLð0;tÞ
∂z ¼0
∂HLðL;tÞ
∂z ¼0 HLðz;0Þ ¼HL0
ð4Þ
where CL and HL are the liquid phase CO and H2
con-centrations (mmol/L),vCandvHare the CO and H2
up-take rates (mmol/gDW/h) obtained from the flux balance calculation, km, C and km, H are the
correspon-ding gas–liquid mass transfer coefficients, and C* and H* are the saturated liquid concentrations (mmol/L) cal-culated from the corresponding gas phase concentra-tions using Henry’s law at the specified temperature and pressure. Constant gas–liquid mass transfer coefficients were used for simplicity despite their known dependence on various factors including gas bubble size [31], which was not modeled in this study. The Danckwerts boun-dary conditions imposed at the reactor entrance as-sumed the form shown since dissolved gases were not fed to the reactor, while zero slope boundary conditions were applied at the reactor exit. Uniform concentration profiles calculated from the initial gas phase concentra-tions using Henry’s law were imposed as initial condi-tions, which was consistent with the liquid phase being saturated with the feed gases prior to inoculation. Table 1Nominal dissolved gas uptake parameters
Substrate vmax(mmol/gDW/h) Km(mmol/L) Source
CO 35 0.02 [13]
H2 70 0.02 Specified
CO2 35 0.02 Specified
Substrate KI(g/L) Source
All 10 Specified
Mass balances of the two substrates in the gas phase had the form,
∂CGð Þz;t ∂t ¼−
km;C
εG
C−CL ð Þ−uG
εG ∂CG
∂z CGð0;tÞ ¼CGFCGðz;0Þ ¼CG0
∂HGð Þz;t ∂t ¼−
km;H
εG
H−HL ð Þ−uG
εG ∂HG
∂z HGð0;tÞ ¼HGFHGðz;0Þ ¼HG0 ð5Þ
whereCGandHGare the gas phase CO and H2
concen-trations (mmol/L), εG = 1-εL is the gas phase volume
fraction, and uG is the superficial gas velocity. The gas
concentrations at the reactor entrance CGF and HGF
were calculated from the partial pressures of the feed gas using the ideal gas law. Uniform initial conditions were specified by setting CG0 = CGF and HG0 = HGF,
which again was consistent with the liquid phase being saturated with the feed gases prior to inoculation.
Mass balances on the two major metabolic byproducts ethanol and acetate had the form,
∂ELð Þz;t
∂t ¼MEvEX− uL
εL
∂EL
∂z þDA
∂2EL
∂z2
uLELð0;tÞ−εLDA∂ELð0;tÞ
∂z ¼0
∂ELðL;tÞ
∂z ¼0 ELðz;0Þ ¼EL0
∂ALð Þz;t
∂t ¼MAvAX− uL
εL
∂AL
∂z þDA
∂2AL
∂z2
uLALð0;tÞ−εLDA∂ALð0;tÞ
∂z ¼0
∂ALðL;tÞ
∂z ¼0 ALðz;0Þ ¼AL0 ð6Þ
where EL and ALare the concentrations of liquid phase
ethanol (g/L) and acetate (g/L),vEand vA are the
corre-sponding fluxes (mmol/L) calculated from the flux bal-ance model, and ME and MA are the corresponding
molecular weight (g/mmol). Gas phase balances on etha-nol and acetate were omitted under the assumption of low volatility at column conditions. Danckwerts bound-ary conditions were imposed at the reactor entrance and zero slope boundary conditions were applied at the re-actor exit as before. Uniform ethanol and acetate con-centration profiles were used as initial conditions.
Mass balances on liquid and gas phase carbon dioxide had the form,
∂DLð Þz;t
∂t ¼vDXþ km;D
εL
D−DL
ð Þ−uLε
L
∂DL
∂z þDA
∂2DL
∂z2
uLDLð0;tÞ−εLDA∂DLð0;tÞ
∂z ¼0
∂DLðL;tÞ
∂z ¼0 DLðz;0Þ ¼DL0
∂DGð Þz;t
∂t ¼− km;D
εG
D−DL
ð Þ−uGε
G
∂DL
∂z DGð0;tÞ ¼DGF DGðz;0Þ ¼DG0
ð7Þ
whereDLandDGare the concentrations of liquid phase
CO2(mmol/L) and gas phase CO2 (mmol/L), vD is the
CO2 flux (mmol/L) calculated from the flux balance
model, km,D is the CO2 gas–liquid mass transfer
coeffi-cient, and D* is the saturated liquid CO2concentration
(mmol/L) calculated from the corresponding gas phase concentration using Henry’s law. For liquid phase CO2,
Danckwerts and zero slope boundary conditions were applied at the reactor entrance and exit as before. The CO2concentration at the reactor entrance DGFwas
cal-culated from the CO2 partial pressure of the feed gas
using the ideal gas law. This formulation allowed CO2to
be a feed component and/or a metabolic byproduct. A uniform liquid phase CO2 concentration profile
calcu-lated from the initial CO2gas phase concentration using
Henry’s law was imposed as an initial condition. A uni-form initial condition for gas phase CO2 was specified
by settingDG0=DGF.
The reactor was assumed to be isothermal, while the pressure profile was calculated from the liquid head as,
P zð Þ ¼PLþρLgðL−zÞ ð8Þ
where L is the length of the column, ρ is the liquid phase density assumed to be equal to the density of water, and PL is the pressure (Pa) at the top of the
col-umn, which was assumed to be atmospheric pressure. Accordingly, gaseous substrates were modeled to dis-solve more readily in the lower portion of the column. Calculation of gas and liquid volume fractions in bubble column reactors is notoriously difficult, as the volume fractions are known to depend on a number of operating parameters [29]. The effect of the gas flow rate is known to be particularly important. Therefore, we fit gas flow rate versus gas volume fraction data [32] to a simple model [33] to derive the following relationship:
εg¼εG;maxuG
KGþuG ð
9Þ
where εG, max is the maximum achievable gas volume
fraction andKGis a type of saturation constant.
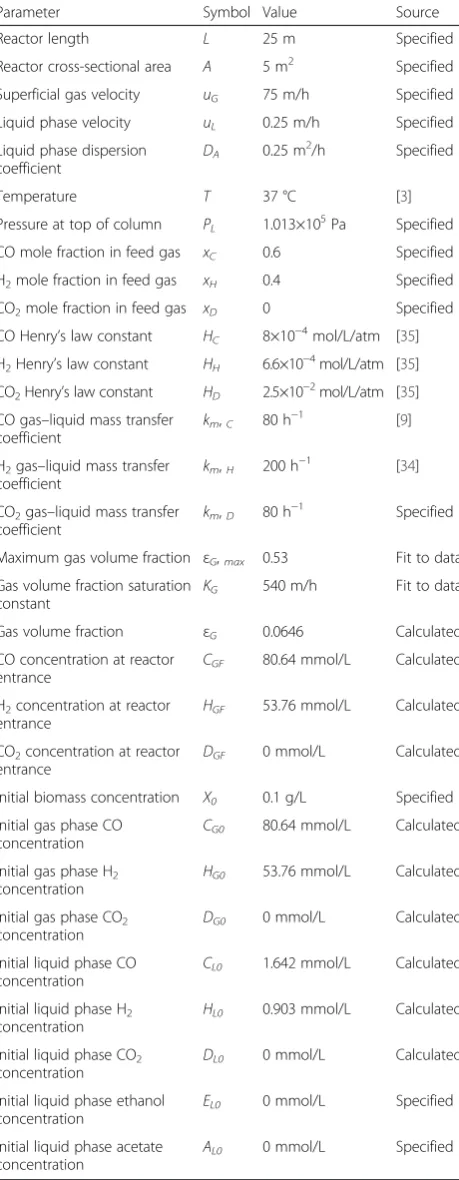
Parameter values for the bubble column reactor model were obtained from the literature to the extent possible (Tables 1 and 2). The reactor length and cross-sectional area were chosen to represent an industrial scale reactor with volume of 125,000 l and a typical length-to-diameter ratio of 10 [29]. The liquid and superficial gas velocities were chosen to achieve a liquid residence time of 100 h to maintain the gas flow in the homogeneous, bubbly regime (<5 cm/s) where dispersion effects would be small and to achieve a high gas-to-liquid velocity ra-tio of 300 [29]. A small value of the liquid phase disper-sion coefficient was specified to improve numerical stability of the model (see “Model solution”) while en-suring that the liquid flow would be convection con-trolled. A feed stream with a 1.5:1 CO:H2 ratio and
mixture [9]. A very wide range of CO gas–liquid mass transfer coefficients that differ according to the reactor configuration, gas sparging method, and agitation rate have been reported [9]. We conservatively selected the CO mass transfer coefficient to be consistent with a bubble column without microsparging and internal packing. Based on the limited literature available [34], we chose the H2gas–liquid mass transfer coefficient to
be 250 % larger than the CO value. The CO2mass
trans-fer coefficient was specified to be equal to the CO value due to lack of data. Due to the large variability asso-ciated with these parameter values, we explored the sen-sitivity of our model predictions to the mass transfer coefficients. The initial conditions were chosen to mimic a newly inoculated reactor with saturated liquid compo-sitions and no spatial gradients.
Model solution
The bubble column reactor model is consisted of a set of PDEs for multiphase transport processes with em-bedded linear programs that described intracellular me-tabolism. We spatially discretized the PDE model using third-order finite differences for the convection terms and second-order central differences for the diffusion terms. The resulting ODE system with embedded LPs was solved with DFBAlab [26], a MATLAB code specific-ally designed for large-scale dynamic FBA simulations, combined with the LP solver Gurobi and the stiff ODE solver ode15s. DFBAlab requires the specification of lexico-graphic optimization objectives to avoid the common prob-lem of non-unique exchange fluxes that render the ODE system impossible to integrate. The objectives were sequen-tially applied in the following order: (1) maximization of the growth rate, (2) maximization of the CO uptake rate, (3) maximization of the H2uptake rate, (4) minimization
of the CO2synthesis rate, (5) minimization of the acetate
synthesis rate, and (6) minimization of the ethanol synthe-sis rate. The ordering of these objectives had no effect on model predictions. We found that 100 spatial node points (900 ODEs, 600 LPs) provided a suitable compromise between solution accuracy and computation time. Add-itional details on the numerical solution procedure are available in the forthcoming publication.
Abbreviations
DFBAlab:Dynamic flux balance analysis laboratory; FBA: Flux balance analysis; LP: Linear program; ODE: Ordinary differential equation; PDE: Partial differential equation.
Competing interests
The authors declare that they have no competing interests.
Authors’contributions
JC and MAH conceived the study and developed the model. JC, JAG, KH, and PIB developed the model solution method. JC performed the simulations and analyzed the results. JC, JAG, KH, and MAH prepared the manuscript. All authors read and approved the final manuscript. Table 2Nominal parameter values for the synthesis gas bubble
column reactor
Parameter Symbol Value Source
Reactor length L 25 m Specified
Reactor cross-sectional area A 5 m2 Specified
Superficial gas velocity uG 75 m/h Specified
Liquid phase velocity uL 0.25 m/h Specified
Liquid phase dispersion coefficient
DA 0.25 m2/h Specified
Temperature T 37 °C [3]
Pressure at top of column PL 1.013×10
5
Pa Specified
CO mole fraction in feed gas xC 0.6 Specified
H2mole fraction in feed gas xH 0.4 Specified
CO2mole fraction in feed gas xD 0 Specified
CO Henry’s law constant HC 8×10−
4
mol/L/atm [35]
H2Henry’s law constant HH 6.6×10−
4
mol/L/atm [35]
CO2Henry’s law constant HD 2.5×10−
2
mol/L/atm [35]
CO gas–liquid mass transfer coefficient
km,C 80 h−
1
[9]
H2gas–liquid mass transfer
coefficient
km,H 200 h−1 [34]
CO2gas–liquid mass transfer
coefficient
km,D 80 h−
1
Specified
Maximum gas volume fraction εG,max 0.53 Fit to data
Gas volume fraction saturation constant
KG 540 m/h Fit to data
Gas volume fraction εG 0.0646 Calculated
CO concentration at reactor entrance
CGF 80.64 mmol/L Calculated
H2concentration at reactor
entrance
HGF 53.76 mmol/L Calculated
CO2concentration at reactor
entrance
DGF 0 mmol/L Calculated
Initial biomass concentration X0 0.1 g/L Specified
Initial gas phase CO concentration
CG0 80.64 mmol/L Calculated
Initial gas phase H2
concentration
HG0 53.76 mmol/L Calculated
Initial gas phase CO2
concentration
DG0 0 mmol/L Calculated
Initial liquid phase CO concentration
CL0 1.642 mmol/L Calculated
Initial liquid phase H2
concentration
HL0 0.903 mmol/L Calculated
Initial liquid phase CO2
concentration
DL0 0 mmol/L Calculated
Initial liquid phase ethanol concentration
EL0 0 mmol/L Specified
Initial liquid phase acetate concentration
AL0 0 mmol/L Specified
Acknowledgements
JC and MAH wish to acknowledge the financial support from the ReCommunity Recycling and assistance from the Harish Nagarajan (UCSD) with theC. ljungdahlii
genome-scale metabolic reconstruction.
Author details
1Department of Chemical Engineering, University of Massachusetts, Amherst,
MA 010003, USA.2Process Systems Engineering Laboratory, Department of Chemical Engineering, Massachusetts Institute of Technology, Cambridge, MA 02139, USA.
Received: 22 March 2015 Accepted: 9 June 2015
References
1. Kirkels AF, Verbong GPJ. Biomass gasification: still promising? A 30-year global overview. Renew Sust Energ Rev. 2011;15(1):471–81.
2. McKendry P. Energy production from biomass (part 3): gasification technologies. Bioresour Technol. 2002;83(1):55–63.
3. Tanner RS, Miller LM, Yang D.Clostridium ljungdahliisp. nov., an acetogenic species in clostridial rRNA homology group I. Int J Syst Bacteriol. 1993;43(2):232–6.
4. Tanner RS. Production of ethanol from synthesis gas. In: Wall J, Harwood C, Demain A, editors. Bioenergy. Washington, DC: ASM Press; 2008. p. 147–51. 5. Sim JH, Kamaruddin AH, Long WS, Najafpour G.Clostridium aceticum—a
potential organism in catalyzing carbon monoxide to acetic acid: application of response surface methodology. Enzyme Microb Technol. 2007;40(5):1234–43.
6. Genthner BRS, Bryant MP. Additional characteristics of one-carbon-compound utilization byEubacterium limosumandAcetobacterium woodii. Appl Environ Microbiol. 1987;53(3):471–6.
7. Liou JSC, Balkwill DL, Drake GR, Tanner RS.Clostridium carboxidivoranssp. nov., a solvent-producing clostridium isolated from an agricultural settling lagoon, and reclassification of the acetogenClostridium scatologenesstrain SL1 asClostridium drakeisp. nov. Int J Syst Evol Microbiol. 2005;55:2085–91. 8. Daniell J, Kopke M, Simpson SD. Commercial biomass syngas fermentation.
Energies. 2012;5(12):5372–417.
9. Munasinghe PC, Khanal SK. Biomass-derived syngas fermentation into biofuels: opportunities and challenges. Bioresour Technol. 2010;101(13):5013–22. 10. Abubackar HN, Veiga MC, Kennes C. Biological conversion of carbon
monoxide: rich syngas or waste gases to bioethanol. Biofuel Bioprod Bior. 2011;5(1):93–114.
11. Riggs SS, Heindel TJ. Measuring carbon monoxide gas–liquid mass transfer in a stirred tank reactor for syngas fermentation. Biotechnol Prog. 2006;22(3):903–6.
12. Hurst KM, Lewis RS. Carbon monoxide partial pressure effects on the metabolic process of syngas fermentation. Biochem Eng J. 2010;48(2):159–65.
13. Mohammadi M, Mohamed AR, Najafpour GD, Younesi H, Uzir MH. Kinetic studies on fermentative production of biofuel from synthesis gas using
Clostridium ljungdahlii. Sci World J. 2014;2014:910590.
14. Datar RP, Shenkman RM, Cateni BG, Huhnke RL, Lewis RS. Fermentation of biomass-generated producer gas to ethanol. Biotechnol Bioeng. 2004;86(5):587–94.
15. Henstra AM, Sipma J, Rinzema A, Stams AJM. Microbiology of synthesis gas fermentation for biofuel production. Curr Opin Biotechnol. 2007;18(3):200–6. 16. Papin JA, Price ND, Wiback SJ, Fell DA, Palsson BO. Metabolic pathways in
the post-genome era. Trends Biochem Sci. 2003;28(5):250–8. 17. Hanly TJ, Henson MA. Dynamic flux balance modeling of microbial
co-cultures for efficient batch fermentation of glucose and xylose mixtures. Biotechnol Bioeng. 2011;108(2):376–85.
18. Hjersted JL, Henson MA, Mahadevan R. Genome-scale analysis ofSaccharomyces cerevisiaemetabolism and ethanol production in fed-batch culture. Biotechnol Bioeng. 2007;97(5):1190–204.
19. Varma A, Palsson BO. Stoichiometric flux balance models quantitatively predict growth and metabolic by-product secretion in wild-typeEscherichia coliW3110. Appl Environ Microbiol. 1994;60(10):3724–31.
20. Mahadevan R, Edwards JS, Doyle FJ. Dynamic flux balance analysis of diauxic growth inEscherichia coli. Biophys J. 2002;83(3):1331–40. 21. Nagarajan H, Sahin M, Nogales J, Latif H, Lovley DR, Ebrahim A, et al.
Characterizing acetogenic metabolism using a genome-scale metabolic reconstruction ofClostridium ljungdahlii. Microb Cell Fact. 2013;12:118.
22. Younesi H, Najafpour G, Mohamed AR. Ethanol and acetate production from synthesis gas via fermentation processes using anaerobic bacterium,
Clostridium ljungdahlii. Biochem Eng J. 2005;27(2):110–9.
23. Harcombe WR, Riehl WJ, Dukovski I, Granger BR, Betts A, Lang AH, et al. Metabolic resource allocation in individual microbes determines ecosystem interactions and spatial dynamics. Cell Rep. 2014;7(4):1104–15.
24. Fang Y, Scheibe TD, Mahadevan R, Garg S, Long PE, Lovley DR. Direct coupling of a genome-scale microbial in silico model and a groundwater reactive transport model. J Contam Hydrol. 2011;122(1–4):96–103. 25. Jayasinghe N, Franks A, Nevin KP, Mahadevan R. Metabolic modeling of
spatial heterogeneity of biofilms in microbial fuel cells reveals substrate limitations in electrical current generation. Biotechnol J. 2014;9(10):1350–61. 26. Gomez JA, Höffner K, Barton PI. DFBAlab: a fast and reliable MATLAB code
for dynamic flux balance analysis. BMC Bioinformatics. 2014;15:409. 27. Gaddy JL, Arora DK, Ko CW, Philip JR, Basu R. Methods for increasing the
production of ethanol from microbial fermentation. US Patent Application 7285402 B2.
28. Munasinghe PC, Khanal SK. Syngas fermentation to biofuel: evaluation of carbon monoxide mass transfer coefficient (k (L) a) in different reactor configurations. Biotechnol Prog. 2010;26(6):1616–21.
29. Kantarci N, Borak F, Ulgen KO. Bubble column reactors. Process Biochem. 2005;40(7):2263–83.
30. Drake HL, Gossner AS, Daniel SL. Old acetogens, new light. Ann Ny Acad Sci. 2008;1125:100–28.
31. Bouaifi M, Hebrard G, Bastoul D, Roustan M. A comparative study of gas hold-up, bubble size, interfacial area and mass transfer coefficients in stirred gas–liquid reactors and bubble columns. Chem Eng Process. 2001;40(2):97–111. 32. Prakash A, Margaritis A, Li H, Bergougnou MA. Hydrodynamics and local
heat transfer measurements in a bubble column with suspension of yeast. Biochem Eng J. 2001;9(2):155–63.
33. Joshi JB, Sharma MM. Circulation cell model for bubble-columns. T I Chem Eng-Lond. 1979;57(4):244–51.
34. Bredwell MD, Srivastava P, Worden RM. Reactor design issues for synthesis-gas fermentations. Biotechnol Prog. 1999;15(5):834–44.
35. Linstrom PJ, Mallard WG. NIST Chemistry WebBook, NIST standard reference database number 69. Gaithersburg MD: National Institute of Standards and Technology; 2015.
Submit your next manuscript to BioMed Central and take full advantage of:
• Convenient online submission
• Thorough peer review
• No space constraints or color figure charges
• Immediate publication on acceptance
• Inclusion in PubMed, CAS, Scopus and Google Scholar
• Research which is freely available for redistribution