VOLUME 40, ARTICLE 9, PAGES 219
,
260
PUBLISHED 29 JANUARY 2019
https://www.demographic-research.org/Volumes/Vol40/9/ DOI: 10.4054/DemRes.2019.40.9
Research Article
Improving age measurement in low- and
middle-income countries through computer vision:
A test in Senegal
Stéphane Helleringer
Chong You
Laurence Fleury
Laetitia Douillot
Insa Diouf
Cheikh Tidiane Ndiaye
Valerie Delaunay
Rene Vidal
© 2019 Stéphane Helleringer et al.
This open-access work is published under the terms of the Creative Commons Attribution 3.0 Germany (CC BY 3.0 DE), which permits use, reproduction, and distribution in any medium, provided the original author(s) and source are given credit.
1 Introduction 220
2 Background 221
2.1 Age misreporting in demographic studies 221
2.2 A computer vision approach to age estimation 225
2.3 Machine learning 226
3 Data and methods 227
3.1 Constitution of the training dataset 227
3.2 Descriptive analyses 229
3.3 Feature extraction 230
3.4 Model development 231
3.4.1 Age classification 231
3.4.2 Age estimation 232
3.5 Model validation 233
3.6 Multivariate analyses and robustness tests 233
4 Results 234
5 Comparison between AAE estimates and self-reported age data 242
6 Discussion 243
7 Acknowledgements 246
References 247
Improving age measurement in low- and middle-income countries
through computer vision: A test in Senegal
Stéphane Helleringer1
Chong You2 Laurence Fleury3
Laetitia Douillot4
Insa Diouf4
Cheikh Tidiane Ndiaye5 Valerie Delaunay3
Rene Vidal2
Abstract
BACKGROUNDAge misreporting is pervasive in most low- and middle-income countries (LMIC). It may bias estimates of key demographic indicators, such as those required to track progress towards sustainable development goals. Existing methods to improve age data are often ineffective, cannot be adopted on a large scale, and/or do not permit estimating age over the entire life course.
OBJECTIVE
We tested a computer vision approach, which produces an age estimate by analyzing a photograph of an individual’s face.
METHODS
We constituted a small training dataset in a population of Senegal covered by a health and demographic surveillance system (HDSS) since 1962. We collected facial images of 353 women aged 18 and above, whose age could be ascertained precisely using HDSS data. We developed automatic age estimation (AAE) systems through machine learning and cross-validation.
1 Johns Hopkins University, Bloomberg School of Public Health, Baltimore, USA. Email:[email protected]. 2 Johns Hopkins University, Department of Biomedical Engineering, Baltimore, USA
3 Laboratoire Population, Environnement et Développement, Institut de Recherche pour le Développement; Aix–Marseille Université, Dakar, Senegal.
4 VITROME, Institut de Recherche pour le Développement, Assistance Publique – Hopitaux de Marseille, Service de Santé des Armées, Aix–Marseille Université, Dakar, Senegal.
RESULTS
AAE was highly accurate in distinguishing women of reproductive age from women aged 50 and older (area under the curve > 0.95). It allowed estimating age in completed years, with a level of precision comparable to those obtained in European or East Asian populations with training datasets of similar sizes (mean absolute error = 4.62 years).
CONCLUSION
Computer vision might help improve age ascertainment in demographic datasets collected in LMICs. Further improving the accuracy of this approach will require constituting larger and more complete training datasets in additional LMIC populations.
CONTRIBUTION
Our work highlights the potential benefits of widely used computer science tools for improving demographic measurement in LMIC settings with deficient data.
1. Introduction
The age of individuals is a key input in the calculation of demographic indicators. It is also often included as a control variable in multivariate analyses of various outcomes of interest. Eliciting age is thus one of the first steps in demographic studies. It entails asking respondents to report their own age at last birthday and/or their date of birth (‘self-reporting’), or to state the age of close relatives (‘proxy reporting’). The data these questions generate may imply an age that differs from the true age of a person. Such age misreporting confounds the measurement of demographic indicators by shifting individuals from younger to older age groups, and vice-versa (Ewbank 1981). The net effects of these age transfers are hard to predict, since they depend on (1) the direction and magnitude of age errors, and (2) the shape of the underlying ‘true’ age pyramid (Preston and Elo 1999).
Most strategies to improve age data in demographic studies have focused on either verifying the age of participants through linkages with other records of an individual’s date of birth (e.g., Elo et al. 2013), or better training interviewers in eliciting age (Pullum 2006). The former strategy is, however, seldom feasible in LMICs, where independent records of age (e.g., early-life census records) are rarely available. The latter strategy has been implemented during the Demographic and Health Surveys (DHS) and other large-scale surveys in LMICs, but it has not prompted systematic improvements in the quality of age data (Pullum and Staveteig 2017).
coverage of birth registration and expand educational opportunities (AbouZahr et al. 2015; Mikkelsen et al. 2015). These initiatives, however, are focused on current and forthcoming birth cohorts: they will not help address issues of age misreporting among older age groups. In addition, these initiatives might take a long time to reach full coverage, and are subject to reversals. For example, educational expansion was temporarily halted in a number of LMICs during the 1990s (Eloundou-Enyegue and Davanzo 2003). New approaches to estimating age are thus needed that will help obtain more accurate age data in LMICs in the short to medium term, while the distal determinants of age misreporting are being addressed. This is particularly the case because several indicators selected to track achievement of the United Nations’ sustainable development goals (SDGs) by 2030 are age-specific rates, which require precise data on age of population members for their calculation (GBD SDG Collaborators 2017).
We report an initial test of a computer vision6 approach to measuring age in
LMICs. Rather than relying on respondents’ reports, it produces an age estimate by analyzing a photograph of an individual’s face using tools developed in computer science (e.g., Geng, Zhou, and Smith-Miles 2007). This approach is now incorporated into a growing number of applications in online advertising, security systems, and other fields of human-computer interaction, but it has not been used to improve age data in demographic studies in LMICs.
2. Background
2.1 Age misreporting in demographic studies
In high-income countries (HICs), age misreporting affects primarily the oldest ages (Elo et al. 2013) and/or the most disadvantaged groups. The reported age of centenarians has thus often been contested (Gessert, Elliott, and Haller 2002; Rosenwaike and Stone 2003). In the United States the age of older African-Americans reported on death certificates has been inaccurate (Preston et al. 1996), and the age reported by recent Hispanic immigrants may be erroneous (Elo et al. 2004). Some of these errors have led to spurious ‘mortality crossovers,’ and other apparent paradoxes in demographic studies.
In HICs, such issues with the quality of age data have been resolved through record linkages (Elo et al. 2013). For some study participants, researchers seek to obtain independent, high-quality records of age for verification purposes. In US studies, records from the 1900 or 1910 censuses have been used to confirm the ages of older individuals (Preston et al. 1996), whereas records of the social security administration have been used to evaluate the reported ages of recent immigrants (Elo et al. 2004; Turra and Elo 2008). On the basis of these comparisons between estimates, correction factors can be developed that permit recovering unbiased age distributions (Elo and Preston 1994).
In many LMICs, age misreporting is more severe and it is pervasive throughout the life cycle (Caldwell 1966; Caldwell and Igun 1971). It may consist of missing data in age and/or date of birth. Most recent surveys and censuses have, however, emphasized completeness of information, so that missing data is now increasingly rare (Pullum and Staveteig 2017). Age data in LMICs still often suffers from severe heaping, i.e., a tendency to record ages in multiples of 5 (Figure 1) and may be affected by systematic under- or over-statement. For example, the ages of young children are often exaggerated (Pullum 2006), as are the ages of women 15–29 years old in African countries (Ewbank 1981).
Figure 1: Age distribution in the 2012 Demographic and Health Survey conducted in Niger
Age misreporting occurs in LMICs in part because of limited birth registration (Mikkelsen et al. 2015) and/or low numeracy (A’Hearn, Baten, and Crayen 2009). Study participants may initially report not knowing their own age or the age of their relatives. To avoid blank fields in survey or census datasets, interviewers then use limited information about time since marriage,7 or the number of children a woman has
ever had,8 to estimate the plausible age of a respondent (Ewbank 1981). This inference
process leads to errors, and exposes a number of demographic analyses (e.g., fertility, nuptiality) to the risk of endogeneity bias. In our experience it is also a time-consuming process, which may become frustrating for both interviewers and respondents. It might even establish a negative rapport between them, thus jeopardizing the rest of the interview and the accuracy of data collected on other topics.
In addition, age misreporting emerges because interviewers, in order to reduce their workload, sometimes purposefully misstate the age of participants. This may happen when long sections of a questionnaire are only applicable for specific age groups. For example, DHS interviewers may exaggerate the age of young children so that they can ‘skip’ the questions on child health that concern children 0–4 years old (Pullum and Becker 2014). These interviewer practices lead to transfers across age boundaries (Pullum and Staveteig 2017; Pullum 2006; Pullum and Becker 2014). They may result in significant distortions of the age pyramid. They may also bias demographic estimates, if the individuals whose age is shifted are more likely to have experienced an event of interest than the rest of the population.
Contrary to HICs, verifying individual age through record linkages is rarely feasible in LMICs9 because there are few alternate, high-quality sources of age
estimates. In most LMIC settings, birth registration is low and/or delayed (Mikkelsen et al. 2015), so that it yields only imprecise records of dates of birth. Census records are also likely incomplete and/or inaccurate and may not be available at the individual level in LMICs.
Demographic studies in LMICs thus either ignore age misreporting or use 5-year age groups to ‘hide’ some of the irregularities of the age pyramid. The use of 5-year age groups, however, assumes that heaping originates solely from individuals rounding down their age to the closest multiple of 5. Instances where individuals may round up
7 For example, a woman may only know that she married her husbandn years ago but not know her own age. An interviewer may estimate her age by addingn years to the age at which he/she believes women typically get married in the area (e.g., age = 18 +n).
8 A woman may not know her exact age but may know the age of her first born and the number of children she has ever had. In that case, interviewers may form an age estimate as age of first-born + (number of children times average length of birth interval according to their local knowledge).
their age or larger transfers across more distant age groups are not properly handled. A few studies have used smoothing procedures to obtain more regular age distributions (e.g., Bendavid, Seligman, and Kubo 2011), but in doing so they assume that age is not systematically over- or under-estimated.
Efforts to improve the accuracy of age data have focused on improving interviewer training, and/or designing questionnaires that facilitate the reporting of age. The DHS program has developed a decision chart to help interviewers ascertain respondents’ age. It has also promoted household revisits and daily supervision to ensure that interviewers do not systematically misreport age to reduce their workload (Pullum and Staveteig 2017). Many surveys also use calendars of historical events (Ewbank 1981): These are lists of precisely dated events that respondents are likely to know, and that may serve as ‘anchors’ for the reporting of dates and ages. For example, calendars may contain the dates of a country’s independence, recent elections, or climatic events like droughts or floods. Then, if a respondent reports that “he/she was born 2 years after independence,” the interviewer can confidently estimate his/her age with the calendar. Despite the widespread adoption of these techniques, age data in LMIC surveys and censuses has only marginally improved over the past 30 years (Pullum and Staveteig 2017; Randall and Coast 2016).
Other techniques of age ascertainment exist, but most cannot be adopted on a large scale. Some methods are time-intensive. The ranking approach developed by anthropologists and demographers (e.g., Pison 1980) requires first determining who is older than whom in a population (e.g., on the basis of participation in circumcision rituals). Then this ranking can be anchored to an event whose date is known (e.g., independence), and the ages of all population members can be deduced. Such detailed investigations cannot be integrated into the protocols of most surveys and censuses, which only spend a few days in a local community on average. Furthermore, with intensified internal migration within LMICs (Bell et al. 2015), it may no longer be possible to confidently rank all inhabitants of local communities by age.
2.2 A computer vision approach to age estimation
A new tool for age measurement is thus needed that a) only requires minimal equipment, b) produces estimates of age throughout the entire life span, and c) cannot be altered by interviewers seeking to reduce their workload. Computer vision methods (e.g., Geng, Zhou, and Smith-Miles 2007) fit that bill: they produce age estimates for individuals of all ages, on the sole basis of a photograph. Since an increasing number of surveys and censuses in LMICs are conducted on camera-enabled mobile devices (Paudel et al. 2013), they could be incorporated in a large number of demographic studies. Finally, they obtain age estimates automatically, through the analysis of images, without requiring interviewer input.
AAE builds on a detailed understanding of the effects of age on facial appearance. Despite individual heterogeneity in the rate of facial aging (due to genetic factors, environmental exposure, or behaviors such as smoking), the human face undergoes typical transformations over the life course (Albert, Ricanek, Jr., and Patterson 2007). During childhood and adolescence the shape of the face changes. As an individual’s head grows, the size of his/her face gets larger, the shape of specific components (e.g., forehead, nose) is altered, and the distribution of these components within the face is modified. For example, the forehead slopes back and the chin may become more protrusive. Throughout adulthood, most facial changes are skin-related. The skin becomes less elastic, wrinkles and folds become more distinct, and freckles/blemishes appear. These changes in skin texture may lead to the sagging of the skin in areas such as the chin, cheeks, or under the eyes. The shape of the face still changes during adulthood and old age: in particular, deterioration of the bone structure may alter the size or distribution of facial components (Albert, Ricanek Jr., and Patterson 2007).
2.3 Machine learning
Developing an AAE computer vision system requires quantifying how the traits of an individual’s face are related to his/her true age (Geng, Yin, and Zhou 2013). This is accomplished through machine learning, i.e., a field of study that “seeks to develop computer systems that automatically improve their performance through experience” (Michalski, Carbonell, and Mitchell 2013; Mitchell et al. 1990). Machine learning entails collecting data on a particular problem, then using these ‘training’ data sets to allow a computer system to solve this problem autonomously. In demography, machine learning has been primarily used to build highly predictive multivariate models of an outcome of interest, particularly in situations where out-of-sample predictions are needed and the relations between variables may be complex (e.g., Luo et al. 2015; Ng et al. 2014). In such studies, analysts first specify the functional form of the model to be developed (e.g., a linear regression), and then use machine-learning methods to select the most predictive model among a large number of candidate models. Machine learning methods often used for this purpose include, for example, random forest, support vector machines, Gaussian process regression, or lasso (Mullainathan and Spiess 2017; Rasmussen 2004).
Machine learning has also been used to develop computer systems capable of performing tasks such as spam filtering, facial or speech recognition, and language translation, among others. To do so, the available input data (e.g., an email or a photograph) must be transformed into ‘features,’ i.e., numerical variables that characterize the object of interest. Features of an email may, for example, include the number of times it contains specific words, and/or the number of recipients in address fields. Then, the computer system must discover a mathematical function or model that closely relates these features to the outcome of interest (e.g., whether an email is spam). Finally, once this function has been learned, it can be used to predict the outcome of interest for any object for which input data is available.
The modalities through which this model is learned depend on the available training dataset. Sometimes a researcher may have at his/her disposal a dataset that includes the true value of the outcome(s) of interest. In such “supervised” settings (Hastie, Tibshirani, and Friedman 2009) the computer system can learn from concrete examples, by finely characterizing differences in features between objects with different outcomes. In “unsupervised” settings (Weber, Welling, and Perona 2000) the correct outcome of interest is unknown, but observing systematic correlations between features may help discover the function of interest.
predict age within approximately 4 to 5 years of its true value (Panis and Lanitis 2014). Recent additional progress in AAE has been prompted by the availability of larger training datasets, which include tens of thousands of photographs (Eidinger, Enbar, and Hassner 2014; Ricanek Jr. and Tesafaye 2006). Using these data, state-of-the-art AAE systems now obtain age estimates within 2 years of the true value (Ranjan et al. 2017).
Unfortunately, FG-NET and other available training datasets include mostly subjects of European or East Asian descent (Han, Otto, and Jain 2013). Existing attempts to use AAE to predict ages of other populations, in particular those of African descent, on the basis of these training sets have yielded poor results (Guo and Zhang 2014). More diverse training datasets exist (Ricanek Jr. and Tesafaye 2006), but they have been collected exclusively in HICs. The individuals of African descent they include may present facial aging patterns that are not comparable to those prevalent in LMICs (e.g., because of better nutrition, or different patterns of smoking and other risk behaviors). To develop AAE systems to measure age in African LMICs, new training datasets must be collected in African countries.
3. Data and methods
We collected a training dataset of the facial images of several hundred women in Senegal, West Africa. We then used this data to train two AAE systems. Finally, we evaluated the accuracy of these systems using cross-validation procedures, and we compared them to self-reported age data from the same population. Institutional Review Boards in the United States (Johns Hopkins University School of Public Health) and in Senegal (Comité National d’Ethique pour la Recherche en Santé, Ministry of Health) reviewed and approved all the procedures described below. In addition, the committee for the protection of personal data (CDP) in Senegal also reviewed and approved the protocol for photographic data collection, archiving, and transfer.
3.1 Constitution of the training dataset
study because it has been running almost continuously since 1962.10 It thus provides
high-quality age data for individuals up to 53 years old and allows precisely classifying women as being of reproductive age or older.
We identified all women aged 18 and above who were born between two HDSS household visits. The exact age of that subset of HDSS residents is known with a high degree of precision (a few months at most). We also identified women who were already born in 1962, at the time of the first census conducted by the Niakhar HDSS. We do not know their exact age with similar precision, but we can be confident that they were at least 53 years old in 2015, and thus were beyond reproductive age.
Data collection included a short questionnaire about the sociodemographic characteristics of participants, their parity, and their health status. We also gathered additional information (e.g., place of birth, name of mother and possibly spouse) to verify that the respondent was the correct person. Finally, we offered each participant to be photographed. We used open data kit for data collection (ODK,
http://opendatakit.org). ODK is an open-source data collection software, which runs on Android platforms. ODK allows collecting basic interview data, as well as acquiring and storing multimedia objects (e.g., photographs). We used mobile phones (Motorola Moto G 3rd Generation) equipped with a 13 Mega-Pixel main camera to conduct all data
collection activities. These had a value of approximately 100 US dollars at the time of the study.
Two female fieldworkers were trained for two days in the study procedures. Half a day was devoted to informed consent, as well as the collection of sociodemographic data. The rest of the training was devoted to photographic data collection. It covered basic features of the camera, procedures related to the capture of photographs within ODK, and steps to follow if a photograph must be deleted or recaptured. We also covered issues related to poses, angles, lighting, and framing. Finally, we conducted a one-day pilot during which interviewers practiced all data collection procedures in real-life conditions.
We collected up to four photographs per individual, depending on whether the participant was wearing a headscarf at the time of the interview. In Senegal, as in other LMICs, women occasionally wear headscarves for a variety of reasons (e.g., aesthetic, religious). This may affect AAE implementation because headscarves can cover parts of the face used for age inference (e.g., the forehead). Headscarves may also pull the skin backwards, thus affecting skin texture. Since (some) women may be reluctant to remove their headscarf to be photographed, we developed a protocol that would allow assessing the effects of wearing a headscarf on AAE accuracy.
For those not wearing headscarves, we captured three photographs: one portrait, and two side photographs.11 For the portrait, participants were instructed to keep their
head straight and to look directly at the camera, without smiling. For women wearing a headscarf, we captured three photographs with the headscarf (portrait + sides). Then we asked to take one additional portrait, after having removed the headscarf. We used no photographic filters, and fieldworkers were instructed not to use the zoom feature of their phones to frame photographs. To standardize the background of photographs across respondents, we used a piece of gray cloth purchased at a local market. Once collected, the photographs and interview data were encrypted by ODK to ensure that such data were protected on the mobile devices used for data collection. Investigators in Niakhar then prepared data files from which participants’ names and addresses were removed. Finally, these files (including photographs) were transferred to Johns Hopkins University for analysis. All files were transferred using FTPS protocols, to ensure heightened security of the transfer process.
3.2 Descriptive analyses
Participants were women who agreed to be photographed. The main analytical sample was constituted of participants for whom a portrait without a headscarf was available. A robustness test also considered the subset of participants who were photographed both with and without headscarf. The remaining participants only consented to being photographed while wearing their headscarf. They are excluded from the analyses presented in this paper. We measured differences in participation outcomes by age (as measured by the HDSS). Then we compared the characteristics of participants photographed with and without a headscarf. Finally, among the main analytical sample, we compared the characteristics of women of reproductive age and women aged 50 and older.
The sociodemographic characteristics of a participant included binary variables describing her schooling (never been to school vs. some schooling) and religion (Muslim vs. Christian/other), and a categorical variable describing her parity (no birth vs. 1–3 births vs. 4–6 births vs. 7+ births). Health-related characteristics included self-reported health (good or very good vs. average vs. poor or very poor); and binary variables indicating whether she suffered from a chronic condition, a handicap or other functional limitations, and whether she had ever smoked or drank alcohol. Finally, we included a binary variable describing sun exposure (at least 3 hours per day vs. less than
3 hours per day in the sun). We used tests to detect differences in the distribution of these variables between the groups of women described above.
3.3 Feature extraction
The images we collected included varying amounts of background, which needed to be removed prior to analysis. To zoom in on the face area we used a face detector (Sun, Wang, and Tang 2013). This generated a preliminary rectangle-shaped bounding box around the face in each image. We extended each bounding box by an additional 10% of their width/height to ensure that faces were not truncated.12 Finally, we cropped the photograph along the edges of the bounding box.
Using each cropped image as input, we sought to obtain a number of features that permit assessing where each individual stands in the facial aging process. To compute such features, early AAE applications required manually marking facial components (e.g., chin, nose) on each photograph prior to analysis. This approach is, however, time-consuming and may not be readily incorporated in large-scale surveys and censuses. Instead, we used face recognition tools (Tolba, El-Baz, and El-Harby 2006) that allow rapidly generating high-dimensional numerical representations of any facial image, so that the same person can be reliably identified across multiple images or video captures in real-time. Specifically, we applied a convolutional neural network (CNN13) to the bounding boxes described above. We used the VGG-Face (Parkhi, Vedaldi, and Zisserman 2015), a widely used CNN that has been pre-trained on a dataset of close to a million facial images.14 It has high predictive value in identifying an individual across multiple images and video captures. It has also been used for improving age estimation (Qawaqneh, Mallouh, and Barkana 2017). For our purposes, the VGG-Face CNN yielded 4,096 features describing the characteristics of each facial image.
12 Inflation was necessary because the face detector was trained on another dataset, which may not reflect some of the conditions we encountered in Senegal (e.g., luminosity). Our results are, however, robust to alternative approaches to extending the bounding boxes.
13 A CNN, as described, for example, by LeCun, Bengio, and Hinton (2015), is a mathematical tool that emulates the ways in which the brain recognizes objects. It is made of multiple layers resulting from the application of a series of filters. These filters permit detecting basic shapes (e.g., a curve) as well as more complex shapes that compose the object of interest. Ultimately, CNNs produce fully connected layers that are similar to the network of activated neurons that occurs in the brain upon recognition of a particular object. The output of this layer is the description of the image we use as input for AAE.
3.4 Model development
In this paper, our primary goal was to solve an age classification problem, i.e., to distinguish between women aged 50 and older and women of reproductive age (15–49 years). This is an important problem in demographic research in LMICs because 50 years old is commonly used as a boundary to determine inclusion in demographic surveys. The DHS and other surveys focus on women aged 15–49 years to measure fertility and reproductive health (Corsi et al. 2012), whereas surveys of aging focus on individuals aged 50 and older (Boerma 2010; Chatterji 2013). In all these studies, some women who should be eligible are transferred to the other side of the boundary due to age misreporting and are thus excluded (Pullum and Staveteig 2017). This may confound survey estimates if the individuals who become ineligible differ systematically from the rest of the eligible population. We also report an attempt to estimate the age of each study participant in single years (‘age estimation’), but our training dataset presented limitations for developing such an AAE system (see below). In particular, it was (very) small compared to datasets used to train state-of-the art AAE systems.
3.4.1 Age classification
We used a linear support vector machine (SVM) to develop an AAE system that classifies women as being of reproductive age or older. An SVM is a supervised learning method (Burges 1998; Suykens and Vandewalle 1999). Let , … be the feature vectors corresponding to each of the N images in the training set. Let , … be the corresponding age outcomes such that = 1 if the image represents a woman whose age is ≥ 50 and = −1 otherwise. In the training phase, the SVM learns a decision boundary that separates cases from the two groups as widely as possible. This boundary is a hyperplane parameterized by and , i.e., + = 0, where (a vector of length 4,096) is the normal vector to the hyperplane, and is a scalar. This boundary should satisfy ∙ ( + ) ≥ 1 for all = 1, … , . It is obtained by solving the following optimization problem:
min , | | ∙ + ≥ 1, j = 1, … , N. (1)
We used the software package LIBSVM (Chang and Lin 2011) to train the SVM and generate a probabilistic estimate of the likelihood of membership in the older age group. This ‘SVM score’ builds on the observation that larger values of + imply a higher confidence that the age outcome is 1, and vice-versa. For an image with features :
= ∙ (2)
where and are scalars estimated from the training data. The score defined in (2) lies between 0 and 1.
3.4.2 Age estimation
To estimate age in completed years using AAE, let , … be again the feature vectors corresponding to theN images in the training set, but in this case , … are the corresponding true ages (in single years) of the individuals these images represent. We trained an age estimation model using linear regression:
min, ∑ ( + − ) + , (3)
where is a column vector of dimension 4,096, is a scalar, and is a parameter with
> 0. Once the parameters and have been learned, the age of a personj can be estimated from a feature vector , extracted from an image, as + .
We do not know precisely the age in completed years of women born before 1962. Nonetheless, these individuals convey valuable information when trying to learn an age determination function: they provide examples of facial features in individuals who are older than a certain age (i.e., 53 years old). We used the following weighted linear regression model to incorporate this information:
min, ∑ ( + − ) + . (4)
In equation (4), = 1 for images with true age below or equal to 53, and =
estimator but we limit their weight to reflect uncertainty associated with their age. We selected the( ; ) pair, which yielded the most accurate estimates of age (Figure A-1).
3.5 Model validation
We used leave-one-out cross-validation procedures (Bühlmann et al. 2016) to evaluate the accuracy of AAE models. We conducted a series of N experiments in which we used one of theNimages as a ‘test image,’ and the remainingN-1 images as the training set. The average SVM score/estimation error for an imagei is then computed across all
Nexperiments.15
For the age classification problem, we applied a varying threshold (from 0 to 1) on the SVM score: Above that score a woman was classified as being 50 and older. We plotted the true positive rate (i.e., sensitivity) against the false positive rate (i.e., 1 – specificity) for each threshold, thus constructing a ROC curve. We calculated the area under the curve (AUC) to evaluate the accuracy of the AAE model. For age estimation, we calculated the extent of bias in the estimation of age (i.e., the mean of the differences between true age and AAE-estimated age), and the mean absolute error (MAE, i.e., the mean of the absolute values of the differences between true age and AAE-estimated age).
3.6 Multivariate analyses and robustness tests
To better understand the properties of these AAE systems, we investigated the characteristics of women for whom we (likely) made a classification or an age estimation error. We used logistic regressions adjusted for age (as measured by HDSS) and village of residence, to identify the correlates of (1) being attributed a high SVM score among women of reproductive age, and (2) making a large error in age estimation. A high SVM score among women of reproductive age was defined as a score of or above 0.12, which corresponds to the fifth percentile of the distribution of SVM scores among women aged 50 and older.16 A large AAE error was defined as an
error equal to or greater than 7 years in absolute value. This corresponds to the 75th
15 For the age estimation models we only evaluate accuracy among the 284 participants for whom we have precise age data, i.e., those aged 18–53 years old. The images of older participants are only used to learn the age determination function as described in equation (4).
percentile of the distribution of errors in absolute value.17 The variables we included in
those models were the same that we used to explore sample selectivity. Standard errors were adjusted for the clustering of observations within compounds.
Finally, we investigated the effects of wearing a headscarf on AAE estimates. These analyses focused on the subset of participants photographed with and without headscarf. We trained an age estimation model on images captured without headscarves, before training another model on images with headscarves. The difference between the MAEs of these models represents the effects of headscarves on AAE accuracy. We also investigated the correlation in age estimates generated by the two AAE models.
4. Results
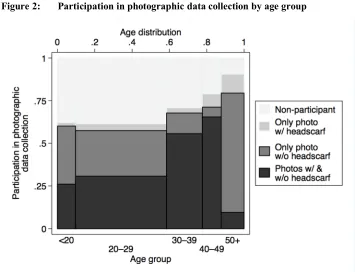
We selected 515 women, and 353 (68.5%) participated in data collection. Among participants, 25 (7.1%) only agreed to be photographed with their headscarf, but 185 agreed to be photographed both with and without headscarf (52.4%). Participation varied with age, as measured by the HDSS: it was lowest among women under 30, and highest among women 50 and older (Figure 2). Women in older age groups more frequently agreed to be photographed only with a headscarf: This was the case for 12.3% of women aged 50 and older, vs. 3.2% of women below age 20. The differences between women photographed with and without a headscarf are summarized in Table A-1.
Figure 2: Participation in photographic data collection by age group
Notes: The width of the bar representing each age group is proportional to the number of women selected in that age group. Participants are all women who were photographed during the study; they thus include women for whom we have a photo without headscarf, a photo with headscarf, or both. The analytical sample on which we tested the AAE approach, however, only includes women for whom we had a photograph without headscarf. It is represented by the thicker bar outlines. Age groups were constituted on the basis of HDSS data.
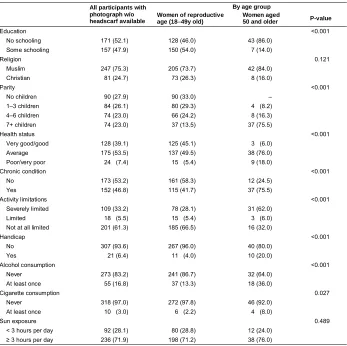
Table 1: Characteristics of study participants, by age group
All participants with photograph w/o headscarf available
By age group Women of reproductive
age (18–49y old)
Women aged
50 and older P-value
Education <0.001
No schooling 171 (52.1) 128 (46.0) 43 (86.0)
Some schooling 157 (47.9) 150 (54.0) 7 (14.0)
Religion 0.121
Muslim 247 (75.3) 205 (73.7) 42 (84.0)
Christian 81 (24.7) 73 (26.3) 8 (16.0)
Parity <0.001
No children 90 (27.9) 90 (33.0) –
1–3 children 84 (26.1) 80 (29.3) 4 (8.2)
4–6 children 74 (23.0) 66 (24.2) 8 (16.3)
7+ children 74 (23.0) 37 (13.5) 37 (75.5)
Health status <0.001
Very good/good 128 (39.1) 125 (45.1) 3 (6.0)
Average 175 (53.5) 137 (49.5) 38 (76.0)
Poor/very poor 24 (7.4) 15 (5.4) 9 (18.0)
Chronic condition <0.001
No 173 (53.2) 161 (58.3) 12 (24.5)
Yes 152 (46.8) 115 (41.7) 37 (75.5)
Activity limitations <0.001
Severely limited 109 (33.2) 78 (28.1) 31 (62.0)
Limited 18 (5.5) 15 (5.4) 3 (6.0)
Not at all limited 201 (61.3) 185 (66.5) 16 (32.0)
Handicap <0.001
No 307 (93.6) 267 (96.0) 40 (80.0)
Yes 21 (6.4) 11 (4.0) 10 (20.0)
Alcohol consumption <0.001
Never 273 (83.2) 241 (86.7) 32 (64.0)
At least once 55 (16.8) 37 (13.3) 18 (36.0)
Cigarette consumption 0.027
Never 318 (97.0) 272 (97.8) 46 (92.0)
At least once 10 (3.0) 6 (2.2) 4 (8.0)
Sun exposure 0.489
< 3 hours per day 92 (28.1) 80 (28.8) 12 (24.0)
≥ 3 hours per day 236 (71.9) 198 (71.2) 38 (76.0)
Notes: Data on participants’ characteristics were collected using ODK during the study, prior to photographic data collection. Figures in parentheses are column percentages. The p-values were calculated using a chi-square test of the independence between categorical variables.
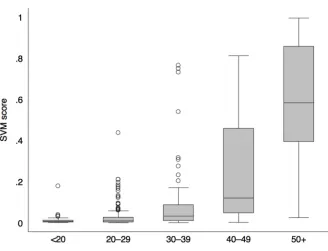
Figure 3: Probability of being classified as aged 50 and older according to the SVM analysis
Notes: The box plots represent the median, inter-quartile range and 1st and 99th percentile of the SVM score. Empty circles are
outliers. Nonparametric tests indicated that the distributions of SVM scores differed significantly across age groups.
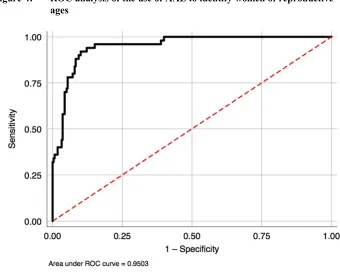
Figure 4: ROC analysis of the use of AAE to identify women of reproductive ages
Notes: Sensitivity on the y-axis represents the true positive rate, whereas 1– specificity on the x-axis represents the false positive rate. The dotted line represents situations where those two rates are equal, i.e., a test that does not discriminate between cases and non-cases. The thick black line, on the other hand, represents the ROC curve, i.e., the diagnostic accuracy of AAE for different thresholds imposed on the SVM scores. The further away the thick line is from the dotted red line, the more accurate the test in identifying women of reproductive age. The area under the ROC curve is a summary measure of the accuracy of AAE in identifying women of reproductive age. Specifically, if we were to select one woman of reproductive age and one woman above age 50 at random, then AAE would correctly ‘guess’ who is the woman of reproductive age 95.03% of the time (i.e., she would receive a lower SVM score).
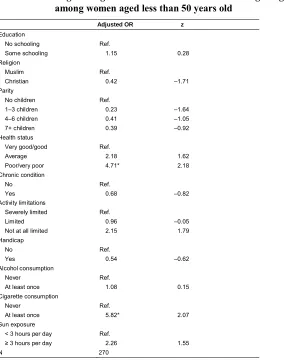
Table 2: Logistic regression of the likelihood of obtaining a high SVM score, among women aged less than 50 years old
Adjusted OR z
Education
No schooling Ref.
Some schooling 1.15 0.28
Religion
Muslim Ref.
Christian 0.42 –1.71
Parity
No children Ref.
1–3 children 0.23 –1.64
4–6 children 0.41 –1.05
7+ children 0.39 –0.92
Health status
Very good/good Ref.
Average 2.18 1.62
Poor/very poor 4.71* 2.18
Chronic condition
No Ref.
Yes 0.68 –0.82
Activity limitations
Severely limited Ref.
Limited 0.96 –0.05
Not at all limited 2.15 1.79
Handicap
No Ref.
Yes 0.54 –0.62
Alcohol consumption
Never Ref.
At least once 1.08 0.15
Cigarette consumption
Never Ref.
At least once 5.82* 2.07
Sun exposure
< 3 hours per day Ref.
≥ 3 hours per day 2.26 1.55
N 270
Notes: The dependent variable was a binary variable taking value 1 if the woman received a SVM score higher than the 5th percentile
of the distribution of SVM scores for women aged 50 and above (i.e., 0.12), and 0 otherwise. OR – Odds ratio; z = z-statistic. The ORs were also adjusted for age (as measured by the HDSS) and village of residence. The standard errors were adjusted for the clustering of observations within compounds. *** p<0.001, **p<0.01, *p<0.05.
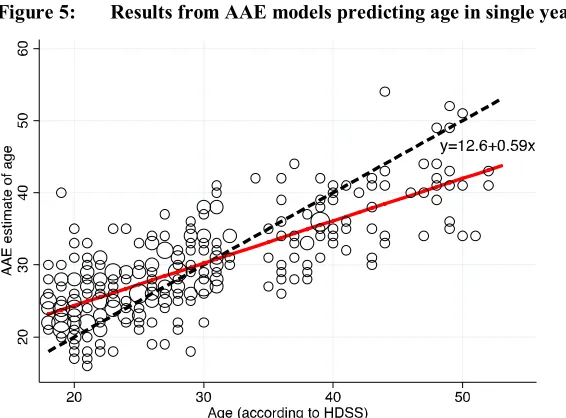
overestimated the age of the youngest study participants (<30 years) but underestimated the age of the older participants (30 and above).
Figure 5: Results from AAE models predicting age in single years
Notes: The size of the dots is proportional to the number of cases with that combination of AAE-estimated age and true age. The dotted black line represents equality between true and AAE-estimated age. The red line represents the fitted values from a linear regression with the AAE estimate as the dependent variable and the true age as the sole dependent variable.
Table 3: Logistic regression of the likelihood of a large AAE error
Adjusted OR z
Education
No schooling Ref.
Some schooling 1.01 0.03
Religion
Muslim Ref.
Christian 1.67 1.45
Parity
No children Ref.
1–3 children 0.40 –1.71
4–6 children 0.42 –1.39
7+ children 0.34 –1.41
Health status
Very good/good Ref.
Average 1.17 0.46
Poor/very poor 2.38 1.24
Chronic condition
No Ref.
Yes 0.64 –1.27
Activity limitations
Severely limited Ref.
Limited 1.39 0.54
Not at all limited 0.91 –0.28
Handicap
No Ref.
Yes 0.70 –0.51
Alcohol consumption
Never Ref.
At least once 0.75 –0.68
Cigarette consumption
Never Ref.
At least once 1.85 0.58
Sun exposure
< 3 hours per day Ref.
≥ 3 hours per day 2.72** 2.59
N 276
Notes: These analyses were conducted among women aged 18–53 years old for whom a portrait without headscarf was available. The dependent was a binary variable taking value 1 if the absolute value of the difference between the true age and the AAE estimate was greater than or equal to 7 years, and 0 otherwise. OR – Odds ratio; z = z-statistic. The ORs were also adjusted for age (as measured by the HDSS) and village of residence. The standard errors were adjusted for the clustering of observations within compounds. *** p<0.001, **p<0.01, *p<0.05.
0.86. The joint distribution of AAE errors obtained from the two sets of training photographs is shown in Figure A-2.
5. Comparison between AAE estimates and self-reported age data
We compared AAE estimates to the self-reports (SR) of age obtained from study participants. In Niakhar, however, this comparison likely under-estimates the benefits of AAE for age measurement in LMICs because HDSS residents have often been informed of their date of birth by HDSS fieldworkers during previous household visits. As a result, age heaping is less prevalent in the distribution of self-reported ages in Niakhar than in other demographic datasets collected in the same region (Figure A-3).
We compared the sensitivity/specificity of AAE and SR in identifying women of reproductive age. We found that SR had 86% sensitivity (43/50 women aged 50 and above properly classified) and 99.6% specificity (277/278 women of reproductive age properly classified). This combination lies slightly above the ROC curve in Figure 5.
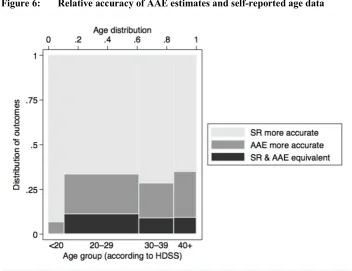
Figure 6: Relative accuracy of AAE estimates and self-reported age data
Notes: SR = self-reports of age, collected during the sociodemographic component of the study. We classified participants in three groups: those for whom SR and AAE were equivalent (i.e., the absolute differences between each estimate and the HDSS age are equal to zero); those for whom SR was more accurate (i.e., the absolute difference between SR and the HDSS value is smaller than the absolute difference between AAE and the HDSS value); and those for whom AAE was more accurate.
6. Discussion
conservative, because members of the Niakhar HDSS are more likely to be aware of their own age than residents in other LMIC settings. In other settings more representative of the extent of age awareness in LMICs, the benefits of AAE for age measurement may be larger.
The estimates of age generated by AAE had other desirable properties. Their accuracy deteriorated only slightly when applied to photographs of women wearing headscarves (a 12% increase in MAE). This is important, because in West Africa and other LMICs, women often wear such clothing and may be reluctant to remove it before being photographed. Our assessment of the effects of headscarves on AAE accuracy was, however, limited to the types of headscarves worn in Niakhar, which primarily cover the top of a woman’s head and occasionally the sides, thus leaving most of the facial area uncovered. In other LMICs, women may wear headscarves that cover larger parts of the face. In such settings, AAE may elicit a greater number of refusals. It may also require more advanced computer vision techniques (Elhamifar and Vidal 2011) to extract age-related features from visible areas of the face.
AAE may also be more robust to some forms of endogeneity bias in demographic analysis than self-reported age data. In settings where women are not aware of their age, interviewers may infer age based on available information about time since marriage or the number of children a woman has ever had (Ewbank 1981). This may lead to errors, which are related to demographic outcomes of interest (e.g., fertility). In our test, by comparison, errors in AAE estimates of age in completed years were not associated with a woman’s parity or her health-related characteristics. The likelihood of errors was only affected by reported sun exposure. Future AAE models may be stratified by such characteristics to prevent or limit estimation errors. In our age classification system the likelihood of misclassification was not related to the parity of women either, even though this null finding may have been due to small sample size. The accuracy of age classifications derived from AAE was, however, linked to self-reported health and to smoking behaviors. AAE may thus still be affected by endogeneity bias in health-related analyses.
against which the model could be trained. Third, our dataset did not include photographs of the same individual captured several years apart, even though such longitudinal assessments may permit understanding aging trajectories and strengthen AAE systems (Fu, Guo, and Huang 2010; Panis and Lanitis 2014). Fourth, we did not ascertain whether other practices (e.g., wearing make-up, ritual scarification) that modify facial appearance might have confounded our estimates (Chen, Dantcheva, and Ross 2014). In the Niakhar HDSS such practices are likely limited, but they may be more common in other LMIC settings, particularly in urban areas. Fifth, we did not adopt several of the more recent innovations in the development of AAE systems. For example, collecting images (or short videos) with dynamic facial expressions (e.g., smiling, anger) may help better ascertain skin texture and obtain more precise predictions of age (Dibeklioğlu et al. 2015). Similarly, more refined models linking facial features to a person’s true age may improve the accuracy of AAE systems. This includes, for example, the use of kernel methods to capture more complex relations between features (Hsu, Chang, and Lin 2003; Senthilkumar and Gnanamurthy 2017), or the development of hierarchical models that combine age classification and age estimation (Choi et al. 2011; Thukral, Mitra, and Chellappa 2012). Sixth, we only tested AAE among women. Some of the factors associated with errors in AAE (e.g., smoking, sun exposure) are more common among men in Senegal, and elsewhere. AAE may thus be less accurate in evaluating their age. Seventh, our training dataset might have contained errors in reference age data. This might have occurred if the HDSS birth record contained errors. It might also have occurred if we mistakenly photographed a person who was not the person for whom we had a birth record. We set procedures in place (see above) to avoid such instances (e.g., verification of other characteristics), but we cannot rule them out entirely. Errors in reference data might explain some of the large errors in AAE classifications or age estimates we obtained during this study.
Finally, we did not investigate whether information extracted from a facial photograph may be usefully combined with other sources of information on age or age-related characteristics to achieve more precise estimates. For example, AAE may be combined with several background characteristics (e.g., education), with other visual data (e.g., a short video to evaluate gait), or with SR data on age. Such combination strategies may improve the accuracy of age estimates beyond the levels currently achieved by SR or AAE alone.
where age awareness is low and errors such as heaping may confound demographic estimates. In the short- to medium-term (e.g., the next 15–20 years), this might significantly strengthen the monitoring of demographic trends in LMICs, as well as the tracking of progress towards the SDGs and other global objectives.
Future work in the development of AAE for age measurement in LMICs should proceed in two related directions. On the one hand, larger and more complete training datasets must be compiled to further improve the accuracy of AAE. This may be accomplished, in part, through the more than 40 HDSS located in Africa and Asia that constitute the INDEPTH network (Bocquier, Sankoh, and Byass 2017; Ekstrom et al. 2016; Herbst et al. 2015; Sankoh and INDEPTH Network 2015). None of these HDSS, however, were begun more than 55‒60 years ago. They thus do not provide reference age data for individuals above that age. Training cases for those older birth cohorts may be recruited instead from LMIC areas where Christian missions were established at the turn of the 20th century. Such missions have maintained baptism registers, which often
contain highly accurate data on the age of individuals who are now members of the oldest age groups (Notkola, Timæus, and Siiskonen 2000, 2004; Walters 2016).
On the other hand, issues related to data confidentiality linked to AAE must also be addressed. The collection of photographs potentially adds personally identifiable information to demographic data. This raises concerns, in particular if these studies also collect sensitive information (e.g., ethnicity, sexual behaviors, health status), or if the data can be linked with other datasets (e.g., administrative data). Safeguards must thus be developed to preserve confidentiality. These may include, for example, the use of encrypted image storage procedures, or the development of AAE applications that produce age estimates ‘on the spot,’ and then immediately destroy the image(s) that served as input.
More generally, our work also highlights the potential role that computer vision tools may play in improving demographic measurement in LMIC settings with limited data availability/quality. For example, during studies in LMICs, computer vision could be used to measure demographic and health-related parameters other than age, such as body mass index (Kocabey et al. 2017) or smoking behaviors (Parate et al. 2014; Zheng et al. 2016).
7. Acknowledgements
References
A’Hearn, B., Baten, J., and Crayen, D. (2009). Quantifying quantitative literacy: Age heaping and the history of human capital. The Journal of Economic History
69(3): 783–808.doi:10.1017/S0022050709001120.
AbouZahr, C., de Savigny, D., Mikkelsen, L., Setel, P.W., Lozano, R., Nichols, E., Notzon, F., and Lopez, A.D. (2015). Civil registration and vital statistics: Progress in the data revolution for counting and accountability. Lancet
386(10001): 1373–1385.doi:10.1016/S0140-6736(15)60173-8.
Albert, A.M., Ricanek Jr., K., and Patterson, E. (2007). A review of the literature on the aging adult skull and face: Implications for forensic science research and applications. Forensic Science International 172(1): 1–9. doi:10.1016/j. forsciint.2007.03.015.
Bell, M., Charles-Edwards, E., Ueffing, P., Stillwell, J., Kupiszewski, M., and Kupiszewska, D. (2015). Internal migration and development: Comparing migration intensities around the world. Population and Development Review
41(1): 33–58.doi:10.1111/j.1728-4457.2015.00025.x.
Bendavid, E., Seligman, B., and Kubo, J. (2011). Comparative analysis of old-age mortality estimations in Africa. PLoS One 6(10): e26607.doi:10.1371/journal. pone.0026607.
Bocquier, P., Sankoh, O., and Byass, P. (2017). Are health and demographic surveillance system estimates sufficiently generalizable? Global Health Action
10(1): 1356621.doi:10.1080/16549716.2017.1356621.
Boerma, T. (2010). Foreword: The INDEPTH WHO–SAGE collaboration: Coming of age.Global Health Action 3.doi:10.3402/gha.v3i0.5442.
Bühlmann, P., Drineas, P., Kane, M., and van der Laan, M. (2016).Handbook of big data. Boca Raton: CRC Press.
Burges, C.J. (1998). A tutorial on support vector machines for pattern recognition.Data
Mining and Knowledge Discovery 2(2): 121–167. doi:10.1023/A:
1009715923555.
Caldwell, J.C. (1966). Study of age misstatement among young children in Ghana.
Caldwell, J.C. and Igun, A.A. (1971). An experiment with census-type age enumeration in Nigeria. Population Studies 25(2): 287–302. doi:10.1080/00324728.1971. 10405804.
Cameriere, R., Pacifici, A., Pacifici, L., Polimeni, A., Federici, F., Cingolani, M., and Ferrante, L. (2016). Age estimation in children by measurement of open apices in teeth with Bayesian calibration approach.Forensic Science International 258: 50–54.doi:10.1016/j.forsciint.2015.11.005.
Chang, C.-C. and Lin, C.-J. (2011). LIBSVM: A library for support vector machines.
ACM Transactions on Intelligent Systems and Technology2(3): 27.doi:10.1145/ 1961189.1961199.
Chatterji, S. (2013). World Health Organisation’s (WHO) Study on Global Ageing and Adult Health (SAGE). BMC Proceedings 7(S4): S1. doi:10.1186/1753-6561-7-S4-S1.
Chen, C., Dantcheva, A., and Ross, A. (2014). Impact of facial cosmetics on automatic gender and age estimation algorithms. Paper presented at the 9th International
Conference on Computer Vision Theory and Applications (VISAPP), Lisbon, Portugal, January 5–8, 2014.
Choi, S.E., Lee, Y.J., Lee, S.J., Park, K.R., and Kim, J. (2011). Age estimation using a hierarchical classifier based on global and local facial features. Pattern Recognition 44(6): 1262–1281.doi:10.1016/j.patcog.2010.12.005.
Corsi, D.J., Neuman, M., Finlay, J.E., and Subramanian, S.V. (2012). Demographic and health surveys: A profile. International Journal of Epidemiology 41(6): 1602– 1613.doi:10.1093/ije/dys184.
Delaunay, V., Douillot, L., Diallo, A., Dione, D., Trape, J.F., Medianikov, O., Raoult, D., and Sokhna, C. (2013). Profile: The Niakhar Health and Demographic Surveillance System. International Journal of Epidemiology 42(4): 1002–1011.
doi:10.1093/ije/dyt100.
Dibeklioğlu, H., Alnajar, F., Salah, A.A., and Gevers, T. (2015). Combining facial dynamics with appearance for age estimation. IEEE Transactions on Image Processing 24(6): 1928–1943.doi:10.1109/TIP.2015.2412377.
Ekstrom, A.M., Clark, J., Byass, P., Lopez, A., de Savigny, D., Moyer, C.A., Campbell, H., Gage, A.J., Bocquier, P., AbouZahr, C., and Sankoh, O. (2016). INDEPTH network: Contributing to the data revolution. Lancet Diabetes and Endocrinology 4(2): 97.doi:10.1016/S2213-8587(15)00495-7.
Elhamifar, E. and Vidal, R. (2011). Robust classification using structured sparse representation. Paper presented at the IEEE Conference on Computer Vision and Pattern Recognition (CVPR), Colorado Springs, United States, June 20–25, 2011.doi:10.1109/CVPR.2011.5995664.
Elo, I.T. and Preston, S.H. (1994). Estimating African-American mortality from inaccurate data.Demography 31(3): 427–458.doi:10.2307/2061751.
Elo, I.T., Mykyta, L., Sebastiani, P., Christensen, K., Glynn, N.W., and Perls, T. (2013). Age validation in the long life family study through a linkage to early-life census records. Journals of Gerontology Series B: Psychological Sciences and Social Sciences 68(4): 580–585.doi:10.1093/geronb/gbt033.
Elo, I.T., Turra, C.M., Kestenbaum, B., and Ferguson, B.R. (2004). Mortality among elderly Hispanics in the United States: Past evidence and new results.
Demography 41(1): 109–128.doi:10.1353/dem.2004.0001.
Eloundou-Enyegue, P. and Davanzo, J. (2003). Economic downturns and schooling inequality, Cameroon, 1987–95. Population Studies 57(2): 183–197.
doi:10.1080/0032472032000097092.
Ewbank, D.C. (1981).Age misreporting and age-selective underenumeration: Sources, patterns and consequences for demographic analysis. Washington, D.C.: National Academy Press.
Fu, Y. and Huang, T.S. (2008). Human age estimation with regression on discriminative aging manifold. IEEE Transactions on Multimedia 10(4): 578– 584.doi:10.1109/TMM.2008.921847.
Fu, Y., Guo, G., and Huang, T.S. (2010). Age synthesis and estimation via faces: A survey.IEEE transactions on Pattern Analysis and Machine Intelligence 32(11): 1955–1976.doi:10.1109/TPAMI.2010.36.
GBD SDG Collaborators (2017). Measuring progress and projecting attainment on the basis of past trends of the health-related Sustainable Development Goals in 188 countries: An analysis from the Global Burden of Disease Study 2016. Lancet
Geng, X., Yin, C., and Zhou, Z.-H. (2013). Facial age estimation by learning from label distributions. IEEE Transactions on Pattern Analysis and Machine Intelligence
35(10): 2401–2412.doi:10.1109/TPAMI.2013.51.
Geng, X., Zhou, Z.-H., and Smith-Miles, K. (2007). Automatic age estimation based on facial aging patterns. IEEE Transactions on Pattern Analysis and Machine Intelligence29(12): 2234–2240.doi:10.1109/TPAMI.2007.70733.
Geng, X., Zhou, Z.-H., Zhang, Y., Li, G., and Dai, H. (2006). Learning from facial aging patterns for automatic age estimation. Paper presented at the 14th Annual
ACM International Conference on Multimedia, Santa Barbara, United States, October 23–27, 2006.doi:10.1145/1180639.1180711.
George, P.A. and Hole, G.J. (2000). The role of spatial and surface cues in the age-processing of unfamiliar faces. Visual Cognition 7(4): 485–509. doi:10.1080/ 135062800394621.
Gessert, C.E., Elliott, B.A., and Haller, I.V. (2002). Dying of old age: An examination of death certificates of Minnesota centenarians. Journal of the American Geriatric Society 50(9): 1561–1565.doi:10.1046/j.1532-5415.2002.50413.x. Guo, G. and Zhang, C. (2014). A study on cross-population age estimation. Paper
presented at the 2014 IEEE Conference on Computer Vision and Pattern Recognition (CVPR), Columbus, United States, June 23–28, 2014.doi:10.1109/ CVPR.2014.542.
Guo, G., Fu, Y., Dyer, C.R., and Huang, T.S. (2008). Image-based human age estimation by manifold learning and locally adjusted robust regression. IEEE Transactions on Image Processing 17(7): 1178–1188. doi:10.1109/TIP.2008. 924280.
Guo, G., Mu, G., Fu, Y., Dyer, C., and Huang, T. (2009). A study on automatic age estimation using a large database. Presented at the 2009 IEEE 12th International
Conference on Computer Vision (CVPR), Kyoto, Japan, September 29–October 2, 2009.
Hastie, T., Tibshirani, R., and Friedman, J. (2009). Overview of supervised learning. In: Hastie, T., Tibshirani, R., and Friedman, J. (eds.). The elements of statistical learning: Data mining, inference, and prediction. New York: Springer: 9–41.
doi:10.1007/978-0-387-84858-7_2.
Herbst, K., Juvekar, S., Bhattacharjee, T., Bangha, M., Patharia, N., Tei, T., Gilbert, B., and Sankoh, O. (2015). The INDEPTH data repository: An international resource for longitudinal population and health data from health and demographic surveillance systems. Journal of Empirical Research on Human Research Ethics 10(3): 324–333.doi:10.1177/1556264615594600.
Hsu, C.-W., Chang, C.-C., and Lin, C.-J. (2003). A practical guide to support vector classification. Taipei City: Department of Computer Science, National Taiwan University (Technical report).
Kocabey, E., Camurcu, M., Ofli, F., Aytar, Y., Marin, J., Torralba, A., and Weber, I. (2017). Face-to-BMI: Using computer vision to infer body mass index on social media.arXiv preprint arXiv:1703.03156.
Kvaal, S.I., Kolltveit, K.M., Thomsen, I.O., and Solheim, T. (1995). Age estimation of adults from dental radiographs. Forensic Science International 74(3): 175–185.
doi:10.1016/0379-0738(95)01760-G.
Lanitis, A., Draganova, C., and Christodoulou, C. (2004). Comparing different classifiers for automatic age estimation. IEEE Transactions on Systems, Man, and Cybernetics, Part B: Cybernetics 34(1): 621–628. doi:10.1109/TSMCB. 2003.817091.
LeCun, Y., Bengio, Y., and Hinton, G. (2015). Deep learning.Nature 521(7553): 436– 444.doi:10.1038/nature14539.
Li, C., Liu, Q., Liu, J., and Lu, H. (2012). Learning ordinal discriminative features for age estimation. Presented at the 2012 IEEE Conference on Computer Vision and Pattern Recognition (CVPR), Providence, United States, June 16–21, 2012. Luo, W., Nguyen, T., Nichols, M., Tran, T., Rana, S., Gupta, S., Phung, D., Venkatesh,
S., and Allender, S. (2015). Is demography destiny? Application of machine learning techniques to accurately predict population health outcomes from a minimal demographic dataset. PLoS One 10(5): e0125602.doi:10.1371/journal. pone.0125602.
Meekers, D. and van Rossem, R. (2005). Explaining inconsistencies between data on condom use and condom sales. BMC Health Services Research 5(1): 5.
Michalski, R.S., Carbonell, J.G., and Mitchell, T.M. (2013). Machine learning: An artificial intelligence approach. Berlin: Springer Science & Business Media. Mikkelsen, L., Phillips, D.E., AbouZahr, C., Setel, P.W., de Savigny, D., Lozano, R.,
and Lopez, A.D. (2015). A global assessment of civil registration and vital statistics systems: monitoring data quality and progress. Lancet 386(10001): 1395–1406.doi:10.1016/S0140-6736(15)60171-4.
Mitchell, T., Buchanan, B., de Jong, G., Dietterich, T., Rosenbloom, P., and Waibel, A. (1990). Machine learning. Annual Review of Computer Science 4: 417–433.
doi:10.1146/annurev.cs.04.060190.002221.
Mullainathan, S. and Spiess, J. (2017). Machine learning: An applied econometric approach. Journal of Economic Perspectives 31(2): 87–106. doi:10.1257/jep. 31.2.87.
Ng, M., Fleming, T., Robinson, M., Thomson, B., Graetz, N., Margono, C., Mullany, E.C., Biryukov, S., Abbafati, C., and Abera, S.F. (2014). Global, regional, and national prevalence of overweight and obesity in children and adults during 1980–2013: A systematic analysis for the Global Burden of Disease Study 2013.
Lancet 384(9945): 766–781.doi:10.1016/S0140-6736(14)60460-8.
Notkola, V., Timæus, I.M., and Siiskonen, H. (2000). Mortality transition in the Ovamboland region of Namibia, 1930–1990. Population Studies 54(2): 153– 167.doi:10.1080/713779086.
Notkola, V., Timæus, I.M., and Siiskonen, H. (2004). Impact on mortality of the AIDS epidemic in northern Namibia assessed using parish registers. AIDS 18(7): 1061–1065.doi:10.1097/00002030-200404300-00015.
Palloni, A., Pinto, G., and Beltrán-Sánchez, H. (2014). Latin American Mortality Database (LAMBdA) [electronic resource]. Madison: Center of Demography and Health of Aging, University of Wisconsin–Madison. https://www.ssc.wisc. edu/cdha/latinmortality.
Panis, G. and Lanitis, A. (2014). An overview of research activities in facial age estimation using the FG-NET aging database. Paper presented at the European Conference on Computer Vision, Zurich, Switzerland, September 6–12, 2014. Parate, A., Chiu, M.-C., Chadowitz, C., Ganesan, D., and Kalogerakis, E. (2014). Risq:
Recognizing smoking gestures with inertial sensors on a wristband. Paper presented at the 12th Annual International Conference on Mobile systems,
applications, and services, Bretton Woods, United States, June 16–19, 2014.
Parkhi, O.M., Vedaldi, A., and Zisserman, A. (2015). Deep face recognition. Paper presented at the British Machine Vision Conference, Swansea, United Kingdom, September 7–10, 2015.doi:10.5244/C.29.41.
Paudel, D., Ahmed, M., Pradhan, A., and Dangol, R.L. (2013). Successful use of tablet personal computers and wireless technologies for the 2011 Nepal Demographic and Health Survey. Global Health: Science and Practice 1(2): 277–284.
doi:10.9745/GHSP-D-12-00056.
Pison, G. (1980). Calculer l’âge sans le demander: Méthode d’estimation de l’âge et structure par âge des Peul Bandé [Calculating age without asking for it: Method of estimating the age and age-structure of the Peul-Bande].Population 35(4–5): 861–892.doi:10.2307/1532366.
Preston, S.H. and Elo, I.T. (1999). Effects of age misreporting on mortality estimates at older ages.Population Studies 53(2): 165–177.doi:10.1080/00324720308075. Preston, S.H., Elo, I.T., Rosenwaike, I., and Hill, M. (1996). African-American
mortality at older ages: Results of a matching study. Demography 33(2): 193– 209.doi:10.2307/2061872.
Pullum, T.W. (2006). An assessment of age and date reporting in the DHS Surveys 1985–2003. Calverton: Macro International (DHS Methodological Report No. 5).
Pullum, T.W. and Becker, S. (2014). Evidence of omission and displacement in DHS birth histories. Rockville: ICF (DHS Methodological Report No. 11).
Pullum, T.W. and Staveteig, S. (2017). An assessment of the quality and consistency of age and date reporting in DHS Surveys, 2000–2015. Rockville: ICF (DHS Methodological Report No. 19).
Qawaqneh, Z., Mallouh, A.A., and Barkana, B.D. (2017). Deep convolutional neural network for age estimation based on VGG-face model. arXiv preprint
arXiv:1709.01664.
Randall, S. and Coast, E. (2016). The quality of demographic data on older Africans.
Demographic Research 34(5): 143–174.doi:10.4054/DemRes.2016.34.5. Ranjan, R., Sankaranarayanan, S., Castillo, C.D., and Chellappa, R. (2017). An
all-in-one convolutional neural network for face analysis. Paper presented at the 2017 12th IEEE International Conference on Automatic Face and Gesture Recognition
(FG 2017), Washington, D.C., United States, May 30–June 3, 2017.
Rasmussen, C.E. (2004). Gaussian processes in machine learning. In: Bousquet, O., von Luxburg, U., and Rätsch, G. (eds.). Advanced lectures on machine learning. Berlin: Springer: 63–71.doi:10.1007/b100712.
Ren, F., Li, C., Xi, H., Wen, Y., and Huang, K. (2009). Estimation of human age according to telomere shortening in peripheral blood leukocytes of Tibetan.
American Journal of Forensic Medicine and Pathology 30(3): 252–255.
doi:10.1097/PAF.0b013e318187df8e.
Ricanek Jr., K. and Tesafaye, T. (2006). Morph: A longitudinal image database of normal adult age-progression. Paper presented at the 7th International
Conference on Automatic Face and Gesture Recognition, Southampton, United Kingdom, April 10–12, 2006.doi:10.1109/FGR.2006.78.
Ritz-Timme, S., Cattaneo, C., Collins, M., Waite, E., Schütz, H., Kaatsch, H.-J., and Borrman, H. (2000). Age estimation: the state of the art in relation to the specific demands of forensic practice. International Journal of Legal Medicine 113(3): 129–136.doi:10.1007/s004140050283.
Rosenwaike, I. and Stone, L.F. (2003). Verification of the ages of supercentenarians in the United States: Results of a matching study. Demography 40(4): 727–739.
doi:10.1353/dem.2003.0038.
Sankoh, O. and INDEPTH Network (2015). CHESS: An innovative concept for a new generation of population surveillance. Lancet Global Health 3(12): e742.
doi:10.1016/S2214-109X(15)00180-1.
Senthilkumar, R. and Gnanamurthy, R. (2017). Performance improvement in classification rate of appearance based statistical face recognition methods using SVM classifier. Paper presented at the 2017 4th International Conference on
Advanced Computing and Communication Systems (ICACCS), Coimbatore, India, January 6–7, 2017.doi:10.1109/ICACCS.2017.8014584.
Serinelli, S., Panebianco, V., Martino, M., Battisti, S., Rodacki, K., Marinelli, E., Zaccagna, F., Semelka, R.C., and Tomei, E. (2015). Accuracy of MRI skeletal age estimation for subjects 12–19: Potential use for subjects of unknown age.
International Journal of Legal Medicine 129(3): 609–617. doi:10.1007/s00414-015-1161-y.
Sun, Y., Wang, X., and Tang, X. (2013). Deep convolutional network cascade for facial point detection. Paper presented at the IEEE Conference on Computer Vision and Pattern Recognition (CVPR), Portland, United States, June 25–27, 2013.