Abstract
This paper compares the relative merit in realistic versus lab style experiments for testing voting
technology. By analyzing three voting experiments, we describe the value of realistic settings in showing the enormous challenges for voting process control and consistent voting experiences.
The methodology developed for this type of experiment will help other researchers to test polling place
protocols and administration. Comparing the results from laboratory experiments with voter verification and realistic voting experiments further validates the procedure of testing equipment in laboratory settings.
The methodology and protocol for testing voting systems can be applied to any voting technology. This protocol matches the real-world conditions of voting by replicating them for the experiment.
Keywords
Usability testing, voting technology testing, methods and tools, voting systems, audit trails, user-centered design.
Permission to make digital or hard copies of all or part of this work for personal or classroom use is granted without fee provided that copies are not made or distributed for profit or commercial advantage and that copies bear this notice and the full citation on the first page. To copy otherwise, or republish, to post on servers or to redistribute to lists, requires prior specific permission and/or a fee. Copyright 2005, UPA.
Ted Selker Media Lab
Massachusetts Institute of Technology 20 Ames Street
Cambridge, MA 02139 [email protected]
Elizabeth Rosenzweig Bubble Mountain Consulting 62 Athelstane Road Newton, MA 02459 [email protected]
Anna Pandolfo Media Lab
Massachusetts Institute of Technology 20 Ames Street
Introduction
Voting is a difficult task. People don't vote very often, but when they do, they care very much about the result. A vote carries weight; it has great
consequences, and therefore, voting machines must work as promised. Ballots often present the voter with a decision-making task where selections are made from a busy field of choices.
In 2002, the US Congress passed the Help America Vote Act. (HAVA, 2002), It included detailed guidelines for voting technology, such as voter verification and the ability to easily change a vote before it is cast and counted. This means that if the voter finds an error, he or she should be able to correct it. Voting systems today suffer many problems that result in lost votes, ranging from bad ballot design, usability issues around selection and casting of votes, to polling place
problems, transportation, and counting procedures. These issues present obstacles to the accuracy, integrity, and security of valid vote counts.
Usability problems and registration issues are two of the biggest problems seen in recent elections (Ansolabehere 2004). Concern has been expressed regarding errors in voting, since such errors can result in a vote for the wrong candidate or in a residual vote, which renders the count invalid (Bowler, Donovan, and Happ, 1992), (Miller and Krosnick, 1998), (Wand, Shotts, Sekhon, and Mebane, 2002), (Sled, 2003), (Niemi and Herrnson, 2003).
Sled's ex-post facto study (Sled, 2003) on the evaluation of voting systems analyzed the California Governor Recall election of 2003. This election presented the voter with 138 selections for governor.
The study showed that a vertical alignment effect caused 5% more selections for the adjacent three front-runners, on a punch card system than on an optical-scan or touch-screen system. This position is supported by results of other studies as well
(Ansolabehere and Stephen, 2004).
The HAVA legislation created the Election Assistance Commission in 2002, which provides the first steps in developing guidelines for voting systems. As of this writing, only a few studies examine usability guidelines for voting, and none of them use the same
methodologies. The value of our proposed methodology is that it is built on previous work for testing voting technologies.
The Caltech/MIT Voting Technology project developed several prototypes to demonstrate and test ballot design and verification auditing schemes for voting (Goler, Selker, and Wilde, 2006) and has run several studies to examine these issues. Two studies replicated the environment and condition of normal polling places. The first was the New York Reading Disabilities study, which compared full-faced ballots to standard Direct Record Electronic (DRE) voting machines for people with disabilities. The second study was the Arlington Voter Verification, which tested voter verification schemes in a realistic setting.
The Voting Technology project has also developed a simulator (Sullivan, 2005) to demonstrate and test ballot design and verification auditing schemes. This simulator can present a Voter Verifiable Paper trail as seen on a Sequoia or Diebold DRE, as well as
an experimental, contemporaneous, Voter Verifiable Paper Audit Trail (VVPAT) with a paper trail that allows users to verify their vote after each selection, as opposed to waiting until the end of the voting process. Finally, the MIT simulator can present a
contemporaneous Voter Verifiable Audio Audit Transcript Trail (VVAATT) (Goler, Selker, and Wilde, 2006). This simulator was also tested with the LEVI ballot design in the MIT LEVI Study.
The Voter Verification study compared four different verification approaches. Each of the following approaches produced an audit record of the vote: Audio with an audiotape record on an analog
audiotape.
A printed list of selections after all the selections are made
A printed list of selections as the selections are being made
An optical scan record.
Related Studies
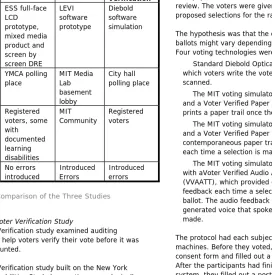
This paper describes the general methodologies to be used in testing voting technology. It is based on three studies: the New York Reading Disabilities voting study, the MIT LEVI Study, and the Arlington Voter Verification study. The New York and Arlington studies included the use of a protocol created to match the real-world conditions, as well as investigate both usability and error detection in voting systems. The MIT study focused on two verification auditing systems.
New York Reading Disabilities Study
The Reading Disabilities study (Selker, Goler, and Wilde, 2005) was a previous effort to design a research protocol to create an ecologically valid voting
experience. The hypothesis was that the pressure of a real voting experience affects the overall user
experience.
A full-face voting system presented a voter with all races on the ballot simultaneously. This study sought to observe how full-faced voting interfaces compared to others that show less information simultaneously. In particular, we looked at how a full face voting interface affects the votes of people with reading disabilities.
This study used ESS iVotronic DRE and ESS V2000 paper over buttons full-faced DRE voting machine. This system employed the LS large LCD full faced voting machine.
This study was conducted in June of 2004 using a protocol of local registered voters with actual poll workers at the New York City west side YMCA polling place. Twenty-six percent of the subjects tested had a previously diagnosed reading disability.
and only data from 41 subjects were able to be collected.
When they first arrived, the voters were checked in at a Registration desk. Although normally voters register before they vote, this protocol differed from normal conditions by providing reading assistance to everyone while they were filling out the pretest questionnaire and consent form.
Participants were required to review actual voting materials from the 2002 Buffalo NY ballot. This review took place in an area with refreshments and tables with people providing reading support. In addition, there was a station staffed by a poll worker who explained how the voting machines worked.
To screen for reading disabilities, the protocol included the use of a battery of cognitive abilities tests (Nelson-Denny, WRAT-3, and WAIS-III vocabulary subtest). The screening process lasted for about 20 minutes, and the tests were administered in between each voting experience. In this case, testing had two main purposes; one was to assess reading disabilities and the other was to provide a distracting activity that would help to reduce any learning transference effect between trials.
At the end of the study, a post-test “exit poll” questionnaire was filled out with reading assistance.
The Reading Disabilities study found that people with reading disabilities took longer to vote than people without that disability. In addition, those diagnosed with reading disabilities experience the fall-off effect
less on full-faced voting machines, but make more mistakes than people without reading disability.
MIT LEVI Study
This study tested verification auditing systems using the LEVI (Sullivan 2005) electronic ballot (Cohen 2005). The study had subjects vote in four elections on two different voting machines, one with a paper audit trail VVPAT, and one with an audio audit trail VVAATT. It was conducted in a quiet basement lobby area at MIT during the spring of 2005. The participants were drawn from the MIT community. It did not try to replicate real-world polling place conditions.
The protocol included the introduction of errors on the ballot that tested whether the verification system was helping voters find the errors. The results showed that, of 106 ballots, only 14% of people with audio
NY Reading Disabilities
MIT LEVI Arlington
Voter Verification System
and Ballot design
ESS full-face LCD
prototype, mixed media product and screen by screen DRE
LEVI software prototype
Diebold software simulation
Environ-ment
YMCA polling place
MIT Media Lab basement lobby
City hall polling place
Subjects Registered
voters, some with
documented learning disabilities
MIT Community
Registered voters
Errors No errors
introduced
Introduced Errors
Introduced errors
Figure 1. Comparison of the Three Studies
Arlington Voter Verification Study
The Voter Verification study examined auditing schemes to help voters verify their vote before it was cast and counted.
The Voter Verification study built on the New York Reading Disabilities Study by creating an ecologically valid voting experience. This study employed a protocol using registered voters voting in a mock election in the
town’s regular polling place administered by real poll workers. To provide voters with information about the election, voting materials were acquired from a local newspaper and offered to the study participants for review. The voters were given voting cards with proposed selections for the races.
The hypothesis was that the effectiveness of verifying ballots might vary depending on the technology used. Four voting technologies were tested:
Standard Diebold Optical Scanned paper ballot in which voters write the votes, which are then scanned.
The MIT voting simulator with a Diebold-like ballot and a Voter Verified Paper Audit Trail (VVPAT), which prints a paper trail once the voting is completed. The MIT voting simulator with a Diebold like ballot
and a Voter Verified Paper Audit Trail (VVPAT) with contemporaneous paper trail, which prints the vote each time a selection is made on the ballot.
The MIT voting simulator with a Diebold-like ballot with aVoter Verified Audio Audit Trail Technology (VVAATT), which provided contemporaneous audio feedback each time a selection was made on the ballot. The audio feedback used a male computer-generated voice that spoke as each selection was made.
The protocol had each subject vote on four different machines. Before they voted, the subjects signed a consent form and filled out a pretest questionnaire. After the participants had finished voting on each system, they filled out a post-task questionnaire. Once they had completed all the voting systems, the
The assignment of each subject to a specific protocol was partially counterbalanced to avoid order effects. An additional procedure was added to avoid some of the possible carry-over effects. This procedure was inserted between voting experiences for each subject.
Scrabble® was chosen as a word-oriented syntactic experience to match, and hopefully, to mask the kind of activity that people performed when voting. Each time a subject changed machines, they were asked to create a few words on the Scrabble® board. Although initial results look good, further work needs to be done to examine the effects of that inserted distracter activity.
EXPERIMENT GOALS
The Arlington Voter Verification experiment had several goals:
To understand the ability of voters to recognize and correct errors that were introduced by fraud (experimental manipulation in our case) or errors made by the voter’s wrong selection across the various proposed technologies.
To observe whether voters verify their selections before, during, and after casting their votes. There were two kinds of errors purposely introduced into the ballot for the VVPAT system only.
To observe the effect that the different verification methods have on the ability to change a vote before it is cast and counted.
To improve the experimental protocol in an effort to ensure ecological validity by mimicking actual conditions of an election.
SUBJECTS
The study included 48 participants, all registered to vote and currently residents of the town of Arlington,
Massachusetts. The subjects had the following demographic characteristics of the registered voting subjects:
Age ranged between 30 and 82 years old, with an average of 50 years old
Five percent of the subjects didn’t own any computer equipment, and had never had experience using one; 80% of the subjects reported using the computer daily
92% of the subjects agreed that voting process in general is an easy one.
When asked the frequency with which the subjects vote, 64% reported to always vote during elections, and 30% reported to voting frequently
OVERALL TEST ENVIRONMENTS
The study was conducted in the city hall in Arlington, Massachusetts, in a multipurpose auditorium with a stage. The room is used for town meetings, elections, and many other events. It has balconies that hang over the areas used in the polling place, which create some darkened areas that are often used for voting booths. In this study, only the registration table was under the balconies. All other activities occurred in the well-lit areas.
THE BALLOT
The ballot used was a combination of two previous elections in the town of Arlington. Those two elections were November 2004 and a previous town election in September 2003.
by providing subjects with elections with which they were already familiar.
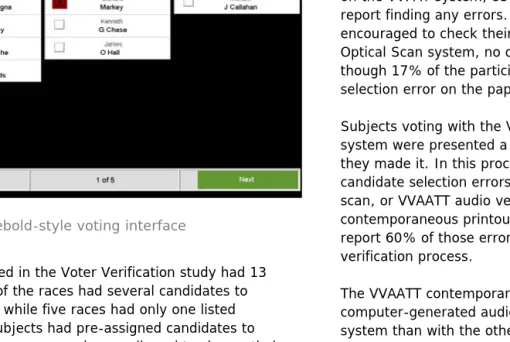
Figure 2. Diebold-style voting interface
The ballot used in the Voter Verification study had 13 races. Eight of the races had several candidates to choose from, while five races had only one listed candidate. Subjects had pre-assigned candidates to vote for in nine races, and were allowed to choose their own candidate in four races.
ERRORS INTRODUCED TO VOTING PROCESS
Since verifications was a goal of this study, two kinds of errors were purposely introduced into the ballot for the VVPAT system:
Error 1: Changing a vote to a different candidate.
Error 2: Removing a vote from a candidate. The vote is omitted in the audit prints.
RESULTS FROM VOTER VERIFICATION STUDY
Out of the 48 participants who ran this study, a rich data set was obtained for 35 participants..
ERRORS FOUND BY PARTICIPANTS
Although there were two fraudulent errors introduced on the VVPAT system, 83% of the participants did not report finding any errors. Though voters were
encouraged to check their work on the paper ballot Optical Scan system, no one reported an error, even though 17% of the participants did, in fact, make a selection error on the paper ballot.
Subjects voting with the VVPAT contemporaneous system were presented a printout of each selection as they made it. In this process, they made 50% more candidate selection errors than VVPAT, the Optical scan, or VVAATT audio verification. The
contemporaneous printout did allow them to find and report 60% of those erroneous selections during the verification process.
The VVAATT contemporaneous system used delayed computer-generated audio. Voting took longer with this system than with the other voting systems. The results from the VVAATT system showed that participants made half as many errors as on the VVPAT
contemporaneous system. However, the results were very similar to the number of selection errors on the Opt Scan system. In the case of VVAATT, 60% of the errors were also recognized and reported during verification.
provided verification compared to a 0% reduction in errors on systems that don’t provide any means for verification. These results, although preliminary, corroborate previous findings by Cohen and Selker (2005) that point toward the possibility of a more accurate alternative audit technologies, other than paper trails alone.
EASE OF USE
Subjects’ perceived the Optical Scan paper ballots and VVPAT systems easier to use than the VVAATT and VVPAT contemporaneous systems. Since the Optical Scan was the technology they were used to, we believe that supported their perception it was easier to use. Furthermore, the lack of feedback for the mistakes on the Optical Scan gave them the perception that there were no problems.
One way to interpret this result is that the immediate feedback provided by the VVPAT contemporaneous and VVAATT might translate into a cognitive load that is higher than a system that does not interrupt the voter while they are voting. The fact that the
contemporaneous feedback forces them to think about their vote again might explain the higher number of errors found in these systems. Furthermore, the interruption was disruptive and could explain the perception of a more difficult-to-use system.
From the descriptive measures, we observe that, for Optical Scan and VVPAT systems, 94% of the total subjects agree that these systems were easy to understand, followed by the VVPAT Contemporaneous system, with 83%, and finally, the VVAATT system with 77%.
The multivariate tests (F(3,31) p<0.001) and the alternative univariate test (F(3,99) p<0.001) are significant.
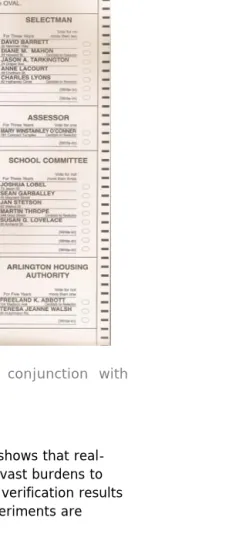
Figure 3.. Paper Ballot used in conjunction with Optical Scanner
DISCUSSION
consistently comparable. They show that the
surrounding experience does not change the problems of ballot comprehension or verification results. The yield of valid data from the set of experimental subjects was affected greatly by the complexity of the protocol. In the Reading Disabilities study various problems with the protocol and environment meant that only 41 of 97 subject data were retrievable and useful. In the Voter Verification, the yield was a bit better with 35 out of 48 subject of the participant data being useful.
Many of the difficulties in the Voter Verification study had to do with voting machine testing and set up, which can be easily solved with more solid prototypes. Another set of problems stemmed from variation in protocol based on experimenter and poll worker confusion. These issues can be solved, in part, by training experimenters and poll workers ahead of time.
Finally, the use of a local ballot from the same town that the participants come from is very controversial for the subjects. In New York Reading Disabilities study, the two-year separation of ballot and experiment, and geographical distance from Buffalo may have helped them follow a voting card, since they were using a ballot that was not meaningful to them. In the Arlington Voter Verification study, a few voters purposely decided not to follow the instructions and wouldn’t vote for the candidates pre-assigned on the voting card if these were not people they would normally vote for. Some subjects in Arlington and in New York even voted randomly to avoid giving away their selections.
We believe it is crucial that voters mark their voting cards themselves and make selections from those
cards. This protocol would allow more control over tracking votes and errors.
This real-world protocol produced data that points to real-world problems, such as distraction when voting, confusion with new voting technologies, as well as poll workers playing a key role in voter confidence and security.
A method for testing voting machines that purposely introduces errors provides a solid approach for examining error detection. By knowingly introducing errors into the experimental design, researchers are provided with simple metrics to study the issues that are important in determining if voting verification is working.
The data pointed to key issues:
Poll workers and polling place conditions may have as much to do with the usability of voting as the machines themselves. Poll workers may not provide consistent in directions or protocol. In both the Reading Disabilities study and the Voter Verification study, this was true, and many of pollworkers did not want to read the script or the protocol. This factor indicates a larger problem that must be studied concerning poll worker training. In any case, we recommend using trained experimenters to act as poll workers in voting studies that don’t concern evaluation of poll workers.
are not given a chance to verify their vote, and the optical scan provided a null condition for verification. Voters don’t like to be interrupted by having to
check their audit trail during the voting session. In spite of this, voters who were given feedback after each selection using audio or paper verification found more errors.
The distracter activities (cognitive test and Scrabble®) were cognitively similar to the activities the voters were doing. This may have been central to the fact that there was no significant order effect in our data.
Technology Constraints and Test Limitations
The LEVI, VVPAT, and VVAATT systems are labprototypes under development.
Specific limitations:
Poll workers and their training on voting systems was not consistent.
The use of real ballots from previous elections may have caused problems with participants not being objective in their task.
In a few cases, people were asked to vote for candidates that differed from the voters’ original intentions or preferences. (Voting card)
Errors were introduced only in one system.
All prototypes incorporated a touch-screen with touch sensitivity and calibration, which often gave the subjects problems. This problem inhibited some subjects, and created a negative association with the voting machine in general.
Demographic group of subjects who were senior citizens seemed to perform more poorly than young
adults, both with respect to the amount of time required to perform the task and the number of errors made. Manual dexterity and eye-hand
coordination may have been factors that could affect the outcome
Methodology for Voting Study
Discussions of testing voting technologies have been increasing (Miller and Krosnick, 1998). These recommendations come from various references, including the voting technology panel at ACM SIGCHI 2003, the report from the UPA 2004 Workshop on Voting and Usability (Quesenbery, 2004), and the National Institute of Standards and Technology (NIST) Common Industry Format for Usability Test Reports (CIF)(ANSI, 2001). These methodologies recommend testing voting and other interactive technologies in a simulated, real-world setting whenever possible.
Both the Reading Disabilities and Voter Verification studies raised question of whether the effort of creating an ecologically valid voting experience improves or weakens the data compared to normative testing of the equipment in a laboratory setting. The question needs to be examined on many levels:
How do we define a usable data sample? Even though the controlled laboratory setting provides more usable samples per set, that data may not be as representative of real-world situations.
sample group, it still provide better match for real-world issues.
Both the Reading Disabilities and Voter Verification studies simulated real-world conditions for polling places and voting experience. The lessons learned from the two experiments point to the value of the approach. Not only does this create a familiar environment for the voters, but it also allows for discovery of usability issues, both with the particular voting technology, as well as with the process and environment of the act of voting.
The LEVI study did not replicate an actual polling place, It was run in the lower level lobby of an academic building. This controlled setting made it much easier to administer and collect data. The Reading Disabilities and Voter Verification study of the voting methodology in semi-naturalistic settings does give important and rich results that do point to important research directions.
Further work must be done to study how the ecological voting methodology can reveal important data about how the protocols of polling places and poll workers affect voting results. This research can point to better standards for improving polling place operations in order to reduce errors often found in voting.
The methodology for running a quality voting study on human machine interaction includes the following: 1. Replicate voting experience by running the
experiment at a site that is used for voting in State and Federal elections.
a. Layout and lighting of voting stations match the regular poll environment.
2. Replicate conditions that exist in voting. a. Hours are consistent with regular election
hours.
b. Days are consistent with regular election day. 3. Training of voters is consistent with election voting
training, which is often minimal at best.
a. Voting educational materials are provided that replicate standard materials that voters receive.
4. Poll Workers
a. Same Poll worker personnel used as regular elections
5. Training replicates standard (sub-par) poll worker training.
a. Pay and hours the same as in election; standard precinct rate used.
6. Subjects
a. Registered voters, who have voted once before.
b. If possible, try to match the demographic of town that the mock trial is taking place.
Protocol
We recommend the following key areas to include in the voting study:
Registration table. All polling places include a
station for voters to register before they cast their vote. In the Reading Disabilities study, this
experiences with voting, and their familiarity with the use of computers in general.
Voting Card. In both Reading Disabilities and
Voter Verification studies, participants also received a “voting card” that told them how to vote on many of the races. However, some of the races were left blank, to allow participants to select their own candidates for some of the races.
Voter Education Station. A table with voting
materials provided for the previous town elections. Often the best materials for local elections will be printed in a newspaper. Include educational materials about the election. Provide time for voters to review materials if they so desire.
Voting System. Participants cast their votes on
prototype or actual voting machines if available.
Post-voting experience. After the participant
uses each machine, they should fill out a post-task questionnaire evaluating the system. It is best to set up a station in the room for filling out questionnaires. This post-voting questionnaire collected information comparing experiences voters had regarding each system and determining whether voters could find the errors in the ballots.
Distracter activity between voting
experiences. In the Reading Disabilities study, a 20-minute cognitive and reading assessment was positioned between chances to vote. In the Voter Verification study, Scrabble® games were set up at a station that voters visited after voting on each machine. The intention of this step was to provide a different cognitive task that would force the subject to think about something else before voting on the next station. This distracter activity is useful in an study that tests more than one voting system.
Final Questionnaire. After the participants
completed voting on all machines, they completed a final questionnaire. This provides data both on the experience as a whole, and as a comparison between the systems s.
Conclusions
All personnel must be aware of the training protocol and know how to handle the many stations. A permanent reader was placed at the voter
education table to help people with reading
disabilities. This resource helped people focus and is recommended in any voting study.
Cognitive screening in the Reading Disabilities study indicated that the spread of cognitive
competence was central to the errors in voting. This highlights the value of cognitive testing to improve the generalization of the data.
Videotapes made from above the left shoulder of voters were crucial to collecting data and
understanding what was happening for voters. This positioning of the video camera recorded their hand actions, as well as timestamps.
Ballot design must be checked and considered carefully. In both of our realistic voting experiments, problems with the “real” ballot confused voters. Using real voting places, real ballots, real
protocols, and real voting materials do complicate the data but at the same time may increase the
ecological validity of the study.
Practitioner’s Take Away
Voting systems present high stakes technology whose criteria for success depends on usability, security, and reliablity. This type of system benefits from testing in real-world conditions to gain better understanding of the issues.
The best practice protocol for testing voting systems in real-world conditions include simulation of polling place, voting systems, recognizable candidates, and real poll workers.
Voting experiments that use regular polling places as the test venue risk complicating the resulting data. To reduce complications, on-site training must be done in advance. Furthermore, voting systems must also be thoroughly tested for quality assurance in the voting test environment, not just in the lab
Ballot design must be checked carefully to avoid confusion to voters in experimental mock elections. This includes clear instructions and discussion with pariticipants regarding candidate choices.
Experimental protocals using regular pollworkers must include clear training, instructions, and scripts. Studies showed that regular poll workers can add a level of confusion and add to lack of control with data sets if they are not trained correctly.
References
ANSI (2001) Common Industry Format for Usability Test Reports (ANSI NCITS 354-2001). American National Institute for Standards and Technology http://zing.ncsl.nist.gov/iusr/documents/cifv1.1b.htm
Ansolabehere, S. (April 7, 2004) Residual Votes Attributable to Technology. Caltech/MIT Voting Technology project, www.vote.caltech.edu.
Bederson, B, Bonshin, L, Sherman, RM, Herrnson, PS, Niemi, RG. (2005) Electronic Voting System Usability Issues. Human-Computer Interaction Lab. University of Maryland.
Bederson, B. (January 2006) A Study of Vote Verification Technology. Conducted for the Maryland State Board of Elections.
Bowler, S, Donovan, T, and Happ, T. (1992) Ballot propositions and information costs: Direct democracy and the fatigued voter. The Western Political Quarterly. Vol.45, No. 2. pp. 599-568.
Cohen, S. (2005) Auditing Technology for Electronic Voting Machines. Masters Thesis, Massachusetts Institute of Technology, Media Lab. Cambridge, Massachusetts.
Geys, B and Heyndels, B. (2003) Influence of ‘Cognitive Sophistication’ on Ballot Layout Effects. Acta Politica 2003, pp. 295-311. Palgrave Macmillian, LTD. Goler, JA, Selker, T, Wilde, LF (2006) Augmenting Voting Interfaces to Improve Accessibility and Performance. CHI workshop. Canada.
Help America Vote Act (HAVA). (October 29,2002) Public Law 107-252, 107..Congress United States of
America. http://www.fec.gov/hava/hava.htm
Heyndels, B, and Geys, B. (2003) Influence of cognitive sophistication on ballot layout effects. Acta Politica. Vol. 38, pp. 295-311.
Laskowski, S. (2004) Improving the Usability and Accessibility of Voting Systems and Products. NIST Special Publications SP 500-256. Gaithersburg, Maryland: National Institute of Standards and Technology.
Niemi, RG and Herrnson, PS. (2003) Beyond the Butterfly: The Complexity of US Ballots. Perspectives on Politics. Vol. 1: pp. 317-326.
Oviatt, S. (September 2003) User-Centered Modeling and Evaluation of Multimodal Interfaces. Proceedings of the IEEE, Vol. 91, No. 9.
Oviatt, S, Coulston, R, Lunsford, R. (October 13-15, 2004) ICMI’04. State College, Pennsylvania, USA. Quesenbery, W. (September 2004) Defining a
Summative Usability Test for Voting Systems. A Report from the UPA 2004 Workshop on Voting and Usability. 2004, Usability Professionals’ Association, Chicago, Illinois, USA.
Rapp, B and Hendel, SK. (2003) Principals of cross-modal competition: Evidence from deficits of Attention. Pyschonomic Society. Inc., Bulletin and Review, Vol. 10, No. 1, pp. 210-219.
Recommendations of the Brennan Center for Justice and the Leadership Conference on Civil Rights for Improving Reliability of Direct Recording Electronic Voting Systems. (June 2004)
Selker, T, Hockenberry, M, Goler, J, Sullivan, S. (February 2005) VTP Working Paper #23. www.vote.caltech.edu
Selker, T, Goler, J, Wilde, L. (February 2005) Who Does Better with A Big Interface? Improving Voting
Performance of Reading for Disabled Voters. VTP working paper #24, www.vote.caltech.edu.
Sled, S. (October 2003) Vertical proximity effects in the California Recall Election. VTP Working Paper #8. Stantan, N and Baber, C. (2002) Error by design: methods for predicting device usability. Design Studies, Volume 23, Issue 4, July 2002, pp. 363-384, Elsevier Science Ltd.
Sullivan, S. (2005) LEVI Users Manual. VTP Working Paper
http://votingtechnologyproject.org/reports/LEVIum.pdf
Voting: User Experience, Technology and Practice. SIGCHI panel. 2003 conference, Ft. Lauderdale, Florida.
Acknowledgements
We would like to thank Jeremy Creelan, Larry Thomas, Jonathan Goler, Lorin Wilde, Sharon Cohen, Matthew Hockenberry, Kevin Stolt, Shawn Sullivan, and Allie Jacobs.
Author Bios
Dr. Ted Selker is an
Associate Professor at the MIT Media, the Director of the Context Aware Computing Lab, the MIT director of The Voting Technology Project and the Counter Intelligence/ Design Intelligence special interest group on domestic and product-design of the future. Ted’s work strives to demonstrate that people’s intentions can be recognized and respected by the things we design. Context aware computing creates a world in which people’s desires and intentions cause computers to help them. This group is recognized for its creating environments that use sensors and artificial intelligence to create so-called “virtual sensors”; adaptive models of users to create keyboard less computer scenarios. Prior to joining MIT faculty in November 1999, Ted was an IBM fellow and directed the User Systems Ergonomics Research lab. He has served as a consulting professor at Stanford University, has taught at Hampshire, at the University of
Massachusetts at Amherst, and at Brown University. He has worked at Xerox PARC and Atari Research Labs.
and organizations on user-centered design solutions to research and development of technology projects. From 1991 through May 2005, Elizabeth was a Principal Research Scientist at Eastman Kodak Company, where she built the Boston Usability Lab—a
usability-engineering center of expertise at the Kodak Boston Software Development Center in Lowell, Massachusetts. In addition, Elizabeth has been involved with the Usability Professionals’ Association, where she has been on the Board of directors since 1999, is a recent Past President of UPA, and is the Director of World Usability Day. With 20 years of industry experience, Elizabeth frequently presents at national conferences, and has been a contributor to professional journals among them User Experience and interactions.
Anna Pandolfo is a Researcher who has been working at the MIT Media Lab since 2000. Her work in human factors has ranged from the impact ergonomics in technologies such as voting machines, social