Advanced Ceramics Progress
J o u r n a l H o m e p a g e : w w w . a c e r p . i r
Optical Characterization of BK7 Borosilicate Glasses Containing Different
Amounts of CeO
2F. Lak, M. Rezvani*
Department of Materials Science and Engineering, University of Tabriz, Tabriz, Iran
P A P E R I N F O
Paper history:
Received 17 February 2016
Accepted in revised form 10 December 2016
Keywords:
Borosilicate Glasses BK7 Glass CeO2
Optical Properties
A B S T R A C T
Borosilicate BK7 glasses doped with different amounts of CeO2 (0.5, 1, 1.5%) were prepared by the
convenient melting process. To study structural changes of samples, Fourier Transfer Infrared (FT-IR) and Raman spectroscopy were employed. The Differential Thermal Analysis (DTA) results exhibited addition of 0.5% cerium oxide has reduced Tg and also, according to the Urbach energy calculations,
has made an enhancement in the disorderness of the glass network. Actually by increasing NBOs, CeO2 played a glass modifier role. However, by adding 0.5-1.5% CeO2, Tg increase and Urbach energy
decrease could be the results of CeO2 network former role. The calculation of direct/indirect band gap
energy and Fermi energy level also indicated that by increasing the amount of dopant, the semiconducting characteristic of the glass became highlighted.
1. INTRODUCTION1
Among the variable glassy systems, an increasing interest has been devoted to the borosilicate glasses due to some appropriate properties such as high density, low thermal expansion, high softening temperature, high chemical stability and mechanical strength, and high refractive index [1, 2]. These properties may find many applications in optoelectronics, solar energy technology, micro electromechanical systems, etc. [3].
The BK7 borosilicate glass is a common optical glass for high quality optical components in the visible range, crown and relatively hard glasses with high homogeneity and also shows a good scratch resistance property. Another good feature that makes it promising in optical materials is the excellent transmittance through the visible and near infrared spectra down to 350 nm in the ultraviolet. Most of the optical windows, lenses, mirror substrates and prisms which are used in lasers are made of BK7 glasses [4].
For a long time BK7 glass has been a prime candidate as substrate for the fabrication of low-loss passive ion-exchanged glass waveguide devices used in optical signal processing. Recently rare earth doped BK7 glass substrate has received considerable attention because of its potential for the realization of active waveguide
1*Corresponding Author’s Email:[email protected] (M. Rezvani)
devices by conventional ion-exchange technique [5]. In modern technology rare earth ions have received much attention due to role of their active ions in optical materials having many absorption and emission bands arising from the transitions between the energy levels [3] and technological applications in various fields such as solid-state lasers, photonic, magneto optical devices, etc. [6]. Different rare-earth ions have been doped into these glasses with the aim of studying the luminescent and their up conversion properties [5, 7-11]. Among rare earth metals, Cerium doped glasses are the promising materials for photonic applications, because they exhibit 5d-4f emissions. It is used to make blue luminescent optical system [12, 13].
Some of the features that make it suitable for being doped in borosilicate glasses are radiation environment application [14] and sealant in solid oxide fuel cells [15]. However, there are not enough reports about the optical semiconducting behavior of these glasses which are doped with CeO2. Therefore, in this paper some optical properties of BK7 glasses, such as absorption and extinction coefficients, Fermi energy level, direct and indirect optical band gaps, and Urbach energy have been investigated in presence of different amounts of CeO2. Eventually, FT-IR and Raman spectroscopy of glasses were taken in order to get better understanding about the role of CeO2 dopant in the microstructure of the samples.
2. EXPERIMENTAL PROCEDURES
2.1. Materials and sample preparing
Glasses with the composition of 67.5 SiO2- 12B2O3- 9.5Na2O- 8.5K2O- 2.5BaO (wt.%) with different amounts of CeO2 dopant (0.5, 1, 1.5wt %) were prepared by normal melting process. Leached and high pure SiO2, high pure B2O3 (1303-62-2 Merck) and CeO2 (Sigma- Aldrich C8877) were used as starting materials. In order to introduce Na2O, K2O and BaO, respectively, Na2CO3 (106398), K2CO3 (104928) and BaCO3 (101714) produced by Merck Co. Germany with purities higher than 99.9 (wt %) were supplied. As2O3 (Merck 1001190100) and Sb2O3 (Acros 213471000) were also added to produce bubble-free samples. 50g of the batches were melted in zircon crucibles at 1320 ᵒC for 120 min. Normal casting process was done by using stainless steel molds preheated at 557 ᵒC. In order to release the internal stresses, annealing process was done at 557 ᵒC for 30 min and finally samples cooled down naturally to room temperature in the furnace.
2.2. X-Ray diffraction (XRD) patterns and differential thermal analysis (DTA)
In order to ensure that no crystallization has happened, XRD patterns were prepared by XRD Siemens D-500 instrument. The glass transition temperature (Tg) was determined with the rate of 10
C min
using DTA curves from DTG-60AH Shimadzu.2.3. Density and micro-hardness measurments Densities of the samples were measured using standard principle of Archimedes, according to:
1 1 2 w D w w (1)
where w1 is the sample’s weight in air and w2 is the weight in water. Molar volume of the glassy the samples was calculated as:
i m i M V D
(2)where Mi is the molar mass of glass and is obtained from:
i i i
M C A (3)
Ci and Ai are the molar concentration and the molecular weight of each component, respectively [16].
In order to study mechanical properties, micro-hardness of the samples was measured by applying 1N load for 15sec using Zwieck, Zhv10 German RoellCompany. 2.4. Fourier transform infrared (FT-IR) and raman spectroscopy FT-IR transmittance
spectra of the samples were measured at room temperature by Tensor 27 BrukerCompany instrument in the 400-4000cm-1 range, in order to study the structural changes. The powder form of each sample was mixed with KBr in 1:100(mg) ratio and then pressed. The resulted pellets were used for recording the FT-IR spectra. Also Raman spectroscopy was investigated in the 200-3500cm-1 range by Dispersive Raman Microscope, Senterra 2009 BrukerCompany.
2.5. UV-VIS spectra and optical properties
Optical transmittance of the samples in UV-VIS
spectrum range was carried out using a
spectrophotometer, Shimadzu 1700 instrument at room temperature.
According to the results obtained from transmittance spectra, absorption and extinction coefficients, Fermi energy level, direct and indirect optical band gaps, and Urbach energy of the samples were calculated.
2.5.1. Absorption, extinction, coefficient and Fermi energy level determination
In optics, absorption coefficient is a factor determining how far a light beam can penetrate through a medium before being completely absorbed [16].
The general formula to determine the absorption coefficient of a transparent glass according to Beer-Lambert law is given by:
0
1 I
ln d I
(4)
where α is the absorption coefficient and d is the thickness of the sample. I0 and I represent intensity of the light before and after penetration, respectively [17]. Extinction coefficient (k), the imaginary part of the complex index of refraction is given by:
k 4 (5)
where α is the absorption coefficient of the material and
λ is the wavelength of the incident photon.
Fermi level is defined as the top occupied energy level at 0 K absolute temperature [16].
According to stronger absorption of UV in comparison to visible photons, the Fermi energy level can be calculated by the Fermi-Dirac distribution function as:
F B
1 k( )
1 exp E E K T
(6)
where EF is Fermi energy, E is the photon energy, KB is
the Boltzmann constant
5 1
B
K 8.6173 10 ev.k
, and T
obtained from plotting k vs. hυ and least square fitting of the equation [18].
2.5.2. Calculation of direct and indirect optical band gaps Band gap is referred to energy difference between the top part of the valence band and the bottom of the conduction band. Band gap is the major factor determining the electrical conduction of solids. The optical band gap value is calculated using the following equation:
opt
ng 2 h E
h
(7)
where
E
gopt refers to the optical band gap, α isabsorption coefficient, hυ is the incident photon energy,
β is a constant related to the extent of the band tailing and n is the index which can have different values of 2,3, 1/2 and 1/3 corresponding to indirect allowed, indirect forbidden, direct allowed and direct forbidden transitions, respectively. The intercept of the line obtained by plotting (αhυ)1/n against photon energy (hυ) (Tauc’s plots) divided by slope, is equal to the energy band gap of the optical transitions. [19-21]
2.5.3. Urbach energy calculation Actually in many amorphous materials, variation of absorption coefficient with photon energy can be discussed in three different regions. The first region has almost constant absorption due to the exciting-phonon coupling. The second part is Tauc region with high absorption associated with inter band transitions and third part is Urbach region, near the band edge that shows an exponential dependence on photon energy.
The spectral dependence of absorption coefficient usually follows the so-called Urbach rule:
U
h exp
E
(8)where EU is the Urbach energy which indicates the width of the valence or conduction band tail states, hυ is the energy of incident photon, and β is a constant called Band Tailing parameter. Urbach energy has been calculated using least square fitting of ln(α) against hυ curves in the tailing part of localized states [16].
2.5.4. Refractive index The refractive indexes of samples were measured by a refractometer with sodium lamp (533 nm wavelength).
3. RESULT AND DISCUSSION
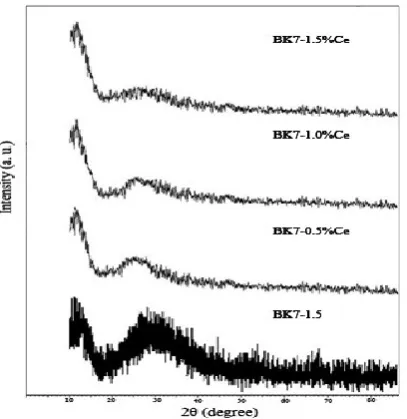
3.1. XRD and DTA results As shown in Figure 1. XRD patterns contain no crystallization peaks
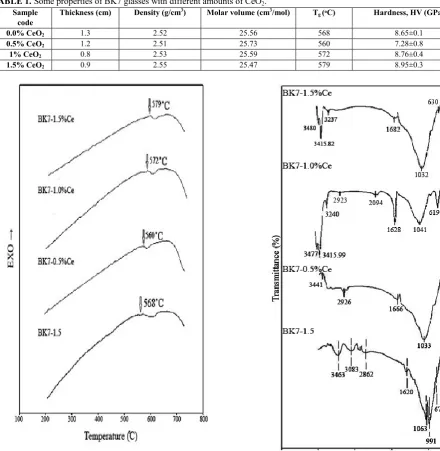
and the samples are fully amorphous. Figure 2. shows the DTA analysis results of the samples with different amounts of CeO2. As shown in the Table 1. adding 0.5 to 1.5% CeO2 provides a rise in the glass transition temperature. It seems that different amounts of Cerium oxide have different and maybe opposite roles in the glass structure. The amount of 0-0.5% plays the modifying role in the glass structure by increasing the non-bridging Oxygens (NBOs); but further addition of CeO2 (up to 1.5%) shows network forming role.
Figure 1. XRD patterns of BK7 glasses containing 0, 0.5,1 and 1.5% CeO2.
3.2. Denisty and micro-hardness of samples As already mentioned, samples densities were calculated by Archimedes principle and the results are summarized in Table 1. By adding Cerium ions, the density raises from 2.51 to 2.55 g/cm3. Also micro-hardness calculation shows that the less hard sample has more NBOs that are weaker parts of the network.
3.3. FT-IR and raman analysis results
the FT-IR spectrums show minor shift of the peaks and reduction of peaks intensity. These changes are attributed to structural changes which are associated with the variation of inter tetrahedral bands angles caused by addition of the dopant. The bands located in 1620-1682 cm-1 could be related to preparation process by KBr and stretching vibrations of water molecules and hydroxyl group are seen in 2000-3500 cm-1.
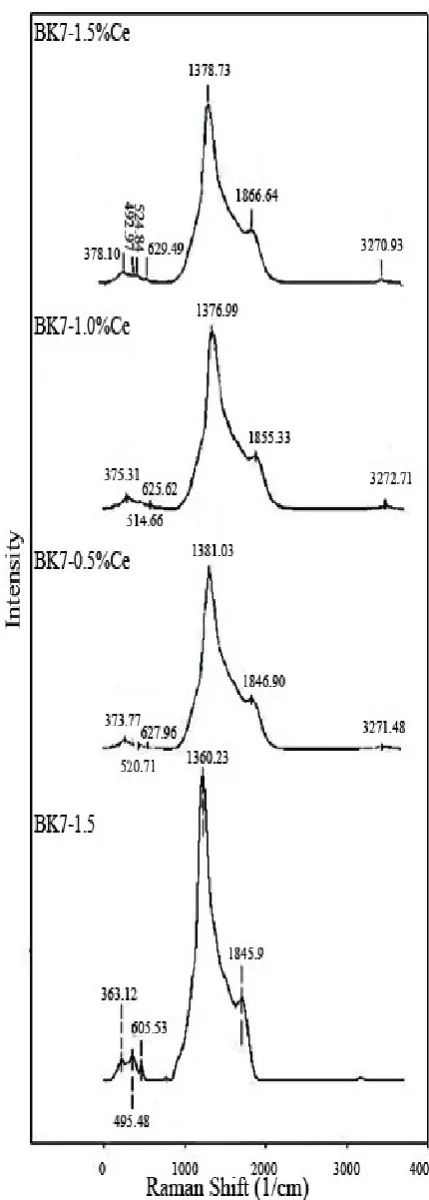
Raman spectra of samples are also illustrated in Figure 4. Peaks in the range of 370-380 cm-1 refer to the bending vibrations of Si-O-Si bonds. The peaks in 495-524 cm-1 are related to vibration and average angle of Si-O-Si connections. By adding 0-0.5% CeO2, due to
reduction of BOs and variation of boron atoms coordination number from 4 to 3 in the network, mentioned peak shifts to the higher wave numbers [22, 25]. Then rising from 0.5% to 1.5% causes to transfer that bond to lower wave numbers. Absorption band in 1370-1385cm-1 could be attributed to B-O stretching vibration in BO3 units and asymmetric vibration of SiO4- tetrahedral. Vibration of ceria is placed in 440-460 cm-1 [23, 26] which is not observable in low contents and just appeared in the sample containing 1.5% ceria. The vibrations of OH groups could be placed above the 1800cm-1.
TABLE 1. Some properties of BK7 glasses with different amounts of CeO2.
Sample code
Thickness (cm) Density (g/cm3) Molar volume (cm3/mol) T
g (ᵒC) Hardness, HV (GPa)
0.0% CeO2 1.3 2.52 25.56 568 8.65±0.1
0.5% CeO2 1.2 2.51 25.73 560 7.28±0.8
1% CeO2 0.8 2.53 25.59 572 8.76±0.4
1.5% CeO2 0.9 2.55 25.47 579 8.95±0.3
Figure 2. DTA diagrams of BK7 doped with different
amounts of CeO2. Figure 3. FT-IR spectra of BK7 glass doped with
3.4.Evaluation of optical constants
3.4.1. Absorption, extinction coefficients and determination of fermi energy level
UV-VIS transmittance spectra of BK7 glasses are presented in Figure 5. Cerium oxide shifts the absorption edge to higher wavelengths [27] and it is expected that the band gap energy would be reduced. As mentioned, by using Beer-Lambert law, the absorption coefficient is determined (Figure 6).
Then by applying Equation 5, extinction coefficient is also calculated (Figure 7). The Fermi-Dirac distribution function is used to determine Fermi energy level. The results are summarized in Table 2. The decrease in Fermi energy by adding dopant supports the idea of being a semiconductor.
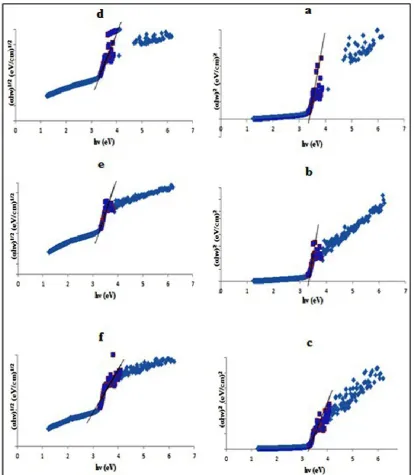
3.4.2. Direct and indirect optical band gap calculation As discussed in part 2.5.2. direct and indirect band gaps are calculated from the intercept of the obtained line divided by slope of Tauc’s
plot (
h
1n vs. photon energy) (Figure 8). Theresults are shown in Table 2. As expected, the band gap energy is reduced.
Figure 5. UV-VIS transmittance spectra of BK7 glasses.
Figure 6. Plot of Absorption coefficient versus wavelength for glasses with different amounts of CeO2.
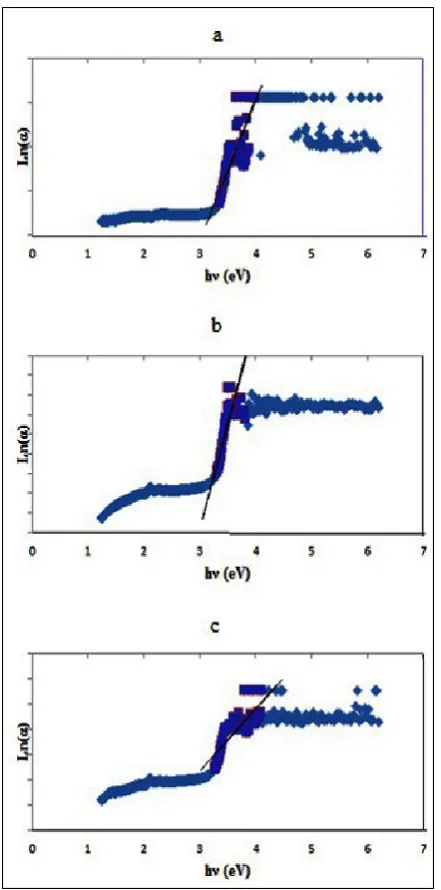
3.4.3. Urbach energy determination
The Urbach energy acts inversely with order of the network so reduction in NBOs and long range order of the network cause decrease in the Urbach energy amount from 0.61 to 0.25 eV. As concluded before, 0.5% CeO2 acts as a network modifier with higher Urbach energy compared with 0.5-1.5% CeO2 which plays network forming role. The data resulted from Figure 9. are summarized in the Table 2.
Figure 7. Functionality of k from Fermi-Dirac distribution function for BK7 glasses containing various amounts of CeO2
Figure 9. Determination of Urbach energy for glasses with a) 0.5%, b) 1%, and c) 1.5% CeO2.
3.4.4. Refractive index measurement
Refractive index of the glass shows an increase by further addition of CeO2 as a result of increasing the glass density.
TABLE 2. Optical properties of BK7 glass doped with different amounts of CeO2.
Sample code
EF
(eV) ED
(eV) EIn
(eV)
EU
(eV)
Refractive index
BK7 5.53 3.53 2.95 0.45 1.664
BK7-0.5Ce
5.35 3.38 2.72 0.61 1.647
BK7-1Ce
5.22 3.34 2.62 0.38 1.673
BK7-1.5Ce
5.07 3.26 2.25 0.25 1.675
4. CONCLUSION
BK7 glass with different amounts of CeO2 as a dopant prepared for investigating some physical and optical properties:
Due to the two-fold role of CeO2, density and Tg of the samples decreased by adding 0-0.5% CeO2 and then increased by adding 0.5-1.5% CeO2.
Structural studies showed that adding CeO2 have caused lower intensity in the asymmetric vibrations of NBOs and as a result former role of the dopant.
Fermi energy level is decreased in confirmation that semiconducting characteristics are increased.
Shift of the absorption edge to higher wavelengths compared to the base glass confirmed the reduction of the band gap from 3.53 to 3.26 eV.
Urbach energy first increased by adding 0-0.5% Ce and approved the network modifying role in that value and then played the former role oppositely.
REFERENCES
1. Mishra, R.K., Sudarsan, V., Kaushik, C.P., Raj, K., Kulshreshtha, S.K. and Tyagi, A.K., "Effect of BaO addition on the structural aspects and thermophysical properties of sodium borosilicate glasses", Journal of Non-Crystalline Solids, Vol. 353, (2007), 1612– 1617.
2. Yang, G., Möbus, G. and Hand, R.J., "Cerium and boron chemistry in doped borosilicate glasses examined by EELS", Micron, Vol. 37, No. 5, (2006), 433-441.
3. Rao, T.G.V.M., Rupesh Kumar, A., Neeraja, K., Veeraiah, N. and Rami Reddy, M., "Optical and structural investigation of Eu3+ ions in Nd3+ co-doped magnesium lead borosilicate glasses", Journal of Alloys and Compounds, Vol. 557, (2013), 209-217.
4. Jamshidi-Ghaleh, K. and Masalehdan, H., "Modeling of nonlinear responses in BK7 glass under irradiation of femtosecond laser pulses", Optical and Quantum Electronics,
Vol. 41, (2009), 47–53.
5. Wang, J., Mwarania, E.K., Lincoln, J.R., Feuchter, T., Brocklesby, W.S., Croudace, I.W., Payne, D.N. and Wilkinson, J.S., "Fluorescent lifetime of Er3+4I13/2 level in BK7 borosilicate
glass", Materials Letters, Vol. 14, (1992), 347-351.
6. Rao, T.G.V.M., Rupesh Kumar, A., Neeraja, K., Veeraiah, N. and Rami Reddy, M., "Optical and structural investigation of Dy3+–Nd3+ co-doped in magnesium lead borosilicate glasses", SpectrochimicaActa Part A: Molecular and
Biomolecular Spectroscopy, Vol. 118, (2014), 744-751.
7. Wong, E.M.W., Man, S.Q., Pun, E.Y.B. and Chug, P.S., "Er3+/Yb3+ co-doped BK-7 glass optical amplifier", IEEE
Xplore, (1999), 26-29.
8. Ljungstrom, A.M., "Self-Writing Waveguides in glass: Experimental and numerical investigation, (2003), 237. 9. Chen, W., Mingying, P., Luyun, Y., Ning, D., Danping, C.,
Congshan, Z. and Jianrong, Q., "Upconversion Luminescence of Ce3+ Doped BK7 Glass by Femtosecond Laser Irradiation",
Journal of Rarearths, Vol. 24, (2006), 754 - 756.
(2008), 7073–7078.
11. Annapurna, K., Dwivedi, R.N., Kundu, P. and Buddhudu, S., "Blue emission spectrum of Ce3+: ZnO-B2O3-SiO2 optical glass", Materials Letters, Vol. 58, No. 5, (2004), 787-789.
12. Annapurna, K., Dwivedi, R.N., Kundu, P., Buddhudu, S., "Blue emission spectrum of Ce3+:ZnO-B
2O3-SiO2 optical glass",
Materials Letters, Vol. 58, (2004), 787
13. Pal Singh, G. and Singh, D.P., "Modification in structural and optical properties of CeO2 doped BaO–B2O3 glasses", Journal
of Molecular Structure, Vol. 1012, (2012), 137-140.
14. Deshpande, V.K. and Taikar, R.N., "Effect of cerium oxide addition on electrical and physical properties of alkali borosilicate glasses", Materials Science and Engineering: B, Vol. 172, No. 1, (2010), 6-8.
15. Sasmal, N., Garai, M. and Karmakar, B., "Influence of Ce, Nd, Sm and Gd oxides on the properties of alkaline-earth borosilicate glass sealant", Journal of Asian Ceramic Societies,
Vol. 4, No. 1, (2016), 29-38.
16. Shakeri, M. S. and Rezvani, M., "Optical Propertries and Structural Evaluation of Li2OAl2O3- SiO2- TiO2 Glassy
Semiconductor Containing Passive Agent CeO2",
SpectroChimia Acta A, Vol. 83, (2011), 592- 597.
17. Babanejad, S.A., Ashrafi, F., Salarzadeh, N. and Ashrafi, E., "Study the Optical properties of Amorphous Structure (Glassy) of B2O3-CdO Binary System", Advances in Applied Science
Research, Vol. 3, (2012), 743-748.
18. Farahinia, L., Rezvani, M. and Alahgoliyan, E., "Optical characterization of oxyfluoride glasses containing different amounts of K2O additive", Material Research Bulletin, Vol. 70, (2015), 461-467.
19. Mott, N.F. and Davis, E.A., "Electronic Processes in Nanocrystalline Materials", Clarendon press, Oxford, 1971.
20. Abdel-Baki, M., El-Diasty, F. and Abdel-Wahab, F.A., "Optical characterization of xTiO2(60x)SiO2–40Na2O glasses: II.
absorption edge, fermi energy level, electronic polarizability and optical basicity", Optics Communications, Vol. 261, (2006), 65–70.
21. El-Kameesy, S.U., Eissa, H.M., Eman, S.A. and El-Gamma, Y.A., "Fast neutron irradiation effect on some optical properties of lead borate glass doped with Samarium oxide", Egyptian
Journal of Basic and Applied Sciences, Vol. 49, (2011), 67–
70.
22. Singh, G.P., Kaur, S., Kaur, P. and Singh, D.P., "Modification in structural and optical properties of ZnO, CeO2 doped Al2O3–
PbO–B2O3 glasses", Physica B: Condensed Matter, Vol. 407,
No. 8, (2012), 1250-1255
23. El-Deen, L.M.S., Al Salhi, M.S. and Elkholy, M.M., "IR and UV spectral studies for rare earths-doped tellurite glasses",
Journal of Alloys and Compounds, Vol.465, No. 1, (2008),
333-339.
24. Parvulescu, V.I. and Tiseanu, C., "Local structure in CeO2 and
CeO2–ZrO2 nanoparticles probed by Eu luminescence",
Catalysis Today, Vol. 253, (2015), 33-39.
25. Abdel-Baki, M., Abdel-Wahab, F.A., Radi, A. and El-Diasty, F., "Factors affecting optical dispersion in borate glass systems", Journal of Physics and Chemistry of Solids, Vol. 68, No. 8, (2007), 1457-1470.
26. Bosco, M.V., Banares, M. A., Martínez-Huerta, M.V., Bonivardi, A.L. and Collins, S. E., "In situ FTIR and Raman study on the distribution and reactivity of surface vanadia species in V2O5/CeO2catalysts, Journal of Molecular Catalysis
A: Chemical, Vol. 408, (2015), 75-84.
27. Wang, Z. and Cheng, L., "Effects of doping CeO2/TiO2 on structure and properties of silicate glass", Journal of Alloys and