PUBs for engineering purpose: Framework Development
and Case Study
Yang Zhiyong1, Gao Xichao1, Liu Jiahong1
1 China Institute of Water Resources and Hydropower Research, Beijing 100000,
China
Abstract. A framework of predictions in ungauged basins (PUBs, taking Paniai lakes watershed, Indonesia as an example) for hydropower exploration is developed. In this framework, remote sensing technology and similar watershed method are used to collect necessary meteorological and topographical data for runoff simulation. Besides, a modified physical based distributed hydrological model is developed to consider the characteristics (regulation capacity of the lakes) of the watershed. Finally, considering the modeling purpose, annual average runoff index is used to assess the modeling results. In the case study (Paniai lakes watershed), TRMM precipitation, HWSD soil type, and AVHRR landcover data, combined with meteorological data from two similar watersheds, are collected to drive the modified hydrological model. According to the model results, the simulated potential evapotranspiration capacities and annual average runoff coefficients are consistent between the two cases (modeling with meteorological data of the two similar watersheds), and the simulated annual average runoff coefficients of the two cases are basically consistent with the observed annual average runoff coefficient of another similar watershed located in Indonesia.
Keywords: Regional characteristics, Hydrological simulation, Ungauged areas
1 Introduction
Numerical modeling is widely used in exploring hydrological processes in many sectors such as flood forecasting[1, 2], water resources assessment[3, 4], and projection of climate change impact[5-8]. With the development of water resources exploration, more and more hydrological modeling is needed in ungauged basins[9-11]. Many methods have been developed for predictions in ungauged basins (PUBs). Among these approaches, regression, spatial proximity, and physical similarity approaches are widely used[12-14]. The main idea of this methods is to transfer
Engineering
EPiC Series in Engineering
Volume 3, 2018, Pages 2449–2456
HIC 2018. 13th International Conference on Hydroinformatics
model parameters from gauged basins to ungauged basins[13]. What is more, the development of remote sensing methods makes the predictions in ungauged basins more feasible[15-18].
However, most researches of PUBs are from a perspective of science, focusing on how to simulate the hydrological process more accurate[19, 20]. In this study, an object-oriented framework has been developed for PUBs in engineering sectors, in which prediction purpose is considered as well as natural characteristics of basins.
2 Material and methods 2.1 Study area
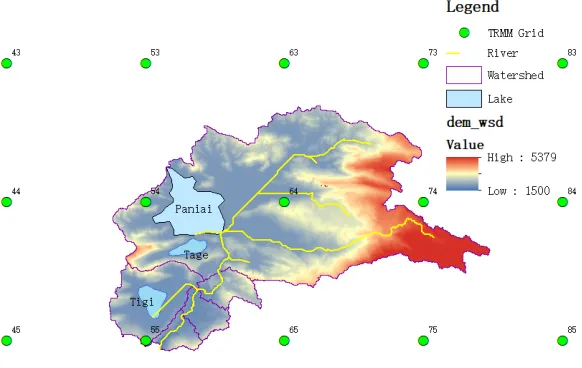
A mountainous watershed - Paniai lakes watershed in Indonesia - is adopted for the application study. The watershed is located in the Paniai Regency in the central highlands of West Papua province, Indonesia. The total area of the watershed is 1939km2 with the elevation varying from 1500 to 5379 meters. Paniai lakes consist
of three large freshwater lakes Paniai, Tigi, and Tage. Among those lakes, Paniai lake is the largest lake in this watershed. Its surface area is 154km2 and the
maximum depth is 44 meters (Figure 1).
Figure 1. study area.
2.2 Methodology
Since the area is lack of necessary meteorological and topographical materials, remote sensing technology is used. The Tropical Rainfall Measuring Mission(TRMM) daily precipitation data, Harmonized World Soil Database(HWSD) soil type data, and Advanced Very High-Resolution Radiometer(AVHRR) landcover data from University of Maryland are used to simulate the runoff of this watershed. PUBs for Engineering Purpose: Framework Development and Case Study Y. Zhiyong et al.
Besides, annual TRMM precipitation data are calibrated according to observed annual precipitation data from the report of Rainfall in New Guinea. With regard to potential evapotranspiration (PET), considering uncertainty, we select two meteorologically and topographically similar basins (here called case1 and case2 ) with relatively comprehensive data to offer necessary data such as the maximum and minimum temperature, relative humidity, and wind speeds to calculate the potential evapotranspiration of the studied watershed.
The lakes have the strong regulation capacity to the outlet discharge of the watershed. Considering this characteristic, an advanced physical-based distributed model based on Swat is developed. The watershed is divided into 5 subbasins (Figure 1) with sub-area ranging from 43 to 1584km2 to consider the meteorological and topographical
distribution. Because the purpose of this study is to evaluate runoff volume for followed hydropower development and the lakes could diminish the variation of the runoff, annual average runoff coefficient is used to assess the modeling results, compared that of another similar watershed.
3 Results and discussion 3.1 Data collection
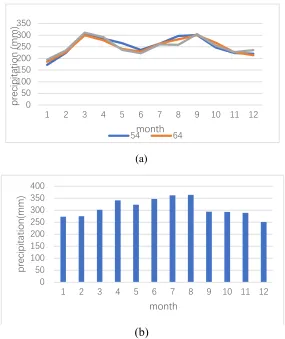
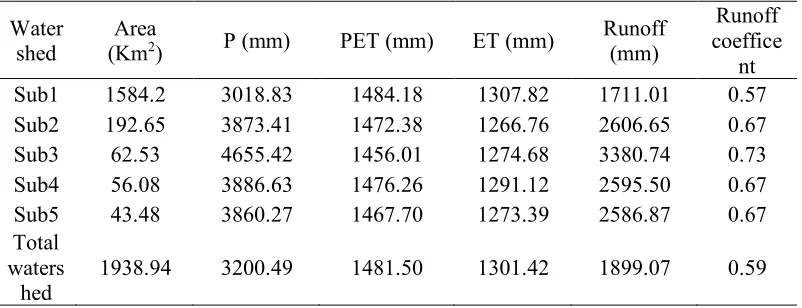
Daily precipitation data (2001-2016) are got from TRMM. There are 15 TRMM grids in this watershed (Figure1). the annual TRMM precipitation and grid positions are shown in table 1 and the annual precipitation and multi-year monthly average precipitation process for three typical grids (73, 74 and 75) are also given (Figure2, Figure3). The annual average precipitation in this area range from 3000 to 5200mm with no obvious spatial distribution pattern. From the perspective of yearly and monthly precipitation processes, the temporal distribution patterns are relatively consistent with each other for these three selected typical grids. Besides, 10 years meteorological data including daily precipitation, daily maximum temperature, daily minimum temperature, daily average temperature, daily mean relative humidity and daily mean wind speed are collected from airport meteorological station of Paniai County. Because spatial distribution of meteorological data cannot be considered with only a station, these observations are used to calibrate the data got from remote sensing and/or other hydrological similar basins. The multi-year monthly precipitation from Paniai airport meteorological station is shown in figure 3. The result shows that the TRMM precipitation data is relatively accurate.
9 landcover patterns are founded in this watershed, with woodland, evergreen broadleaf forest, and water accounting for 46.96%, 20.86% and 11.90% of the total watershed. Besides, there are 3 soil classes including water in this watershed with sand accounting for 75% of the total watershed.
PUBs for Engineering Purpose: Framework Development and Case Study Y. Zhiyong et al.
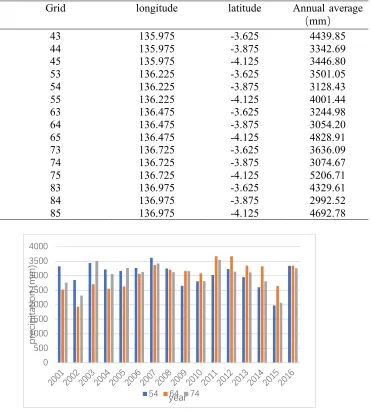
Table 1. TRMM grids distribution and multi-year annual precipitation
Grid longitude latitude Annual average
(mm)
43 135.975 -3.625 4439.85
44 135.975 -3.875 3342.69
45 135.975 -4.125 3446.80
53 136.225 -3.625 3501.05
54 136.225 -3.875 3128.43
55 136.225 -4.125 4001.44
63 136.475 -3.625 3244.98
64 136.475 -3.875 3054.20
65 136.475 -4.125 4828.91
73 136.725 -3.625 3636.09
74 136.725 -3.875 3074.67
75 136.725 -4.125 5206.71
83 136.975 -3.625 4329.61
84 136.975 -3.875 2992.52
85 136.975 -4.125 4692.78
Figure 2. annual precipitation process. 0 500 1000 1500 2000 2500 3000 3500 4000 200 1 200 2 200 3 200 4 200 5 200 6 200 7 200 8 200 9 201 0 201 1 201 2 201 3 201 4 201 5 201 6 pr ec ipi ta ti o n ( m m ) year
54 64 74
PUBs for Engineering Purpose: Framework Development and Case Study Y. Zhiyong et al.
(a)
(b)
Figure 3. multi-year monthly precipitation process(a: TRMM data, b: observed data).
3.2 Modeling result
16 years daily runoff (2001-2016) is modeled based on the materials mentioned above. Considering our purpose (assessing runoff volume for hydropower development) of this study and characteristics (regulation capacity of large lakes, relatively average monthly precipitation process) of the watershed, only annual average water balance relationship of sub-watersheds for the two cases are analyzed. The results of Table 2 and Table 3 reveal very small differences of PET, actual evapotranspiration (ET), and runoff coefficient between case 1 and case 2. The PET, ET, and runoff coefficient of both the two cases are around 1450mm, 1300mm, and 0.60, respectively. Moreover, model results are verified through comparing simulated annual runoff coefficients of the two cases to observed runoff coefficient of another similar watershed. It can be shown that the simulated annual average runoff coefficients (0.60 for case 1 and 0.59 for case 2) are almost the same with the observed annual average runoff coefficient (0.62), demonstrating the validity of the simulation.
0 50 100 150 200 250 300 350
1 2 3 4 5 6 7 8 9 10 11 12
pr
ec
ipi
ta
ti
o
n
(
m
m
)
month
54 64
0 50 100 150 200 250 300 350 400
1 2 3 4 5 6 7 8 9 10 11 12
pr
ec
ipi
ta
ti
o
n
(m
m
)
month
PUBs for Engineering Purpose: Framework Development and Case Study Y. Zhiyong et al.
Table 2. water balance relationship (case 1)
Water shed
Area(km
2) Precipitation (mm) PET (mm) ET (mm) Runoff (mm)
Runoff coefficie
nt
Sub1 1584.2 3018.83 1456.58 1292.44 1726.39 0.57
Sub2 192.65 3873.41 1444.59 1252.19 2621.22 0.68
Sub3 62.53 4655.42 1428.70 1258.9 3396.52 0.73
Sub4 56.08 3886.63 1448.35 1274.29 2612.34 0.67
Sub5 43.48 3860.27 1440.02 1257.35 2602.92 0.67
Total waters hed
1938.94 3200.49 1453.88 1286.05 1914.44 0.60
Table 3. water balance relationship (case 2)
Water shed
Area
(Km2) P (mm) PET (mm) ET (mm) Runoff (mm)
Runoff coeffice
nt
Sub1 1584.2 3018.83 1484.18 1307.82 1711.01 0.57
Sub2 192.65 3873.41 1472.38 1266.76 2606.65 0.67
Sub3 62.53 4655.42 1456.01 1274.68 3380.74 0.73
Sub4 56.08 3886.63 1476.26 1291.12 2595.50 0.67
Sub5 43.48 3860.27 1467.70 1273.39 2586.87 0.67
Total waters hed
1938.94 3200.49 1481.50 1301.42 1899.07 0.59
4 Conclusions
With the development of hydropower in developing countries and districts, we are facing more and more hydrological prediction problems because of a shortage of information. In this study, a systematical analysis framework to predict hydrological process in ungauged areas is developed. A distributed physical based hydrological model considering the characteristics of the watershed is developed. Besides, remote sensing technology and similar watershed methods are used to collect necessary materials to drive the hydrological model. An assessment system according to the characteristics of the watershed and the simulation purpose is also suggested. Finally, a case study is performed and the results show that the framework works well.
Reference
PUBs for Engineering Purpose: Framework Development and Case Study Y. Zhiyong et al.
[1] Abdulrazzak, M., et al. Integrating Hydrological and Hydraulic Modelling for Flood Risk Management in a High Resolution Urbanized Area: Case Study Taibah University Campus, KSA. in Euro-Mediterranean Conference for Environmental Integration. 2017. [2] Wu, J., G. Lu, and Z. Wu, Flood forecasts based on multi-model ensemble precipitation
forecasting using a coupled atmospheric-hydrological modeling system. Natural Hazards, 2014. 74(2): p. 325-340.
[3] Abbaspour, K.C., et al., A continental-scale hydrology and water quality model for Europe: Calibration and uncertainty of a high-resolution large-scale SWAT model. Journal of Hydrology, 2015. 524: p. 733-752.
[4] Krysanova, V. and M. White, Advances in water resources assessment with SWATâ ”an overview. International Association of Scientific Hydrology Bulletin, 2015. 60(5): p. 771-783.
[5] Schewe, J., et al., Multimodel assessment of water scarcity under climate change. Proceedings of the National Academy of Sciences, 2014. 111(9): p. 3245-3250.
[6] Haddeland, I., et al., Global water resources affected by human interventions and climate change. Proceedings of the National Academy of Sciences, 2014. 111(9): p. 3251-3256.
[7] Elliott, J., et al., Constraints and potentials of future irrigation water availability on agricultural production under climate change. Proceedings of the National Academy of Sciences, 2014. 111(9): p. 3239-3244.
[8] Hattermann, F., et al., Cross-scale intercomparison of climate change impacts simulated by regional and global hydrological models in eleven large river basins. Climatic Change, 2017. 141(3): p. 561-576.
[9] de Lavenne, A., et al., Do good simulation performances at gauged stations mean good semi-distributed hydrological model? An analysis for prediction in ungauged basins. 2018.
[10] Atieh, M., et al., Prediction of flow duration curves for ungauged basins. Journal of hydrology, 2017. 545: p. 383-394.
[11] Hailegeorgis, T.T. and K. Alfredsen, Regional statistical and precipitation–runoff modelling for ecological applications: prediction of hourly streamflow in regulated rivers and ungauged basins. River Research and Applications, 2017. 33(2): p. 233-248. [12] Yadav, M., T. Wagener, and H. Gupta, Regionalization of constraints on expected
watershed response behavior for improved predictions in ungauged basins. Advances in Water Resources, 2007. 30(8): p. 1756-1774.
[13] Goymann, W. and I.T. Moore, Comparison of regionalization approaches based on regression and similarity for predictions in ungauged catchments under multiple hydro-climatic conditions. Journal of Hydrology, 2012. s 466–467(21): p. 37-46.
[14] Ragettli, S., et al., Modeling flash floods in ungauged mountain catchments of China: A decision tree learning approach for parameter regionalization. Journal of Hydrology, 2017.
[15] Engman, E.T. and R.J. Gurney, Remote sensing in hydrology. 1991: Chapman and Hall London.
[16] Schmugge, T.J., et al., Remote sensing in hydrology. Advances in water resources, 2002. 25(8-12): p. 1367-1385.
[17] Wagner, W., et al., Operational readiness of microwave remote sensing of soil moisture for hydrologic applications. Hydrology Research, 2007. 38(1): p. 1-20.
PUBs for Engineering Purpose: Framework Development and Case Study Y. Zhiyong et al.
[18] Kittel, C., et al. Informing a hydrological model of the Ogooué with multi-mission remote sensing data. in EGU General Assembly Conference Abstracts. 2017.
[19] Pool, S., D. Viviroli, and J. Seibert, Prediction of hydrographs and flow-duration curves in almost ungauged catchments: Which runoff measurements are most informative for model calibration? Journal of Hydrology, 2017. 554: p. 613-622.
[20] Koçyiğit, M.B., H. Akay, and A.M. Yanmaz, Effect of watershed partitioning on hydrologic parameters and estimation of hydrograph of an ungauged basin: a case study in Gokirmak and Kocanaz, Turkey. Arabian Journal of Geosciences, 2017. 10(15): p. 331.
PUBs for Engineering Purpose: Framework Development and Case Study Y. Zhiyong et al.