VOLUME 36, ARTICLE 14, PAGES 427−454
PUBLISHED 27 JANUARY 2017
http://www.demographic-research.org/Volumes/Vol36/14/ DOI: 10.4054/DemRes.2017.36.14
Research Article
Unrealized fertility: Fertility desires at the end
of the reproductive career
John B. Casterline
Siqi Han
©2017 John B. Casterline & Siqi Han.
This open-access work is published under the terms of the Creative Commons Attribution NonCommercial License 2.0 Germany, which permits use, reproduction & distribution in any medium for non-commercial purposes, provided the original author(s) and source are given credit.
1 Introduction 428
2 Background and concepts 429
2.1 Research on unrealized fertility in Europe and North America 429
2.2 What is meant by unrealized fertility? 431
3 Data and methods 432
3.1 Sample 432
3.2 Indicators of unrealized fertility 433
3.3 Covariates of unrealized fertility 436
3.4 Regression modeling 437
4 Results 437
5 Summary and concluding comments 446
6 Acknowledgments 449
Unrealized fertility:
Fertility desires at the end of the reproductive career
John B. Casterline1 Siqi Han2
BACKGROUND
‘Unrealized fertility’ is a failure to achieve desired fertility. Unrealized fertility has been examined in low-fertility societies but, with the exception of research on infertility, has been neglected in research on non-Western societies.
OBJECTIVE
We conduct a multicountry investigation of one form of unrealized fertility, namely a reproductive career which ends with the woman desiring further children.
METHODS
We analyze 295,854 women aged 44‒48 in 252 surveys (DHS, RHS, PAP) conducted in the period 1986–2015 in 78 countries. Two indicators of unrealized fertility are constructed: (i) a comparison of ideal versus actual number of children; (ii) the desire for another child. We estimate multilevel regressions with covariates at individual and aggregate levels.
RESULTS
Unrealized fertility is far more prevalent according to the first indicator than the second. It is more common among women with fewer living children and women whose first birth occurs after age 20, and it is distinctly higher in sub-Saharan Africa and lower in South Asia. The evidence on trend over the course of fertility transition is mixed: for the second indicator but not the first, the net effect is a reduction in the prevalence of unrealized fertility as fertility declines.
CONCLUSIONS
Unrealized fertility occurs frequently in most societies and therefore deserves more rigorous research, especially on its consequences for emotional, social, economic, and demographic outcomes.
CONTRIBUTION
We provide the first comprehensive documentation of the prevalence of unrealized fertility across a broad set of contemporary non-Western societies.
1
Ohio State University, USA. E-Mail:[email protected].
1. Introduction
Classifying observed fertility as intended or unintended is a well-established practice in demographic research. Most often this entails a comparison of realized fertility, usually birth by birth, with stated fertility desires; a number of approaches have been employed (Casterline and El-Zeini 2007).
Comparison of realized fertility with fertility desires can uncover a third phenomenon which has hardly been examined in the demographic literature on non-Western societies, namely a failure to reach fertility goals. We term this ‘unrealized fertility.’ One fundamental form of unrealized fertility, and the focus of this research, is a reproductive career which ends with the woman still desiring further children: that is, a failure to achieve quantum goals. There can be comparable failures in birth timing: that is, births occurring later than intended. Neither of these phenomena – falling short of the desired number of children and having births later than intended – has received much attention in the extensive body of empirical research on fertility in Asia, Africa, and Latin America which brings together information on fertility and fertility desires. Instead, the focus has been entirely on births which did occur, classified as intended or unintended, rather than births which were desired but did not occur.3 But if fertility desires are taken seriously, then the latter too is a possible reproductive experience.
By contrast, research on fertility in Western societies has been attentive to this phenomenon. The question most commonly posed is, does subreplacement fertility at the aggregate level reflect successful achievement of individual-level fertility desires or a falling short of desired fertility? The answer to this question has direct implications for the formulation of policies intended to raise fertility (Harknett and Harnett 2014). Both aggregate-level and individual-level analyses, the latter typically longitudinal, have examined this question and we review a selection of the literature in the next section.
In this paper we begin to redress the gap in the literature on fertility outside the West through a multicountry examination of unrealized fertility at the end of the reproductive career. We offer a descriptive portrait drawing on national demographic survey data for 78 countries in Asia, Africa, and Latin America. The portrait is based on two separate measures of unrealized fertility, as discussed below; both are measures of unrealized fertility quantum. While this is principally a descriptive exercise, we do examine covariation of unrealized fertility with a small set of demographic variables, namely:
3
• Woman’s number of living children – are women with fewer children more likely to have fallen short of their childbearing goals?
• Woman’s age at first birth – are women who started their reproductive career later more likely to have fallen short of their childbearing goals?
• Country-level fertility – does the prevalence of unrealized fertility change over the course of fertility decline?
• Geographic region – is unrealized fertility more characteristic of reproductive regimes in certain regions as compared to others?
We obtain differentials according to this set of variables via multilevel regressions, generating patterns of differentials which are adjusted for other variables in the set.
To our knowledge, this is the first multicountry analysis of unrealized fertility in middle- and low-income countries outside of the West and East Asia.
2. Background and concepts
2.1 Research on unrealized fertility in Europe and North America
in the present paper relies on comparison of desired and attained fertility at the individual level.
The bulk of the pertinent research at the individual level relies on longitudinal measurement, with desires or intentions at an earlier time compared to later childbearing.4 Most often the observation period is relatively short, namely less than ten years. Recent examples are Régnier-Loilier and Vignoli (2011) on France and Italy (three years), Harknett and Hartnett (2014) on France, Germany, and the Netherlands (three years), and Spéder and Kapitány (2009) on Hungary (also three years). Occasionally the data permits longer observation. One notable example is Noack and Østby (2002) on Norway (20 years). Other studies contain a mix of short-term and long-term observation, such as Iacovou and Tavares’s (2011) analysis of the British Household Panel Survey (1991‒2007). Whether the observation period is relatively short or long, the common finding in these and other empirical analyses on European societies is that while a negative intention (do not intend to have another child) is highly predictive of future fertility behaviors, a positive intention (intend to have another child) is not. That is, for one reason or another a substantial subset of women falls short of fertility goals. For example, in Harknett and Harnett’s (2014) aggregate-level analysis of 22 countries over the period 2004‒2007, the aggregate fertility achievement rate – ratio of proportion of women having a birth to proportion intending to have a birth – was 61%, meaning 39% unrealized fertility.
A detailed set of studies on the United States by Morgan and collaborators deserves special mention (Quesnel-Vallée and Morgan 2003; Hagewen and Morgan 2005; Morgan and Rackin 2010). These pieces examine the correspondence between women’s expressed goals early in their reproductive career (early 20s) and attained fertility toward the end of their reproductive career (early 40s). Morgan and collaborators document that the majority of women fail to meet their early-career intentions, with the proportions underachieving and overachieving being of roughly the same magnitude (although the proportion underachieving is somewhat larger in most comparisons, with important variations by social and economic subgroups).5
Many studies have explored the reasons why women fall short of desired fertility. There are two general classes of explanation, although they are closely related and ultimately not separable. One class is competing preferences: Women wish to have a certain number of children but this is incompatible with other life goals which have precedence, such as educational goals, employment goals, aspirations for material
4
There are, however, some pieces which examine the gap between desired and actual fertility in the cross-section, either for simple descriptive purposes or, more often, to model determinants. Examples are van Peer’s (2002) analysis of FFS data for nine European countries and Adsera’s (2006) analysis of the Spanish Fertility Survey (1985, 1999).
5
comfort (e.g., housing), and leisure/recreational goals. The compatibility of employment and childbearing, itself a function in part of contextual labor market and family policy factors, is a central preoccupation in this literature (e.g., Bratti and Tatsiramos’s 2012 analysis of ECHP data for ten European countries). In a deeper sense, this class of explanation raises fundamental questions about what is meant by unrealized fertility: If women give precedence to other goals, is it correct to conclude that they have failed in their pursuit of childbearing goals? Our stance is that when preferences compete and one set loses, the losing preferences can nevertheless be regarded as valid and the loss as genuine.
The other class of explanation for unrealized fertility focuses on ‘running out of time.’ This can occur because priority is placed on first fulfilling the goals just listed (hence the inseparability of these two classes of explanation), or because of partnership dynamics, or incorrect assumptions about the age at which infecundity will set in (see discussion in Billari et al. 2007).
By contrast to this extensive literature on unrealized fertility (of various forms) in Europe and North America, we have located just a few empirical studies of unrealized fertility in non-Western settings. One is Barden-O’Fallon (2005), a qualitative investigation in rural Malawi, and a second is Ibisomi et al. (2011), a quantitative investigation in Nigeria. These are relatively localized context-specific studies, whereas the present study is multicountry. In other respects, in particular how unrealized fertility is defined, these studies differ radically from the present study. A third piece, by de Carvalho, Wong, and Miranda-Ribeiro (2016), is a country study (Brazil) relying on national survey data; in its aims and research design it closely resembles the present study.
2.2 What is meant by unrealized fertility?
consistent with the woman’s achieved fertility. While both upward and downward revision is observed, the more common phenomenon in Europe and North America is downward revision, so that comparison of stated fertility desires in a woman’s 40s as compared to stated goals in her 20s suggests a lower prevalence of unrealized fertility (e.g., Hagewen and Morgan 2005; Iacovou and Taveres 2011; Liefbroer 2009).
In this paper, as will be specified in the next section, we compare fertility desires and attained fertility of women in their mid-40s, assuming that these women have completed their childbearing (almost certainly the case for the vast majority). We make no comparison with fertility desires held at early ages, because there are no measures of such desires in the cross-sectional data which we analyze. While this is but one of many assessments of unrealized fertility which in principle could be carried out, it seems plausible that this assessment is especially pertinent – it seems likely that mid-40s is a moment in the life course when women take stock of their childbearing career and make a judgment about whether their aspirations have been fulfilled or not. And, further, this will be a moment when judgment of falling short carries special weight, emotional and otherwise, as it will be accompanied by a recognition that the physiological capacity to rectify this outcome has ended.
It should be noted that fertility goals can be sex-specific – that is, desired numbers of boys and girls – and hence unrealized fertility can be sex-specific. The present analysis does not make this distinction, but no doubt it has a bearing on our results. The two indicators of unrealized fertility which we employ are differentially sensitive to sex-specific fertility desires, as we discuss below.
3. Data and methods
3.1 Sample
We analyze 252 surveys conducted in 78 countries from 1986 to 2015. Most of these surveys were part of three major demographic survey programs: Demographic and Health Surveys (DHS), Reproductive Health Surveys (RHS), and the Pan-Arab Program (PAP). The large number of surveys and their range (geographically and historically) are features of this research which set it apart from most contemporary cross-national research projects, many of which make use of only DHS data. Given our goal to establish a descriptive foundation for the phenomenon of unrealized fertility, the breadth of coverage of the survey data we analyze is a particular strength of this research.
of 43. Note that we exclude age 49 because of the known tendency for women of actual age 49 to be erroneously reported as age 50; arguably this also affects sample representation at 48 and 47, but almost certainly to a lesser extent. The pooled sample consists of 295,854 individual women. Not all of them contribute to every component of the analysis. Most importantly, in some surveys the fertility preference item – the basis for one of our two indicators – is only asked of women currently in a union.
3.2 Indicators of unrealized fertility
We construct two indicators of unrealized fertility, derived from two attitudinal items which are worded identically in all three of the survey programs (RHS and PAP were launched after DHS and adopted the DHS design for these items). The first indicator is based on the ideal number of children item: “If you could go back to the time you did not have any children and could choose exactly the number of children to have in your whole life, how many would that be?” Comparison of responses to this item with the respondent’s number of living children is the basis for the first indicator of unrealized fertility: Women whose ideal number exceeds their number of living children are classified as having unrealized fertility.6
Some women do not provide a numeric response to the ideal number of children item, instead volunteering various nonnumeric responses (the best known being “up to God”) or no response at all. Our treatment of these women is based on a principle of requiring positive evidence of unrealized fertility – that is, positive evidence of wanting more children – and therefore by design they are not allowed to have unrealized fertility. In most surveys these two categories of response (nonnumeric and missing) are rare – less than 10% of women in about one-half of the 252 surveys. But in a subset of surveys such responses are rather common – 25% or more of the women in about one-sixth of the surveys. These surveys are concentrated in the Arab countries of West Asia and North Africa, and this response has become less common over time (as documented and analyzed in Frye and Bachan forthcoming). This feature of the first indicator of unrealized fertility – nonnumeric and missing responses – is a clear limitation of this indicator.7
6
An alternative version of this indicator uses number of children ever born rather than number of living children. We have constructed this alternative and performed some descriptive analysis. Because the number of living children must equal or fall short of the number of children ever born, this alternative indicator necessarily shows lower prevalence of unrealized fertility. In the end we choose to rely on number of living children in order to conform with existing practice, most notably the “Lightbourne method” (Lightbourne 1985) for estimating unwanted fertility, which has been used by DHS for several decades.
7
The second indicator relies on the prospective preferences item: “Would you like to have (a/another) child, or would you prefer not to have any (more) children?” This item in itself provides an indicator of unrealized fertility: that is, women aged 44‒48 who state that they want another child. Measurement issues with this item include: (i) not measured for women out of a union in many surveys; (ii) “unable to get pregnant” (i.e., infecund) as a response category; (iii) uncertain and not-stated categories.
Issue (i): We simply exclude women not asked the item. This results in exclusion of divorced/separated and widowed women in about 40% of the surveys. Women in these marital states constitute about 15% on average of women aged 44‒48 in the surveys in which the prospective preference item is not asked of such women.8
Issue (ii): We exclude infecund women from all analysis and calculations. This is tantamount to assuming that infecundity is random with respect to fertility preferences.
Issue (iii): Women who are “uncertain” are not classified as wanting another child; these women constitute 3% of the sample.9 Women who are “not stated” are excluded from all analysis and calculations.
Stepping back, we can speculate about what attitudes and emotions these two indicators capture. We have a weak understanding of what considerations figure into women’s stated ideal number of children. How much does the ideal take into account material circumstances (household level or aggregate level)? Are ideals adjusted for partnership constraints? And, following up on a point raised above, are women mindful of how many children might be required to attain a desired sex composition? From the standpoint of estimating unrealized fertility, a concern is that respondents offer ideals which they know to be fanciful and entirely detached from the realities of their lives. To the extent that this occurs, the comparison ideal versus actual gives an exaggerated picture of unrealized fertility. On the other hand, an ideal may be offered which
excluded. The results prove to be robust, in particular the regional pattern, despite the fact that nonnumeric responses are far more common in certain regions. The one result which is sensitive is the estimated trend in unrealized fertility as fertility declines: There is no trend when nonnumeric and missing responses are included and classified as not having unrealized fertility, and in contrast a trend for unrealized fertility to decline as fertility declines when these observations are excluded.
8 Note that the variable inclusion of women who are out of a union results in inconsistency across countries/surveys between our two indicators (the first indicator is universally asked of women of all union statuses). As a robustness test, we have re-estimated the regressions in Tables 3a and 3b, limiting the sample to women who are in a union in all surveys. In the event the estimates hardly differ from those presented in Tables 3a and 3b, and certainly the major conclusions remain the same. The robustness of the estimates is impressive, given the sample reduction when women out of a union are excluded of 20% for the first indicator and 15% for the second.
9 Because women who are “uncertain” about their desire for another birth constitute a small proportion of the
assumes the desired sex composition can be attained with maximum efficiency (e.g., a boy and a girl among the first two births). To the extent that this is the case, the comparison ideal versus actual underestimates the amount of unrealized fertility. Our guess is that, on balance, a comparison of ideal and number of living children, if biased at all, offers an upwardly biased estimate of unrealized fertility in most settings.
As is the case with the ideal number of children, we do not understand the cognitive process underlying the responses to the prospective preference item. On the face of it, this item provides a direct and valid indication of unsatisfied fertility quantum. In particular, the responses can reflect sex-specific goals (i.e., a shortfall of either boys or girls). Lacking good evidence, our primary concern is that women who would like to have more children do not offer this response, leading to a downward bias in the estimation of unrealized fertility. Measurement error of this sort can occur if women are reluctant to express a desire which they believe to be unattainable. That is, women who are still short of their desired number of children but have concluded they no longer have the physiological capacity to have another child may respond “do not want another child,” reflecting resignation rather than true desires (Bongaarts 1990). Women may also have material and/or partnership circumstances which make future childbearing seem effectively infeasible, despite contrary preferences for another child. Speculation along these lines leads us to conclude that, on balance, stated prospective preferences, if biased at all, provide a downwardly biased estimate of unrealized fertility in most settings.
There is little question that each of these two indicators, and the two jointly, offer a rather limited and superficial assessment of unrealized fertility. For one thing, the assessment is strictly cross-sectional – we have no information on how reproductive goals have evolved over the life course. And these are rudimentary indicators, providing no sense of the intensity of feelings of loss. Some women classified as having unrealized fertility according to one or other of these two indicators may feel profound disappointment, convinced that their lives are less secure and far poorer, in various respects, than they would be if they had more children. At the other extreme, some women may have unrealized fertility from a kind of low-salience hypothetical standpoint which hardly bears on their feelings of satisfaction or frustration with their lives to date or their feelings of insecurity as they approach old age. A richer appreciation of the meaningfulness of unrealized fertility requires more in-depth investigation, possibly through a coupling of quantitative and qualitative interviewing (for constructive discussion of research strategies for this topic see Greil, Slauson-Blevins, and McQuillan 2010).
another child, are mainstays in contemporary fertility analysis. Comparison of the ideal and actual number of children is the basis for DHS estimates of unwanted fertility rates, and prospective preferences are essential ingredients of the DHS algorithm for estimating unmet need for contraception (Bradley et al. 2012). Bongaarts (1990) has already proposed using prospective preferences of older women as an indicator of unfulfilled fertility goals. In short, this research relies on attitudinal items which are widely used in fertility research because decades of research has confirmed their essential validity and utility.
3.3 Covariates of unrealized fertility
We consider associations of unrealized fertility with two individual-level characteristics and one aggregate-level characteristic. In this first broad comparative analysis of unrealized fertility outside the West, we opt for parsimony in our choice of covariates, concentrating on demographic factors which are established correlates of various other reproductive outcomes (most notably unintended fertility) and for which measurement can be assumed to be comparable across survey. We do not consider basic socioeconomic factors (e.g., urban–rural residence, level of educational attainment), although inarguably these are of interest. Not only do we wish to keep this analysis parsimonious, but incorporating socioeconomic variables presents significant measurement challenges, including noncomparability across country, time, and survey program, and also unavailability in some of the survey files we analyze.
It is natural to ask if fundamental features of the women’s childbearing careers have some bearing on the risk of unrealized fertility. Two factors of relevance from previous research on fertility intentions are the woman’s number of living children (e.g., Bongaarts and Casterline 2013) at the time of the survey (at ages 44‒48) and her age at first birth (e.g., Morgan and Rackin 2010). Note that an association of unrealized fertility with number of living children is hardly tautological; it would only be tautological if desired number of children did not differ by the number of living children.
decreases, or remains stable as fertility declines. To reiterate a point made earlier, analysis at individual and aggregate levels can yield different patterns. In this instance, it is conceivable that unrealized fertility is more common among women with relatively fewer children (individual level), while at the same time unrealized fertility becomes less prevalent as fertility declines (aggregate level).
Finally, we also examine the patterning of unrealized fertility by major regions:
Latin America & the Caribbean: 16 countries, 53 surveys Southeast Asia: 6 countries, 20 surveys
South Asia: 6 countries, 19 surveys
West Asia & North Africa: 12 countries, 36 surveys Sub-Saharan Africa: 38 countries, 124 surveys
3.4 Regression modeling
To examine the association of unrealized fertility with the three covariates and region, we estimate multilevel regressions with the indicators of unrealized fertility serving as the dependent variable and the covariates entered as continuous variables (mean children ever born for the survey) or categorical variables represented by blocks of dummy variables (number of living children, age at first birth, region). The regression equations include a random effect for country. These are logit regressions and estimation is via the QR decomposition of the variance-components matrix (procedure meqrlogit in Stata 14).
4. Results
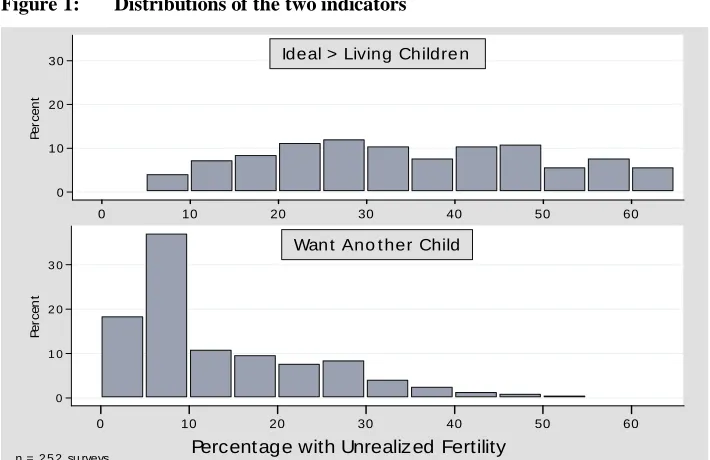
The distributions of the two indicators are displayed in histograms in Figure 1. These are survey-level distributions (n = 252 surveys) – that is, each survey contributes one prevalence of unrealized fertility. Comparing the two distributions, ideal versus living children shows a more balanced distribution, while preference for another child is highly left-skewed, with more than 30% of the surveys yielding an estimate of the prevalence of unrealized fertility between 5% and 10%. According to the first indicator, in most countries between 20% and 50% of women aged 44‒48 have fallen short of their desired number of children.10 According to the second indicator, in contrast, in
10
most countries less than 20% of women have unrealized fertility and in fact in about one-half of the surveys the prevalence is less than 10%. This rather sharp discrepancy between the pictures provided by the two indicators is consistent with our assumption that, if anything, the first indicator is upwardly biased and the second indicator is downwardly biased. When interpreting Figure 1, the regional distribution of the surveys shown above should be kept in mind – almost one-half of the surveys are from sub-Saharan Africa and, as will be apparent below, unrealized fertility is more prevalent in this region.
Figure 1: Distributions of the two indicators
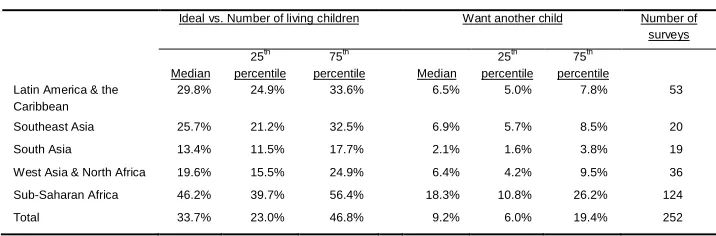
Summary statistics (median, first and third quartiles) for the distributions of the two indicators by major region are shown in Table 1. These are medians and quartiles of the survey-by-survey estimates (n = 252 surveys). Table 1 reinforces the main
simply providing their actual number of children. A further feature of the full distribution is the large proportion of women for whom the difference between the two numbers is larger in absolute value than 1. This is the case for more than 40% of women, on average, in all regions and more than 60% of women in sub-Saharan Africa. Finally, sub-sub-Saharan Africa stands out in the large proportion of women for whom the ideal exceeds the living by more than one child (on average, among the 124 African surveys, this is the case for more than 40% of women).
0 1 0 2 0 3 0
P
e
rc
e
n
t
0 10 20 30 40 50 60
Ideal > Living Childre n
0 1 0 2 0 3 0
P
e
rc
e
n
t
0 10 20 30 40 50 60
Wan t Ano t her Child
Percentage with Unrealized Fertility n = 2 5 2 su rveys
conclusion from Figure 1, namely that the level of unrealized fertility differs considerably between the two indicators, with the ideal versus living children suggesting far higher levels of unrealized fertility than preference for another child. Table 1 shows that this discrepancy characterizes all five regions: that is, a consistent measurement pattern in a wide variety of settings (demographic, sociocultural). According to the first indicator, on average at least one-fifth to one-half of women have unrealized fertility at the conclusion of their reproductive careers in all regions except South Asia. By contrast, less than one-tenth have unrealized fertility according to the second indicator in all regions except sub-Saharan Africa.
A second feature of Table 1 is that sub-Saharan Africa has the highest level of unrealized fertility according to both indicators, despite having the highest level of fertility. This is a first indication that unrealized fertility does not have a simple inverse association with level of fertility (i.e., more unrealized fertility in societies with lower fertility). In contrast, South Asia has the lowest level of unrealized fertility according to both indicators. The range across regions is large – according to the first indicator (ideal vs. living number of children), on average unrealized fertility is about three times more prevalent in sub-Saharan Africa than in South Asia, and according to the second indicator (want another child), unrealized fertility is almost nine times more prevalent in sub-Saharan Africa than in South Asia. Unrealized fertility is quite rare in South Asia, judging from the desire for another child among women aged 44‒48 (the median for 22 South Asian surveys is 2.1%). At the other extreme, the comparison of ideal versus living number of children suggests that nearly one-half of women in sub-Saharan Africa are short of their ideal at the conclusion of their childbearing.
Table 1: Indicators of unrealized fertility: Median, first quartile, and third quartile, by major region (n = 252 surveys)
Ideal vs. Number of living children Want another child Number of surveys
Median 25th percentile
75th
percentile Median 25th percentile
75th percentile Latin America & the
Caribbean
29.8% 24.9% 33.6% 6.5% 5.0% 7.8% 53
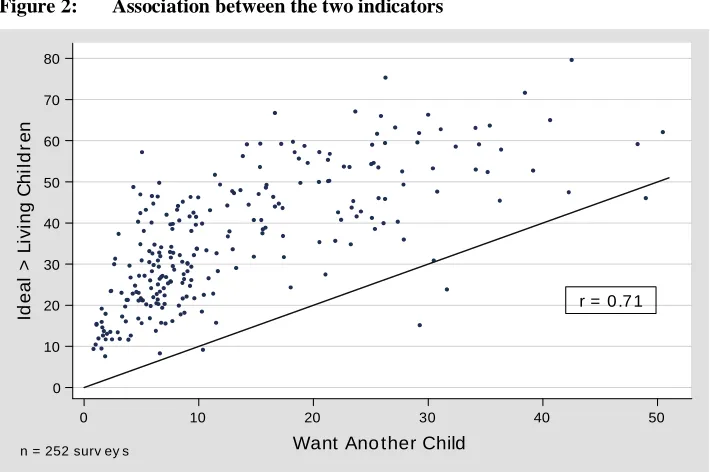
Figure 1 and Table 1 reveal a substantial discrepancy between the distributions of the two indicators of unrealized fertility. The association between the two indicators is examined more directly in Figure 2 and Table 2. Figure 2 is a scatterplot of the two indicators (n = 252 surveys). A 45-degree line is drawn through the figure to highlight the fact that the ideal versus living children measure virtually always produces higher estimates of unrealized fertility than the preference measure. The correlation between the two indicators is moderately strong (r = 0.71).
Figure 2: Association between the two indicators
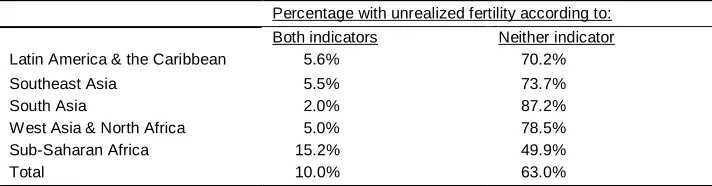
The consistency between the two indicators is examined further in Table 2. As in all the analysis to this point, this table summarizes survey-level results – that is, in each survey we cross-tabulate the two indicators and calculate the percentage with unrealized fertility according to both indicators and neither indicator, and Table 2 presents the regional averages of these survey-by-survey percentages. The bottom row of Table 2 shows results for all regions: On average, 10% of women have unrealized fertility according to both indicators, whereas more than 60% have unrealized fertility according to neither indicator. Comparing Table 2 and Table 1, there is no sharp regional difference in the consistency between the two indicators. Roughly two-thirds to
three-r = 0 .7 1
0 10 20 30 40 50 60 70 80
Id
e
a
l
>
L
iv
in
g
C
h
il
d
re
n
0 10 20 30 40 50
Want Ano ther Child
quarters of the women who have unrealized fertility according to “want another child” also have unrealized fertility according to “ideal vs. living children” (compare left-hand column in Table 2 with median “want another child” in Table 1). The regional pattern of prevalence of unrealized fertility according to neither indicator (right-hand column of Table 2) conforms generally to the regional patterns of the separate indicators in Table 1 – unrealized fertility is most common in sub-Saharan Africa and least common in South Asia.
Table 2: Overlap of two indicators by major region (n = 252 surveys)
Percentage with unrealized fertility according to: Both indicators Neither indicator Latin America & the Caribbean 5.6% 70.2%
Southeast Asia 5.5% 73.7%
South Asia 2.0% 87.2%
West Asia & North Africa 5.0% 78.5%
Sub-Saharan Africa 15.2% 49.9%
Total 10.0% 63.0%
Note: medians of survey-specific percentages
Table 3a: Multilevel regressions on ideal vs. number of living children (odds ratios)
Model 1 Model 2 Model 3 Model 4 Model 5
Region
Sub-Saharan Africa 1.00 1.00 1.00 1.00 1.00
Latin America & the
Caribbean 0.26*** 0.44*** 0.26*** 0.40*** 0.40***
Southeast Asia 0.23*** 0.34*** 0.23*** 0.36*** 0.36***
South Asia 0.12*** 0.20*** 0.12*** 0.17*** 0.17*** West Asia & North
Africa 0.24*** 0.20*** 0.24*** 0.23*** 0.23***
Number of living children
0‒1 48.73*** 47.17*** 48.74*** 47.17***
2‒3 7.23*** 7.23*** 7.23*** 7.23***
4‒5 2.29*** 2.30*** 2.29*** 2.30***
6+ 1.00 1.00 1.00 1.00 1.00
0 13.63***
Age at first birth
<18 1.00 1.00 1.00
18‒20 1.00 0.92*** 0.92***
21‒24 1.23*** 0.89*** 0.89***
25+ 2.25*** 1.00 1.00
Mean CEB
country 1.37*** 1.37***
Mean CEB survey 1.00 0.99
Intercept 0.38*** 0.72*** 0.40*** 0.05*** 0.06***
N women 295,854 295,854 295,854 295,854 295,854
AIC 280,802 323,738 280,696 280,785 280,679
BIC 280,898 323,844 280,823 280,902 280,827
Table 3b: Multilevel regressions on want another child (odds ratios)
Model 1 Model 2 Model 3 Model 4 Model 5
Region
Sub-Saharan Africa 1.00 1.00 1.00 1.00 1.00
Latin America & the
Caribbean 0.19*** 0.23*** 0.19*** 0.41*** 0.39*** Southeast Asia 0.19*** 0.20*** 0.18*** 0.40*** 0.38***
South Asia 0.11*** 0.13*** 0.11*** 0.18*** 0.18***
West Asia & North
Africa 0.41*** 0.25*** 0.36*** 0.39*** 0.34***
Number of living children
0‒1 21.47*** 18.93*** 22.37*** 19.74***
2‒3 3.06*** 2.84*** 3.19*** 2.95***
4‒5 1.67*** 1.63*** 1.71*** 1.66***
6+ 1.00 1.00 1.00 1.00 1.00
0 29.70***
Age at first birth
<18 1.00 1.00 1.00
18‒20 1.09*** 0.76*** 0.77***
21‒24 1.45*** 0.89*** 0.89***
25+ 3.23*** 1.28*** 1.29***
Mean CEB
country 1.33*** 1.30***
Mean CEB survey 1.24*** 1.24***
Intercept 0.11*** 0.14*** 0.12*** 0.00*** 0.01***
N women 244,746 244,746 244,746 244,746 244,746
AIC 122,047 124,838 121,500 121,796 121,251
BIC 122,140 124,942 121,625 121,910 121,397
Notes: * p < 0.05; ** p < 0.01; *** p < 0.001
among women at the end of their reproductive careers in sub-Saharan Africa (the reference category) than in the other regions, while South Asia shows the lowest prevalence. The direction and magnitude of this regional differential is roughly the same in all five models: that is, controlling for the demographic factors does not meaningfully alter the pattern. Note that the demographic factors include aggregate-level fertility (Models 4 and 5), and controlling for this factor does narrow the regional differential. In particular, unrealized fertility in sub-Saharan Africa is somewhat less prevalent as compared to Latin America and Southeast Asia after controlling for aggregate-level fertility. The key point is that the regional differential remains large and statistically significant; the persistence of the regional effects with this control means that there is a distinctive and robust regional patterning net of societal fertility level (or, put another way, net of stage-of-fertility transition). We discuss the regional differential further in the final section.
Number of Living Children: The reference category is women with the highest
lifetime fertility (6+ living children). As contrasted with these women, the odds ratio for
0‒1 living children is enormous, and this is the case for both indicators of unrealized fertility and in all four models which include this factor. De Carvalho, Wong, and Miranda-Ribeiro (2016) document this sharp differential for women in Brazil. It is clear that women who have zero or one living child are far more likely to have unrealized fertility, from which one might infer that this low-fertility outcome is not by choice but rather due to involuntary infertility (primary or secondary sterility) and/or child loss. The effect is larger for the first indicator, in all likelihood because almost no women offer an ideal number of children less than two. Women with two or three living children also show distinctly higher odds of having unrealized fertility as compared to women with six or more living children. Note that the estimated effect of number of living children is hardly affected by a control for aggregate-level fertility (Models 4 and 5). That is, the effect of number of living children is not due to number of living children proxying for stage-of-fertility decline.
Age at First Birth: Without a control for number of living children, there is a monotonic and moderately sharp association between age at first birth and unrealized fertility (Model 2). (See same result in de Carvalho, Wong, and Miranda-Ribeiro [2016].) The effect kicks in when age at first birth occurs after age 20 – the regression estimates suggest no advantage to starting childbearing before age 18 – and is largest when the first birth does not occur until after age 24. This effect is virtually eliminated when number of living children is controlled (Models 3 and 5), and this is entirely as expected: Age at first birth exercises its influence through number of living children, and there is little basis for a genuine effect otherwise.11 The clear conclusion from
11
Model 2 is that delaying the first birth places women at higher risk of unrealized fertility at the conclusion of their reproductive careers.
Aggregate-level Fertility: The association of unrealized fertility with aggregate-level fertility is examined in Models 4 and 5. Motivating the estimation of effects of aggregate-level fertility is the question of whether the likelihood of unrealized fertility changes as fertility declines. The regional patterns in Table 1 suggest that unrealized fertility is highest where fertility is highest – sub-Saharan Africa shows the highest prevalence. But this could be a regional effect rather than an effect of level of fertility. In Models 4 and 5, the effect of aggregate-level fertility is estimated net of regional effects and also net of effects of individual-level fertility factors (number of living children, age at first birth). Aggregate-level fertility is represented by two variables: Mean CEB Country and Mean CEB Survey. Coefficients on the first are difficult to interpret, because countries have higher or lower fertility on average as a function of when demographic surveys were conducted, and this is neither random nor balanced with respect to level of fertility. The coefficient on Mean CEB Survey, in contrast, is interpretable and quite meaningful: With the control on Mean CEB Country, the coefficient on Mean CEB Survey represents the effect on unrealized fertility of within-country change over time in aggregate-level fertility. The results are mixed: The prevalence of unrealized fertility is unrelated to the level of fertility according to the first indicator and positively associated with the level of fertility according to the second. The latter result means that the prevalence of unrealized fertility declines as fertility declines, and the effect is large: The coefficient (1.24) represents the multiplicative effect on the odds of unrealized fertility of a one-child decline in mean children ever born, and typically over the course of fertility transition this mean declines by three or four children. We stress again that this result emerges for the second indicator but not the first.
The contrasting differentials for number of living children and aggregate-level fertility – the first is negative, the second is positive for the second indicator of unrealized fertility – is an interesting instance of associations differing by level of aggregation. The first effect is sensible and entirely as expected: In any given cross-section, women who have fewer living children at the conclusion of their reproductive years are more likely to have fallen short of their childbearing goals. The second effect is an empirical finding from this analysis which was not entirely anticipated: In this set of societies over the historical period observed, there is evidence that the decline in fertility has been accompanied by a decline in unrealized fertility.
5. Summary and concluding comments
The neglect of unrealized fertility in the demographic literature on non-Western societies is surprising, given the importance of this phenomenon. In almost every society fear of infertility and fear of falling short repeatedly emerge in sociological and anthropological investigations of kinship and family, and they are recurrent themes in the popular literature, other forms of mass media, and anecdotally in day-to-day life.12 Moreover, as a concept unrealized fertility links fertility attitudes and realized fertility, and this marriage is routine practice for demographers who conduct research in these regions, most notably in the concept and measures of unintended fertility (and its components, mistimed and unwanted births). The neglect of unrealized fertility is further surprising because indicators are easily constructed from readily available data, as this analysis demonstrates. Indeed, there is nothing innovative in the indicators employed in this research; rather, what is new here is the focus on women at the end of their reproductive years.
We have conducted the first comparative analysis of unrealized fertility in contemporary societies in Asia, Africa, and Latin America. The wealth of national demographic survey data collected from the mid-1970s to the present makes such an analysis feasible. Our key empirical findings are as follows. First, unrealized fertility is either moderately common or rather rare, depending on the indicator:
• According to ideal versus actual, the regional medians range from 13% (South Asia) to 45% (sub-Saharan Africa).
• But according to the desire for another child, the regional medians range from 2% (South Asia) to 18% (sub-Saharan Africa).
Lacking a sound basis to evaluate the validity of each indicator, we will regard these estimates as, effectively, upper and lower bounds: that is, we will assume the true prevalence of unrealized fertility falls somewhere in between.
Second, two associations at the individual level are hardly surprising:
• Unrealized fertility is more common among women with fewer living children, especially women with less than four children.
• Unrealized fertility is more common among women whose first birth occurs after age 20, and this effect operates mainly through the number of living children.
12
An aggregate-level pattern was not expected in advance:
• According to the second indicator, unrealized fertility becomes less prevalent as societal-level fertility declines (with the qualification that this outcome applies to this set of societies during the historical period observed).
Note that the association of unrealized fertility with the quantum of fertility goes in different directions at the individual and aggregate levels, underscoring the fact that social and demographic theory must be precise about level of analysis.
Why might unrealized fertility decline as fertility declines? We are unable to provide a definitive answer to this question. It should be kept in mind that the cohorts of women analyzed are characterized by average lifetime fertility which ranges from 2.6 births per woman to 9.0 births per woman, with a median of 5.9 births per woman: that is, none of these cohorts have experienced the low fertility of high-income societies in the West and East Asia during the past four decades. Evidently, as fertility declines from high to moderate levels, fertility desires fall more rapidly than realized fertility, yielding a trend of declining unrealized fertility. Once fertility desires settle at a low level, it is possible that further declines in realized fertility (due to whatever factors) will produce an upturn in unrealized fertility. It remains to be seen whether this actually occurs in these societies outside the West. A further related point is that many of these societies experienced radical increase in the availability of modern contraception during the historical period under consideration, in part due to the expansion of organized family planning programs (Kuang and Brodsky 2016). This was part and parcel of a larger health transition. It is plausible that the more effective exercise of control over health included more success in reaching childbearing goals and, in particular, relatively fewer instances of falling short. Declines in primary and secondary infertility are documented in the demographic literature (e.g., Larsen 2000; Mascarenhas et al. 2012).
Finally, there is also an intriguing regional patterning:
• Unrealized fertility is distinctly higher in sub-Saharan Africa and lower in South Asia.
This regional patterning persists with controls for aggregate-level fertility and individual-level demographic factors (number of living children and age at first birth).
been confirmed in empirical analyses (Bongaarts and Casterline 2013; Casterline and Agyei-Mensah forthcoming). The reasons for this relative pronatalism are not clearly established in the research literature. Caldwell, Orubuloye, and Caldwell (1992) attribute it to social organization (kinship systems, child fostering), mode of production (in particular corporate property ownership), and cultural systems (centrality of ancestors in indigenous religions). A second and more focused explanation for the higher unrealized fertility in sub-Saharan Africa is the relatively high levels of child loss (child mortality) which these cohorts of women experienced. African demographic regimes are exceptional in the past four decades for their high rates of mortality before age 5, especially the rates post-infancy (i.e., early childhood mortality). Plausibly this too drives the responses to the fertility attitudinal items which are the basis for our indicators of unrealized fertility.
While this research has relied on survey attitudinal items which are well established and widely employed in the demographic research literature, we are cognizant of the limitations of the indicators we have constructed. We have speculated that our first indicator – comparison of stated ideal number of children with actual living number of children – is upwardly biased, because some women express ideals which are detached from their personal and household circumstances and which they may recognize as unrealistic. And we have speculated that our second indicator – stated preference to have another child – is downwardly biased, because some women who in fact still desire another child have resigned themselves to the impossibility of this occurring and accordingly do not admit to wanting another child. Beyond these possible limitations, clearly neither indicator captures the intensity of disappointment at falling short of childbearing goals. It is likely that this intensity varies tremendously, from mattering hardly at all to a feeling of profound loss.
incompatible alternatives; if one of the alternatives is chosen at the price of losing the others, should the others be viewed as unrealized outcomes? In one sense this is clearly the case. Yet we can assume that often people fully recognize, and accept, the consequences of the choices they have made.
Our point is that there are dimensions to the concept of unrealized fertility which require deeper reflection and analysis. In fact, the same kind of reasoning applies to the contrasting discrepancy between fertility desires and outcomes, namely unintended fertility. This comes about because individuals make choices (e.g., not using contraception) which, by one channel or another, elevate the risk of unintended fertility. Reducing unintended fertility is explicit social policy in most contemporary societies, and programs are instituted to undermine the barriers to the implementation of desires to avoid pregnancy: that is, targeted actions to enable reproductive preferences to have maximum sway. An analogous argument could be framed for unrealized fertility.
Working against this, of course, is the explicit goal in many of the societies analyzed here of reducing aggregate fertility rates in order to reduce the population growth rate, which in turn is posited to have multiple economic and social benefits, and to improve maternal and child health. This is the sharp distinction between unintended fertility and unrealized fertility in most of the societies under consideration in this research: Reducing unintended fertility is regarded as advancing other paramount individual-level and societal-level goals, whereas reducing unrealized fertility would seem to achieve just one goal, namely closer individual-level correspondence between reproductive aspirations and outcomes. What is the commitment to this latter goal? Unrealized fertility brings this question into sharp focus.
6. Acknowledgments
References
Adsera, A. (2006). An economic analysis of the gap between desired and actual fertility: The case of Spain.Review of Economics of the Household 4(1): 75‒95.
doi:10.1007/s11150-005-6698-y.
Barden-O’Fallon, J. (2005). Unmet fertility expectations and the perception of fertility problems in a Malawian village. African Journal of Reproductive Health 9(2): 14‒25.doi:10.2307/3583459.
Billari, F.C., Kohler, H.P., Andersson, G., and Lundström, H. (2007). Approaching the limit: Long-term trends in late and very late fertility. Population and
Development Review 33(1): 149‒170.doi:10.1111/j.1728-4457.2007.00162.x.
Bongaarts, J. (1990). The measurement of wanted fertility. Population and
Development Review 16(3): 487‒506.doi:10.2307/1972833.
Bongaarts, J. (2001). Fertility and reproductive preferences in post-transitional societies.Population and Development Review 27(Supplement): 260‒281.
Bongaarts, J. and Casterline, J.B. (2013). Fertility transition: Is sub-Saharan Africa different? Population and Development Review 38(Supplement): 153‒168.
doi:10.1111/j.1728-4457.2013.00557.x.
Bongaarts, J. and Sobotka, T. (2012). A demographic explanation for the recent rise in European fertility. Population and Development Review 38(1): 83‒120.
doi:10.1111/j.1728-4457.2012.00473.x.
Bradley, S.E.K., Croft, T.N., Fishel, J.D., and Westoff, C.F. (2012). Revising unmet need for family planning. Calverton: ICF International (DHS Analytical Studies; No. 25).
Bratti, M. and Tatsiramos, K. (2012). The effect of delaying motherhood on the second childbirth in Europe. Journal of Population Economics 25(1): 291‒321.
doi:10.1007/s00148-010-0341-9.
Caldwell, J.C., Orubuloye, I.O., and Caldwell, P. (1992). Fertility decline in Africa: A new type of transition. Population and Development Review 18(2): 211‒242.
doi:10.2307/1973678.
Casterline, J.B. and Agyei-Mensah, S. (forthcoming). Fertility desires and the course of fertility decline in Sub-Saharan Africa. In: Casterline, J. and Bongaarts, J. (eds.).
Fertility Decline in Sub-Saharan Africa. Population and Development Review
Casterline, J.B. and El-Zeini, L.O. (2007). The estimation of unwanted fertility.
Demography 44(4): 729‒745.doi:10.1353/dem.2007.0043.
Chesnais, J-C. (2000). Determinants of below replacement fertility.Population Bulletin of the United Nations 40(41): 126‒136.
de Carvalho, A.A., Wong, L.L.R., and Miranda-Ribeiro, P. (2016). Discrepant fertility in Brazil: An analysis of women who have fewer children than desired (1996 and 2006).Revista Latinoamericana de Población 10(18): 83–106.
Frejka, T. (2010). Cohort overlays of evolving childbearing patterns: How postponement and recuperation are reflected in period fertility trends. Rostock: Max Planck Institute for Demographic Research (MPIDR working paper: WP-2010-026).
Frye, M. and Bachan, L. (forthcoming). The demography of words: An assessment of the global decline in non-numeric fertility preferences.Population Studies.
Greil, A.L., Slauson-Blevins, K., and McQuillan, J. (2010). The experience of infertility: A review of recent literature. Sociology of Health and Illness 32(1): 140‒162.doi:10.1111/j.1467-9566.2009.01213.x.
Hagewen, K.J. and Morgan, S.P. (2005). Intended and ideal family size in the United States, 1970–2002. Population and Development Review 31(3): 507‒527.
doi:10.1111/j.1728-4457.2005.00081.x.
Harknett, K. and Hartnett, C.S. (2014). The gap between births intended and births achieved in 22 European countries, 2004‒07. Population Studies 68(3): 265‒ 282.doi:10.1080/00324728.2014.899612.
Hartnett, C.S. (2014). White-Hispanic differences in meeting lifetime fertility intentions in the US. Demographic Research 30(43): 1245‒1276. doi:10.4054/DemRes. 2014.30.43.
Iacovou, M. and Tavares, L.P. (2011). Yearning, learning, and conceding: Reasons men and women change their childbearing intentions. Population and Development Review 37(1): 89‒123.doi:10.1111/j.1728-4457.2011.00391.x.
Ibisomi, L., Gyimah, S., Muindi, K., and Adjei, J. (2011). Ideal versus actual: The contradiction in number of children born to Nigerian women. Journal of Biosocial Science 43(2): 233‒245.doi:10.1017/S0021932010000684.
Kuang, B. and Brodsky, I. (2016). Global trends in family planning programs 1999‒ 2014.International Perspectives on Sexual and Reproductive Health 42(1): 33‒ 44.doi:10.1363/42e0316.
Larsen, U. (2000). Primary and secondary infertility in sub-Saharan Africa.
International Journal of Epidemiology 29(2): 285‒291. doi:10.1093/ije/
29.2.285.
Liefbroer, A.C. (2009) Changes in family size intentions across young adulthood: A life-course perspective.European Journal of Population 25(4): 363‒386.
doi:10.1007/s10680-008-9173-7.
Lightbourne, R.E. (1985). Individual preferences and fertility behavior. In: Cleland, J. and Hobcraft, J. (eds.). Reproductive change in developing countries: Insights from the World Fertility Survey. Oxford: Oxford University Press: 165‒198.
Mascarenhas, M.N., Flaxman, S.R., Boerma, T., Vanderpoel, S., and Stevens, G.A. (2012). National, regional, and global trends in infertility prevalence since 1990: A systematic analysis of 277 health surveys. PLOS Medicine 9(12).
doi:10.1371/journal.pmed.1001356.
Morgan, S.P. and Rackin, H. (2010). The correspondence between fertility intentions and behavior in the United States. Population and Development Review 36(1): 91‒118.doi:10.1111/j.1728-4457.2010.00319.x.
Neels, K. and De Wachter, D. (2010). Postponement and recuperation of Belgian fertility: How are they related to rising female educational attainment? Vienna
Yearbook of Population Research 8: 77‒106. doi:10.1553/
populationyearbook2010s77.
Noack, T. and Østby, L. (2002). Free to choose–but unable to stick to it? Norwegian fertility expectations and subsequent behaviour in the following 20 years. In: Klijzing, E. and Corijn, M. (eds.). Dynamics of fertility and partnership in
Europe: Insights and lessons from comparative research. New York and
Geneva: United Nations: 103‒116.
Quesnel-Vallée, A. and Morgan, S.P. (2003). Missing the target? Correspondence of fertility intentions and behavior in the US. Population Research and Policy
Review 22(5‒6): 497‒525.doi:10.1023/B:POPU.0000021074.33415.c1.
Rutstein, S.O. and Shah, I.H. (2004). Infecundity, infertility, and childlessness in developing countries. Calverton: ORC Macro (DHS Comparative Reports; No. 9).
Spéder, Z. and Kapitány, B. (2009). How are time-dependent childbearing intentions realized? Realization, postponement, abandonment, bringing forward.European Journal of Population 25(4): 503‒523.doi:10.1007/s10680-009-9189-7.
Van Peer, C. (2002). Desired and achieved fertility in selected FFS-countries. In: Miacura, M., Gijs, B., Klijzing, E., and Corijn, M. (eds.). Dynamics of fertility
and partnership in Europe: Insights and lessons from comparative research.