R E S E A R C H A R T I C L E
Open Access
Reported frequency of physical activity in a large
epidemiological study: relationship to specific
activities and repeatability over time
Miranda EG Armstrong
*, Benjamin J Cairns, Jane Green, Gillian K Reeves and Valerie Beral for
The Million Women Study Collaborators
Abstract
Background:How overall physical activity relates to specific activities and how reported activity changes over time may influence interpretation of observed associations between physical activity and health. We examine the relationships between various physical activities self-reported at different times in a large cohort study of middle-aged UK women.
Methods:At recruitment, Million Women Study participants completed a baseline questionnaire including questions on frequency of strenuous and of any physical activity. About 3 years later 589,896 women also completed a follow-up questionnaire reporting the hours they spent on a range of specific activities. Time spent on each activity was used to estimate the associated excess metabolic equivalent hours (MET-hours) and this value was compared across categories of physical activity reported at recruitment. Additionally, 18,655 women
completed the baseline questionnaire twice, at intervals of up to 4 years; repeatability over time was assessed using the weighted kappa coefficient (weighted) and absolute percentage agreement.
Results:The average number of hours per week women reported doing specific activities was 14.0 for housework, 4.5 for walking, 3.0 for gardening, 0.2 for cycling, and 1.4 for all strenuous activity. Time spent and the estimated excess MET-hours associated with each activity increased with increasing frequency of any or strenuous physical activity reported at baseline (tests for trend, P < 0.003), although the associations for housework were by far the weakest (Spearman correlations, 0.01 and -0.03 respectively for housework, and 0.11-0.37 for all other activities). Repeatability of responses to physical activity questions on the baseline questionnaire declined significantly over time. For strenuous activity, absolute agreement was 64% (weighted= 0.71) for questionnaires administered less than 6 months apart, and 52% (weighted= 0.51) for questionnaires more than 2 years apart. Corresponding values for any physical activity were 57% (weighted= 0.67) and 47% (weighted= 0.58).
Conclusions:In this cohort, responses to simple questions on the frequency of any physical activity and of strenuous activity asked at baseline were associated with hours spent on specific activities and the associated estimated excess MET-hours expended, reported 3 years later. The weakest associations were with housework. Agreement for identical questions asked on two occasions about the frequency of physical activity decreased over time.
* Correspondence: [email protected]
Cancer Epidemiology Unit, University of Oxford, Richard Doll Building, Old Road Campus, Oxford OX3 7LF, UK
Background
Reliable assessment of physical activity over a long per-iod is important for examining the effects of physical activity on health in cohort studies. For large-scale pro-spective studies, use of objective measures of physical activity, such as accelerometers and calorimetry, are impractical and questionnaires have become the method of choice for the assessment of physical activity [1-4]. Questionnaires are less likely than objective methods to interfere with usual physical activity patterns, allow the assessment of multiple variables with the same instru-ment, are relatively inexpensive, and are simple to administer and to score [3]. Yet, responses to questions are subjective, and questionnaires often ask about only a portion of overall physical activity, and are therefore subject to measurement error [1,3-7]. Self-report of socially sensitive information such as physical activity may also be subject to social desirability response bias, the tendency of individuals to respond to questions in a way that portrays them in a positive light [8,9].
In prospective studies, physical activity assessed at baseline may be used to investigate the influence of phy-sical activity on health outcomes which occur during follow-up. However, baseline assessments do not neces-sarily represent physical activity during extended periods of follow-up, both due to measurement errors at the time of assessment, and because physical activity beha-viours may change over time [10-13]. As with any expo-sure data that is subject to error [14], the result of differences between baseline physical activity data and typical physical activity behaviours during follow-up will generally be to underestimate associations between base-line physical activity and health outcomes.
The Million Women Study is a prospective cohort study of 1.3 million middle-aged women recruited in the UK. It was designed to assess the effects of lifestyle fac-tors on a variety of disease outcomes in women [15]. Since follow-up is planned to span many years, it is important to establish how measurement errors and changes since recruitment might affect associations with subsequent disease risk.
We evaluated the associations between overall fre-quency of physical activity reported at baseline, and var-ious types of physical activity (walking, gardening, cycling, housework, and strenuous activities) reported 3 years after recruitment. These findings can be used to assess how well women’s responses to baseline questions on physical activity are associated with their reported levels of physical activity over an extended period of fol-low-up. To investigate the combined effects of reporting error and changes in physical activity behaviours over time, we also examined the repeatability of responses to the same questions on frequency of physical activity by
women who completed the baseline questionnaire twice with intervals between them ranging from less than 6 months to more than 2 years. These measures can be used to assess the potential attenuation of disease asso-ciations with physical activity as measured at baseline, for example through the use of methods similar to those used to correct for“regression dilution bias”[14,16]. Methods
Data collection
The Million Women Study is a prospective cohort study of middle aged women in the UK. Details of the design and methods of the Million Women Study have been published elsewhere [15]. From 1996-2001, women were recruited via national breast screening programmes in England and Scotland. In total, 1.3 million respondents, aged 56 years on average, completed a baseline ques-tionnaire which included questions on physical activity, lifestyle, medical history, and socio-demographic factors. Permission to conduct the study was granted by the Anglia and Oxford Multi-Centre Research Ethics Committee.
On the baseline questionnaire all women were asked
“How often do you do any strenuous exercise? (that is, enough to cause sweating or a fast heart beat)”, and after the first 9% had completed the questionnaire an
additional question was added: “How often do you do
any exercise?”. To each of these questions, study partici-pants were given 6 options to respond: ‘Rarely/never’,
‘less than once a week’, ‘once a week’, ‘2-3 times a week’,‘4-6 times a week’,‘every day’. No distinction was made between frequencies of physical activity in sum-mer and winter. Of the 1.3 million participants, 18,655 (1.4%) completed the recruitment questionnaire twice (17,617 women provided repeated data for strenuous activity, and 12,748 provided repeated data for any activity).
Frequency of physical activity at baseline and reported specific activities at follow-up
The mean estimated excess energy expenditure for strenuous activity and various specific activities reported at follow-up (derived from hours spent performing these activities), were compared across categories of frequency of strenuous and any physical activity at baseline. Spear-man correlation coefficients and P-values for trend were also calculated for these comparisons.
To estimate excess energy expenditure, metabolic equivalents (METs) were assigned to each activity according to the compendium of physical activities published by Ainsworth et al., [19]. By definition, a MET is the ratio of the metabolic rate required by a given work task, to the standard resting metabolic rate obtained while sitting quietly [19]. Housework was estimated at 3.0 METs, gardening at 4.0 METs, and walking at 3.5 METs. Cycling and any work or exercise causing sweating or a fast heartbeat, were estimated at 8 METs. Multiplying by these values provides an esti-mate of the gross metabolic cost of each activity, i.e. the sum of the resting metabolic rate and the meta-bolic cost of the physical activity. In the present cir-cumstance, however, the estimated net energy expenditure (the estimated energy expenditure asso-ciated with the given activity only) may be more appropriate, as in low intensity activities the resting metabolic rate accounts for a higher proportion of total estimated energy expenditure than in high inten-sity activities [20]. For example the proportion of energy expenditure attributed to resting metabolic rate for cycling is 12.5%, compared with 33% for the equivalent time spent doing housework. Because we calculated an estimate of excess energy expenditure (net cost of physical activity) attributed to physical activity only, beyond energy expenditure attributed to resting metabolic rate, one MET was subtracted from each multiplier prior to calculations. The MET values were multiplied by the number of hours reported for each type of activity to obtain energy expenditure as excess MET-hours, which include only additional activity above basal MET values. Reported summer and winter values were averaged to obtain the total time spent doing a reported activity. The calculation of excess MET-hours for strenuous activity at follow-up included hours of strenuous activity reported when answering the question asking about hours spent doing exercise causing sweating or a fast heartbeat. To avoid possible double counting and due to the similarity between the question asked at baseline ["How often do you do any strenuous exercise? (that is, enough to cause sweating or a fast heart beat)"] and that asked at follow-up ("About how many hours each week do you
spend doing any work or exercise causing sweating or a fast heartbeat”), cycling was not added to the values reported for strenuous exercise at follow-up. Hours and excess MET-hours for all of the various activities reported at follow-up (housework, gardening, walking, cycling, and any strenuous exercise) were summed together to provide an aggregate physical activity value. However, as only pre-specified activities were reported at follow-up, this value should not be assumed to represent total activity.
Repeatability over time of reported frequency of physical activity
Agreement was assessed between women’s first and
repeat responses to the baseline questions on fre-quency of any and of strenuous physical activity. The percentage absolute agreement reflects all changes in reported activity levels between first and repeat responses. As the categories of reported frequency of physical activity per week were ordinal (ordered from least frequent to most frequent activity), the kappa coefficient with quadratic weighting (weighted) was also assessed [21,22]. The kappa coefficient with quadratic weighting is equivalent to an intraclass correlation coefficient [22] and allows for the fact that a change from category 1 to category 2 (for example) reflects closer agreement over time than a change from cate-gory 1 to catecate-gory 6. Kappa values above 0.80 are taken to indicate excellent agreement, between 0.61 -0.80 substantial agreement, between 0.41 - 0.60 moder-ate agreement, between 0.21 - 0.40 fair agreement, and lower than 0.20 poor agreement [23].
The percentage of women reporting each frequency of strenuous or of any physical activity and the percentages of women reporting higher, lower or the same amount of strenuous or of any physical activity between first and repeat baseline questionnaires were also calculated for the 4 time periods.
The data were also assessed for differences in report-ing between first and repeat response accordreport-ing to sea-sonality. The kappa coefficient with quadratic weighting (weighted) was used to assess agreement over time for different seasonal scenarios including winter at first response compared to winter at repeat response, winter at first response compared to summer at repeat response, summer at first response compared to sum-mer at repeat response, and sumsum-mer at first response compared to winter at repeat response. For the purposes of this analysis, data reported during December through February were defined as winter, and data reported dur-ing June through August were defined as summer.
Results
Frequency of physical activity at baseline and reported specific activities at follow-up
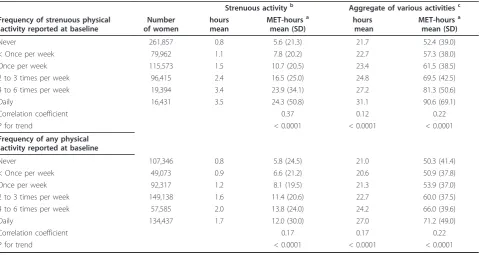
Women reported spending a total of 1.4 (SD = 3.4) hours per week on average doing strenuous activity at follow-up. The number of hours per week reported doing strenuous activity at follow-up increased with the frequency of strenuous activity reported at baseline 3 years earlier (Table 1). Women reporting no strenuous activity at baseline reported 0.8 hours per week on aver-age of strenuous activity at follow-up, while those reporting daily strenuous activity at baseline reported 3.5 hours per week on average at follow-up. Total excess MET-hours for strenuous activity, calculated from the number of hours spent participating in strenuous activ-ity at follow-up, was associated with baseline frequency of strenuous activity (Spearman correlation 0.37, P < 0.0001 for trend; Table 1). Similar associations were seen when excess MET-hours per week for an aggregate of various activities (walking, cycling, gardening, house-work, and exercise causing sweating or a fast heartbeat) reported at follow-up were compared with the frequency of any physical activity reported at baseline (Spearman correlation 0.22, P < 0.0001 for trend; Table 1). On
average, women reported spending 23.1 (SD = 14.6) hours per week at follow-up walking, cycling, doing gar-dening, doing housework, or doing exercise causing sweating or a fast heartbeat. Women who reported no activity at baseline reported an average of 21.0 hours per week of various activities at follow-up, whereas women reporting being active daily at baseline reported an average of 27.0 hours per week of various activities at follow-up.
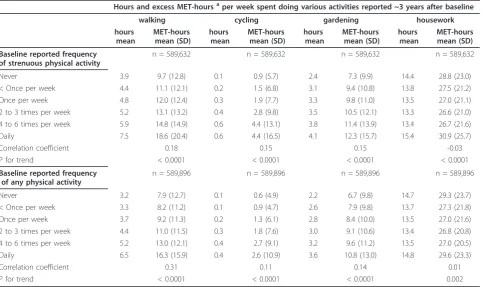
On average women reported 14 hours of housework, 4.5 hours of walking, 3.0 hours of gardening, and 0.2 hours of cycling per week. The number of hours per week reported doing walking, cycling and gardening at follow-up increased with the frequency of strenuous and of any activity reported at baseline 3 years earlier (Table 2). The corresponding estimated excess MET-hours are also given in Table 2. Walking, gardening and cycling showed stronger associations with reported frequency of any and strenuous activity (Spearman correlations 0.11-0.31, and all P < 0.0001 for trends) than did housework, which despite statistically significant trends was very poorly cor-related with frequency of both strenuous and any activity (Spearman correlations -0.03 and 0.01, and P < 0.0001 and P = 0.002 for trends, respectively).
Table 1 Excess MET-hoursafor activity at follow-up in relation to baseline frequency of activity
Hours and excess MET-hoursaper week spent doing various
activities reported ~3 years after baseline
Strenuous activityb Aggregate of various activitiesc Frequency of strenuous physical
activity reported at baseline
Number of women
hours mean
MET-hoursa mean (SD)
hours mean
MET-hoursa mean (SD)
Never 261,857 0.8 5.6 (21.3) 21.7 52.4 (39.0)
< Once per week 79,962 1.1 7.8 (20.2) 22.7 57.3 (38.0)
Once per week 115,573 1.5 10.7 (20.5) 23.4 61.5 (38.5)
2 to 3 times per week 96,415 2.4 16.5 (25.0) 24.8 69.5 (42.5)
4 to 6 times per week 19,394 3.4 23.9 (34.1) 27.2 81.3 (50.6)
Daily 16,431 3.5 24.3 (50.8) 31.1 90.6 (69.1)
Correlation coefficient 0.37 0.12 0.22
P for trend < 0.0001 < 0.0001 < 0.0001
Frequency of any physical activity reported at baseline
Never 107,346 0.8 5.8 (24.5) 21.0 50.3 (41.4)
< Once per week 49,073 0.9 6.6 (21.2) 20.6 50.9 (37.8)
Once per week 92,317 1.2 8.1 (19.5) 21.3 53.9 (37.0)
2 to 3 times per week 149,138 1.6 11.4 (20.6) 22.7 60.0 (37.5)
4 to 6 times per week 57,585 2.0 13.8 (24.0) 24.2 66.0 (39.6)
Daily 134,437 1.7 12.0 (30.0) 27.0 71.2 (49.0)
Correlation coefficient 0.17 0.17 0.22
P for trend < 0.0001 < 0.0001 < 0.0001
a
Excess MET-hours: metabolic equivalent hours of energy expenditure in excess of basal metabolic rate; see Methods for details.
b
Reported hours and estimated excess MET-hoursaspent doing exercise causing sweating or a fast heartbeat
c
Repeatability over time of reported frequency of physical activity
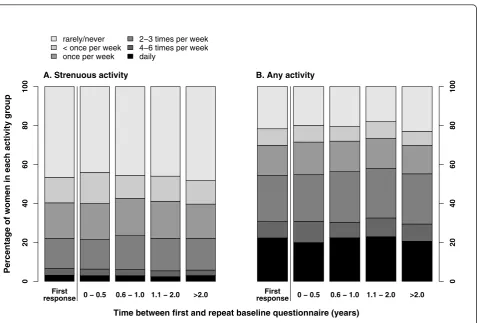
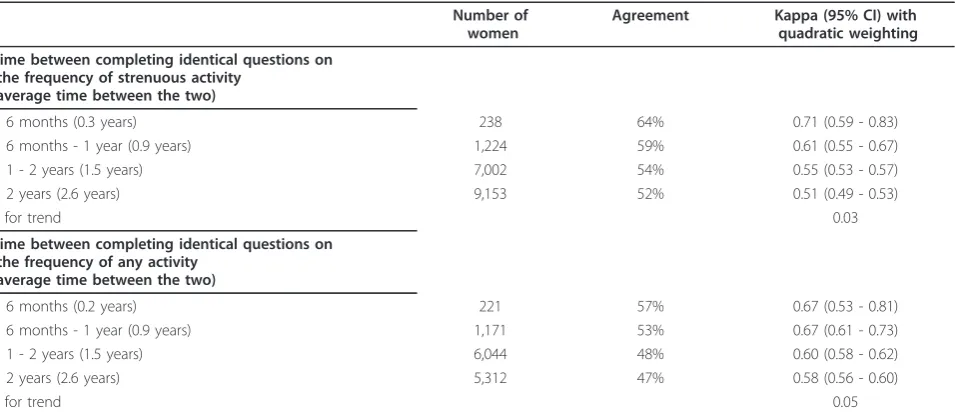
The overall distributions of reported frequency of stren-uous or of any physical activity did not differ greatly according to the interval between first and repeat base-line questionnaires (Figure 1). However, agreement between first and repeat assessments of the frequency of strenuous and of any physical activity decreased over time (Figure 2 and Table 3). Agreement was better among women who completed the same questions less than 6 months apart (weighted = 0.67 andweighted= 0.71 for any activity and strenuous activity respectively) than among those who were asked more than 2 years apart (weighted= 0.58 andweighted= 0.51, respectively). Longer intervals between first and repeat assessments were associated with poorer agreement between responses (for strenuous and any activity, respectively, P = 0.03 and P = 0.05 for trends in weighted kappa statis-tics according to the interval between assessments). Analyses using further sub-categories of the interval between first and repeat baseline testing beyond 2 years did not alter these conclusions.
The repeatability of questions on the frequency of strenuous or of any physical activity according to differ-ences in the season of reporting was similar. Weighted kappa scores for baseline physical activity questions
were: for first response in winter versus repeat response
in winter, weighted = 0.52 (strenuous activity) and
weighted= 0.57 (any activity); for first response in winter
versus repeat response in summer weighted = 0.54
(strenuous activity) andweighted= 0.58 (any activity); for first response in summer versus repeat response in
summer, weighted = 0.57 (strenuous activity) and
weighted= 0.63 (any activity); for first response in sum-mer versus repeat response in winter, weighted= 0.51 (strenuous activity) andweighted= 0.58 (any activity).
Discussion
Our results from a cohort of middle-aged UK women showed that hours and corresponding estimated excess MET-hours for walking, cycling and gardening at fol-low-up were associated with the frequency of both any and strenuous physical activity reported at baseline about 3 years earlier. Mean estimated excess MET-hours for strenuous activity reported at follow-up also increased progressively with each increase in the fre-quency of strenuous physical activity reported at base-line. Similar relationships were found between any activity reported at baseline and an aggregate of various activities (walking, cycling, gardening, housework, and exercise causing sweating or a fast heartbeat) reported at follow-up. Hence, simple questions on the frequency Table 2 Various reported physical activities at follow-up in relation to frequency of activity at baseline
Hours and excess MET-hoursaper week spent doing various activities reported ~3 years after baseline
walking cycling gardening housework
hours mean
MET-hours mean (SD)
hours mean
MET-hours mean (SD)
hours mean
MET-hours mean (SD)
hours mean
MET-hours mean (SD)
Baseline reported frequency of strenuous physical activity
n = 589,632 n = 589,632 n = 589,632 n = 589,632
Never 3.9 9.7 (12.8) 0.1 0.9 (5.7) 2.4 7.3 (9.9) 14.4 28.8 (23.0)
< Once per week 4.4 11.1 (12.1) 0.2 1.5 (6.8) 3.1 9.4 (10.8) 13.8 27.5 (21.2)
Once per week 4.8 12.0 (12.4) 0.3 1.9 (7.7) 3.3 9.8 (11.0) 13.5 27.0 (21.1)
2 to 3 times per week 5.2 13.1 (13.2) 0.4 2.8 (9.8) 3.5 10.5 (12.1) 13.3 26.6 (21.0)
4 to 6 times per week 5.9 14.8 (14.9) 0.6 4.4 (13.1) 3.8 11.4 (13.9) 13.4 26.7 (21.6)
Daily 7.5 18.6 (20.4) 0.6 4.4 (16.5) 4.1 12.3 (15.7) 15.4 30.9 (25.7)
Correlation coefficient 0.18 0.15 0.15 -0.03
P for trend < 0.0001 < 0.0001 < 0.0001 < 0.0001
Baseline reported frequency of any physical activity
n = 589,896 n = 589,896 n = 589,896 n = 589,896
Never 3.2 7.9 (12.7) 0.1 0.6 (4.9) 2.2 6.7 (9.8) 14.7 29.3 (23.7)
< Once per week 3.3 8.2 (11.2) 0.1 0.9 (4.7) 2.6 7.9 (9.8) 13.7 27.3 (21.8)
Once per week 3.7 9.2 (11.3) 0.2 1.3 (6.1) 2.8 8.4 (10.0) 13.5 27.0 (21.6)
2 to 3 times per week 4.4 11.0 (11.5) 0.3 1.8 (7.6) 3.0 9.1 (10.6) 13.4 26.8 (20.8)
4 to 6 times per week 5.2 13.0 (12.1) 0.4 2.7 (9.1) 3.2 9.6 (11.2) 13.5 27.0 (20.5)
Daily 6.5 16.3 (15.9) 0.4 2.6 (10.9) 3.6 10.8 (13.0) 14.8 29.6 (23.3)
Correlation coefficient 0.31 0.11 0.14 0.01
P for trend < 0.0001 < 0.0001 < 0.0001 0.002
a
of strenuous and any activity at baseline predict the esti-mated excess energy expenditure for strenuous and other specific activities, reported about 3 years later.
It has been suggested that older populations tend to be more sedentary, resulting in decreased between-per-son variability when compared to younger populations, and that this may reduce the power of a physical activity measurement instrument to discriminate between differ-ent activity levels [24]. It has also been proposed that measurement error associated with reported physical activity may increase as the proportion of total activity consisting of light intensity activities increases, as often occurs in older populations [25]. Social desirability bias may also influence the ability of some questionnaires to accurately assess self-reported levels of physical activity among middle-aged women [9].
Due to constraints on the length of the baseline ques-tionnaire, simple, frequency-based questions were used to assess physical activity behaviours. At follow-up women reported on hours spent walking, cycling, doing gardening, doing housework, or doing exercise causing sweating or a fast heartbeat. Wareham et al. [26]
showed that a simple four-level physical activity index, derived from questions asking the number of hours per week spent doing physical exercise, cycling and type of occupational physical activity, had high repeatability and was positively associated with objective measures of phy-sical activity, and was therefore useful when ranking the physical activity levels of participants in large scale stu-dies. In the Million Women Study, most women were aged 50 to 64 years at baseline. Only one fifth of women reported being in full-time work on the follow-up questionnaire, hence we did not include work effort.
Women reporting never being active at baseline reported taking on average 21.0 hours per week of var-ious activities (walking, cycling, gardening, housework, and exercise causing sweating or a fast heartbeat) at fol-low-up. The lack of correlation between frequency of baseline activity and housework reported at follow-up may result from women not considering housework when asked to report on physical activity at baseline. However, domestic activities may account for a large proportion of total activity among these women. For example, for women in Britain aged 60 to 79 years,
0 − 0.5 0.6 − 1.0 1.1 − 2.0 >2.0
Percentage of women in each activity group
0
2
04
06
08
0
1
0
0
First response
A. Strenuous activity
rarely/never < once per week once per week
2−3 times per week 4−6 times per week daily
0 − 0.5 0.6 − 1.0 1.1 − 2.0 >2.0
0
2
04
06
08
0
1
0
0
First response B. Any activity
Time between first and repeat baseline questionnaire (years)
Table 3 Agreement of reported physical activity, by time between completing identical questionnaires
Number of women
Agreement Kappa (95% CI) with quadratic weighting
Time between completing identical questions on the frequency of strenuous activity
(average time between the two)
≤6 months (0.3 years) 238 64% 0.71 (0.59 - 0.83)
> 6 months - 1 year (0.9 years) 1,224 59% 0.61 (0.55 - 0.67)
> 1 - 2 years (1.5 years) 7,002 54% 0.55 (0.53 - 0.57)
> 2 years (2.6 years) 9,153 52% 0.51 (0.49 - 0.53)
P for trend 0.03
Time between completing identical questions on the frequency of any activity
(average time between the two)
≤6 months (0.2 years) 221 57% 0.67 (0.53 - 0.81)
> 6 months - 1 year (0.9 years) 1,171 53% 0.67 (0.61 - 0.73)
> 1 - 2 years (1.5 years) 6,044 48% 0.60 (0.58 - 0.62)
> 2 years (2.6 years) 5,312 47% 0.58 (0.56 - 0.60)
P for trend 0.05
P-values for trend in kappa were estimated by weighted least squares regression using the inverse of the variances of the kappa coefficients 0 − 0.5 0.6 − 1.0 1.1 − 2.0 >2.0
Percentage change in activity
0
2
04
06
08
0
1
0
0
more activity same activity less activity
A. Strenuous activity
0 − 0.5 0.6 − 1.0 1.1 − 2.0 >2.0
0
2
04
06
08
0
1
0
0
B. Any activity
Time between first and repeat baseline questionnaire (years)
when domestic activities were not taken into account only 21% were classified as regularly active; whereas when domestic activities were included more than two thirds of these women met the requirements for achiev-ing the recommended levels of physical activity [27]. It is also possible that some women who reported never being active at baseline were subject to a degree of phy-sical impairment that prevented them from engaging in higher-intensity activities, but not necessarily low-inten-sity activities such as housework. No prospective infor-mation was obtained at baseline, however, which indicated levels of physical or functional impairment, and we were therefore unable to examine this hypoth-esis in more detail.
We also examined repeatability of women’s responses to questions on frequency of physical activity over time. The overall distribution of responses to these questions was similar between first and repeat administrations of the same baseline questionnaire, regardless of the inter-val between these assessments. However, agreement between individual women’s responses declined as this interval increased. This was more marked for strenuous activity. In terms of repeatability, our results are consis-tent with those previously reported [5,24,25,28,29], which have shown a decrease in the agreement of physi-cal activity measures with greater time periods between initial and repeat testing. At the population level, a simi-lar distribution across activity groups despite changes among individuals between first and repeat testing has also been reported [19-22].
Measurement errors in the assessment of long term activity patterns result from a combination of variability in answers when completing a questionnaire (resulting from difficulty recalling past activity, differing interpre-tations of the questions, social desirability response bias, and random reporting errors) and real changes in physi-cal activity patterns over time [30]. Overall, these errors are likely to result in attenuation of estimates of associa-tions between physical activity assessed at baseline and disease risk. This attenuation may be substantial and is likely to depend on the assessment instrument as well as participant characteristics [31]. Intensive assessments of physical activity may minimise some sources of error, but can be impractical in larger-scale studies over a long period [1,3,5].
Test/retest reliability of physical activity questionnaires is often examined over short time periods of weeks to a few months [32], but our findings underscore the importance of changes in physical activity over longer periods. The reduction in the repeatability of physical activity responses over time which we have observed is likely to reflect, at least in part, real changes in physical activity patterns. This type of measurement error is of great importance in prospective epidemiological studies,
where risks of various health outcomes during an extended period of follow-up may be estimated accord-ing to baseline self-reported physical activity. Repeatedly measuring different aspects of physical activity over time permits the assessment of the potential magnitude of the attenuation of disease associations. This can be done, for example, by using methods analogous to those used when correcting for “regression dilution bias” [14,16].
Published surveys have reported evidence of changing physical activity levels in diverse populations in devel-oped countries. An analysis of secular trends of physical activity levels in the adult population of the UK from 1991 to 2004 using data from the Health Survey for England, has shown a decline in occupational physical activity, but a progressive increase in sports participation in women aged 50 years and over [33]. Overall, in adults aged 50 to 64 years there was a significant increase from 42.9% to 47.1% (p < 0.001) for those meeting the cur-rent physical activity recommendations. Guthrie [11] showed that within a cohort of Australian-born women, aged 45 to 55 years at baseline in the Melbourne Women’s Midlife Health Project, 14% increased their frequency of physical activity by two or more sessions per week and 12% decreased their activity by the same amount over a 3-year follow-up period. Similarly, among 20 to 59 year old adults from the Netherlands [12], 45% changed their level of physical activity over a ten year period. Similar patterns of change have also been observed in a range of age-groups studied in the UK [10], and the USA [13]. Our study had a longer mean interval between first and repeat baseline ques-tionnaire administrations than many other studies, and is likely to be more conservative in assessing agreement; this may give a more realistic indication of the perfor-mance of similar physical activity questions in an epide-miological setting. As our findings and those of others [5,24,25,28,29] indicate that repeatability decreases with time, it is important to regularly update measures of physical activity in prospective studies [14].
[1,34], and simple questions cannot capture all aspects of physical activity. Despite illustrating that our two dif-ferent self-reported measures of physical activity agree well in terms of ability to rank women according to their level of physical activity, we did not have objective measurements of physical activity against which to com-pare the questionnaire data. We were therefore unable to make direct estimates of the magnitudes of biases in associations between health outcomes and self-reported physical activity data, which are likely to require inde-pendent, objective measures of activity levels [31].
Conclusions
There was generally a good association between basic questions which assess the frequency of any physical activity and of strenuous activity, and the hours of and excess metabolic equivalents estimated from more detailed physical activity questions. Relationships with various physical activities were stronger for walking, cycling, gardening and strenuous physical activities, than they were for housework. As repeatability of reported frequency of physical activity may decrease over time, physical activity data should be regularly updated in prospective studies.
Funding
This work was supported by public funds from Cancer Research UK and the UK Medical Research Council. The funders did not influence the conduct of the study or the preparation of this report.
Steering Committee
Joan Austoker, Emily Banks, Valerie Beral, Judith Church, Ruth English, Jane Green, Julietta Patnick, Richard Peto, Gillian Reeves, Martin Vessey, and Mat-thew Wallis.
NHS Breast Screening Centres collaborating in the Million Women Study (in alphabetical order)
Avon, Aylesbury, Barnsley, Basingstoke, Bedfordshire & Hertfordshire, Cambridge & Huntingdon, Chelmsford & Colchester, Chester, Cornwall, Crewe, Cumbria, Doncas-ter, Dorset, East Berkshire, East Cheshire, East Devon, East of Scotland, East Suffolk, East Sussex, Gateshead, Gloucestershire, Great Yarmouth, Hereford & Worce-ster, Kent (Canterbury, RocheWorce-ster, Maidstone), Kings Lynn, Leicestershire, Liverpool, Manchester, Milton Key-nes, Newcastle, North Birmingham, North East Scotland, North Lancashire, North Middlesex, North Nottingham, North of Scotland, North Tees, North Yorkshire, Not-tingham, Oxford, Portsmouth, Rotherham, Sheffield, Shropshire, Somerset, South Birmingham, South East Scotland, South East Staffordshire, South Derbyshire, South Essex, South Lancashire, South West Scotland,
Surrey, Warrington Halton St Helens & Knowsley, War-wickshire Solihull & Coventry, West Berkshire, West Devon, West London, West Suffolk, West Sussex, Wilt-shire, Winchester, Wirral and Wycombe.
Million Women Study Co-ordinating Centre
Simon Abbott, Miranda Armstrong, Krys Baker, Angela Balkwill, Vicky Benson, Valerie Beral, Judith Black, Anna Brown, Diana Bull, Benjamin Cairns, Dexter Canoy, James Chivenga, Mary Kroll, Barbara Crossley, Gabriella Czanner, Dave Ewart, Sarah Ewart, Lee Fletcher, Toral Gathani, Laura Gerrard, Adrian Goodill, Jane Green, Isobel Green, Joy Hooley, Sau Wan Kan, Carol Keene, Oksana Kirichek, Nicky Langston, Maria-Jose Luque, Lynn Pank, Kirstin Pirie, Gillian Reeves, Andrew Roddam, Emma Sherman, Moya Simmonds, Elizabeth Spencer, Helena Strange, Sian Sweetland, Ali-son Timadjer, Sarah Tipper, Joanna WatAli-son, Stephen Williams, Lucy Wright.
Acknowledgements
We thank all the women who participated in the Million Women Study, collaborators from the NHS Breast Screening Centres, members of the study co-ordinating centre, and the study steering committee (listed below).
Authors’contributions
MEGA participated in the design of the study, performed the statistical analysis, interpreted the data, and drafted the manuscript. BJC helped to draft the manuscript, helped in the statistical analysis and critically revised the manuscript. JG critically revised the manuscript. GKR critically revised the manuscript. VB conceived of the study, participated in its design and coordination and critically revised the manuscript. All authors read and approved the final manuscript.
Competing interests
The authors declare that they have no competing interests.
Received: 14 March 2011 Accepted: 22 June 2011 Published: 22 June 2011
References
1. Laporte RE, Montoye HJ, Casperson CJ:Assessment of physical activity in epidemiologic research: problems and prospects.Public Health Rep1985,
100(2):131-146.
2. Sarkin JA, Nichols JF, Sallis JF, Calfas KJ:Self-report measures and scoring protocols affect prevalence estimates of meeting physical activity guidelines.Med Sci Sport Exer2003,32(1):149-156.
3. Melanson EL Jr, Freedson MS, Freedson PS:Physical activity assessment: a review of methods.Cr Rev Food Sci1996,36(5):385-396.
4. Lamonte MJ, Ainsworth BE:Quantifying energy expenditure and physical activity in the context of dose response.Med Sci Sport Exer2001,33(6): S370-S378.
5. Jacobs JDR, Ainsworth BE, Hartman TJ, Leon AS:A simultaneous evaluation of 10 commonly used physical activity questionnaires.Med Sci Sport Exer1993,25(1):81-91.
6. Baranowski T:Validity and reliability of self report measures of physical activity: an information-processing perspective.Res Q Exercise Sport1988,
59(4):314-327.
7. Durante R, Ainsworth BE:The recall of physical activity: using a cognitive model of the question-answering process.Med Sci Sport Exer1996,
28(10):1282-1291.
8. van de Mortel TF:Faking it: social desirability bias in self-report research.
9. Adams SA, Matthews CE, Ebbeling CB, Moore CG, Cunningham JE, Fulton J, Hebert JR:The effects of social desirability and social approval on self-reports of physical activity.Am J Epidemiol2005,161(4):389-398. 10. Parsons TJ, Manor O, Power C:Changes in diet and physical activity in
the 1990s in a large British sample (1958 birth cohort).Eur J Clin Nutr
2005,59:49-56.
11. Guthrie J:Physical activity: measurement in mid-life women.Acta Obstet Gynecol Scand2002,81:595-602.
12. Picavet HSJ, Wendel-Vos GCW, Vreeken HL, Schuit AJ, WMM V:How stable are physical activity habits among adults? The Doetinchem Cohort Study.Med Sci Sport Exer2010,43(1):74-79.
13. Eaton CB, Reynes J, Assaf AR, Feldman H, Lasater T, Carleton RA:Predicting physical activity change in men and women in two New England communities.Am J Prev Med1993,9(4):209-219.
14. Clarke R, Shipley M, Lewington S, Youngman L, Collins R, Marmot M, Peto R:Underestimation of Risk Associations Due to Regression Dilution in Longterm Follow-up of Prospective Studies.Am J Epidemiol1999,
150(4):341-353.
15. The Million Woman Study Collaborative Group:Million Woman Study: design and characteristics of the study population.Breast Cancer Res
1999,1(1):73-83.
16. MacMahon S, Peto R, Cutler J, Collins R, Sorlie P, Neaton J, Abbott R, Godwin J, Dyer A, Stamler J:Blood pressure, stroke, and coronary heart disease. Part 1, prolonged differences in blood pressure: prospective observational studies corrected for the regression dilution bias.Lancet
1990,335:765-774.
17. Craig CL, Marshall AL, Sjöström M, Bauman AE, Booth ML, Ainsworth BE, Pratt M, Ekelund U, Yngve A, Sallis JF,et al:International Physical Activity Questionnaire: 12-Country Reliability and Validity.Med Sci Sport Exer2003,
35(8):1381-1395.
18. Australian Institute of Health and Welfare:The Active Australia Survey - a guide for implementing analysis and reporting.Canberra: Australian Institute for Health and Welfare;, 22 2003, Cat No. CVD.
19. Ainsworth BE, Haskell WL, Whitt MC, Irwin ML, Swartz AM, Strath SJ, O’Brian WL, Bassett JRDR, Schmitz KH, Emplaincourt PO,et al:Compendium of Physical Activities: an update of activity codes and MET intensities.
Med Sci Sport Exer2000,32(9):S498-S516.
20. Howley ET:Type of activity: resistance, aerobic and leisure versus occupational physical activity.Medicine and Science in Sports and Exercise
2001,33(6):S364.
21. Krippendorff K:Bivariate agreement coeffiecients for reliability of data.In
Social methodology.Edited by: Borgatta EF, Bohrnstedt GW. San Francisco: Jossey-Bass; 1970:.
22. Fleiss JL, Cohen J:The equivalence of weighted kappa and the intraclass correlation coefficient as measures of reliability.Educ psychol meas1973,
33:613-619.
23. Altman DG:Practical statistics for medical research.London: Chapman & Hall; 1991.
24. Cauley JA, Laporte RE, Sandler RB, Schramm MM, Kriska AM:Comparison of methods to measure physical activity in postmenopausal women.Am J Clin Nutr1987,45:14-22.
25. Richardson MT, Leon AS, Jacobs DR Jr, Ainsworth BE, Serfass R:
Comprehensive evaluation of the Minnesota leisure time physical activity questionnaire.J Clin Epidemiol1994,47(3):271-281.
26. Wareham NJ, Jakes RW, Rennie KL, Schuit J, Mitchell J, Hennings S, Day NE:
Validity and repeatability of a simple index derived from the short physical activity questionnaire used in the European Prospective Investigation into Cancer and Nutrition (EPIC) study.Public Health Nutr
2003,6(4):407-413.
27. Lawlor DA, Taylor M, Bedford C, Ebrahim S:Is housewok good for health? Levels of physical activity and factors associated with activity in elderly women. Results from the British Women’s Heart and Health Study.J Epidemiol Community Health2002,56:473-478.
28. Pols MA, Peeters PHM, Bueno-de-Mesquita HB, Ocke MC, Wentink CA, Kemper HCG, Collette HJA:Validity and repeatability of a modified Baecke questionnaire on physical activity.Int J Epidemiol1995,
24(2):381-388.
29. Ainsworth BE, Leon AS, Richardson MT, Jacobs DR, Paffenbarger JRRS:
Accuracy of the college alumnus physical activity questionnaire.J Clin Epidemiol1993,46(12):1403-1411.
30. Wolf AM, Hunter DJ, Colditz GA, Manson JE, Stampfer MJ, Corsano KA, Rosner B, Kriska A, Willett WC:Reproducibility and validity of a self-administered physical activity questionnaire.Int J Epidemiol1994,
23(5):991-999.
31. Ferrari P, Friedenreich C, Matthews CE:The role of measurement error in estimating levels of physical activity.Am J Epidemiol2007,166(7):832-839. 32. Booth ML, Owen N, Bauman AE, Gore CJ:Retest reliability of recall
measures of leisure-time physical activity in Australian adults.Int J Epidemiol1996,25(1):153-159.
33. Stamatakis E, Ekelund U, Wareham NJ:Temporal trends in physical activity in England: The Health Survey for England 1991 to 2004.Prev Med2007,
45:416-423.
34. Harada ND, Chiu V, King AC, Stewart AL:An evaluation of three self-report physical activity instruments for older adults.Med Sci Sport Exer2001,
33(6):962-970.
Pre-publication history
The pre-publication history for this paper can be accessed here: http://www.biomedcentral.com/1471-2288/11/97/prepub
doi:10.1186/1471-2288-11-97
Cite this article as:Armstronget al.:Reported frequency of physical activity in a large epidemiological study: relationship to specific activities and repeatability over time.BMC Medical Research Methodology
201111:97.
Submit your next manuscript to BioMed Central and take full advantage of:
• Convenient online submission
• Thorough peer review
• No space constraints or color figure charges
• Immediate publication on acceptance
• Inclusion in PubMed, CAS, Scopus and Google Scholar
• Research which is freely available for redistribution