124
Research Article
Comparison of selection indices using different weights for biometrical
characters in bajra crop
Kalola A. D., D. J. Parmar, G. N. Motka And P. R. Vaishnav
B. A. College of Agriculture, Anand Agricultural University, Anand- 388 110
(Received: 23 Aug 2017; Revised: 23 Jan 2018; Accepted: 27 Feb 2018) Abstract
The data on different biometrical characters of large scale varietal trial having 21 genotypes of bajra were collected from regional research station, Anand for present study. The experiment was conduct in a Randomized Block Design with three replications. The characters for grain yield (kg/plot) (X1), 1000 seed weight (gm) (X2), ear head length (cm) (X3), ear head girth (cm) (X4) and effective tillers/plant (X5) were used for this analysis. The selection index technique was employed to study the crop improvement using different characters giving different weights to each character. Selection index for individual character, combination of two characters, three characters and so on can be calculated and the combination which provides the higher relative efficiency is selected. Selection index for single or combination of characters which provides the high per cent relative efficiency (PRE) is selected. The genotypic correlation and phenotypic correlation were worked out between yield and yield contributing characters. Selection indices were worked out taking five biometrical characters and were constructed taking all possible combinations of the characters. Total 31 selection indices were constructed using equal weight (W1) for all characters. The genotypic correlation coefficients (W2), phenotypic correlation coefficients (W3), direct effects of biometrical characters based on genotypic (W4) and phenotypic correlations (W5) as weight for different characters. The expected genetic gain and PRE of different indices were calculated. The results indicated that in general PRE with equal weight was higher than rest of the weights in all combinations of indices. The rank correlation among different methods for selection score values were positive and highly significant indicating agreement with all methods except equal weight. Therefore index based genotypic correlation taken as weight is considered better than all other indices.
Keywords
Bajra, selection index, rank correlation, relative efficiency
Introduction
The bajra is one of the most important food grain crops of India and cultivated in 6.98 million hectares area with 8.06 million tones production and productivity of 1154 kg/ha. The bajra crop occupied 0.39 million hectares of area producing 0.79 million tones with productivity of 2004 kg/ha in Gujarat (Anonymous, 2017). The aim of most of the breeding programmes is simultaneous improvement of several characters. It has been recognized that most rapid improvement in the economic value is expected from selection applied simultaneously to all the characters which determine the economic value of a plant, when appropriate weights are assigned to each character according to their relative economic importance. There is no standard procedure to assign weights to the biometrical characters in selection index. The data of large scale varietal trial having 21 bajra genotypes evaluated in a Randomized Complete Block Design with three replications at Regional Research Station, Anand during the summer-2013 and selection index technique was employed to study the crop improvement using different characters giving different weights to each character. The data on grain yield (kg/plot), 1000 seed weight (gm), ear head length (cm), ear head
girth (cm) and effective tillers/plant were used for statistical analysis.
Materials and Methods
Selection index for individual character, combination of two characters, three characters and so on can be calculated and the combination which provides the higher relative efficiency is selected. Genetic gain and percent relative efficiency (PRE) were calculated by using the following formulae. Selection index for single or combination of characters which provides the high PRE was selected.
The expected genetic advance is calculated as = (Z/P)((∑∑aibiGij) / (∑∑bibjpij)
½
) Where Z/P = Selection intensity i.e. 2.06 at 5% level of significance.
Percent Relative efficiency (PRE) is calculated as follows.
125
Genotypic correlation coefficient
Phenotypic correlation coefficient gj 2 gi 2 gigj
ˆ
x
ˆ
ˆ
r
gigj
pj 2 pi 2 pipjˆ
x
ˆ
ˆ
r
pipj
Where,rgigj and rpipj=Genotypic and phenotypic correlation
coefficient between ith and jth character.
ˆ
2gi
and
ˆ
2gj= Genotypic variances of ith and jthcharacter pi
2
ˆ
and
ˆ
2pj= Phenotypic variances of ith and jthcharacter, respectively.
σgigj and σpipj = Genotypic & Phenotypic covariance
between ith and jthcharacter. These correlation coefficients were used as weight for selection index. Selection index proposed by Smith (1936) based on discriminant function of Fisher (1936) was used to calculate genetic worth (H, economic value) of genotypes using different biometrical characters of bajra.
Path analysis will be carried as suggested by (Wright,1921). The direct effects of respective characters were taken as weight for selection index.Pyx1, Pyx2 and Pyx3 represent path coefficients
(direct effect) from cause X1, X2 and X3,
respectively, The path coefficient for path from X1
to Y is defined as
y yx yx
P
P
1 1 1)
x
(y
Results and Discussion
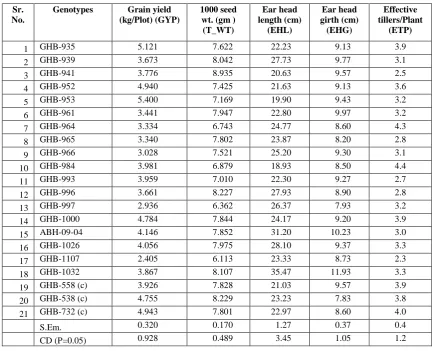
The variation among genotypes for different characters for were found significant. The results of mean performance are given in Table 1(I). The result of grain yield per plot was significantly highest observed in GHB-953 (5.400 kg) followed by GHB-935 (5.121 kg).The result of test weight was recorded significantly highest for the genotype GBH-941 (8.935gm). The genotype GHB-1032 had significantly highest ear head length (35.47 cm) and ear head girth (11.93 cm). The effective tillers/plant was found significant and it ranged from 2.3(GHB-1107) to 4.4 cm (GHB-984).The highest genotypic coefficient of variation (GCV%) were observed for grain yield (17.96%) followed by ear head length (15.33%) and effective tillers per plant (11.56 %). The effective tillers per plant had highest PCV % (24.65%) followed by grain yield per plot (22.86%) which indicated higher influence of environment on these characters. The broad sense heritability was highest for test weight (82.9%) followed by ear head length (76.3%) while the lowest heritability was 22.0% in effective tillers
per plant. (Habib et al , 2007), (Kole et al., 2008), Akinwale et al., 2011), and (Rao et al.,2011). The correlation coefficients between grain yield per plot and its component traits among themselves were estimated at genotypic and phenotypic levels. The results of genotypic and phenotypic correlation coefficients between yield and its components are given in Table 2. Effective tillers per plant had positive and highly significant genetic correlation (rg= 0.818) with grain yield per plot, while for rest
of the characters it was non-significant. Positive and significant correlation (rg=0.626) between ear
head length and ear head girth was observed at genotypic level. None of the characters had significant correlation with grain yield per plot at phenotypic level, while test weight (rp=0.333) and
ear head length (rp=0.453) had positive and
significant correlations with ear head girth at phenotypic level. Effective tillers per plant had positive and significant (rg=0.818) genotypic
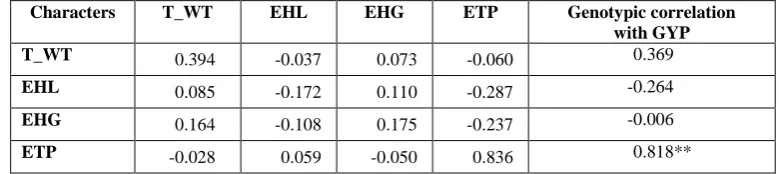
correlation with grain yield per plot and its direct effect was also positive and higher (0.836) on grain yield per plot followed by test weight (0.394) and ear head girth (0.175). In case of indirect effects, ear head girth had higher indirect effect on grain yield per plot via test weight. While, indirect effects of ear head length and girth via effective tillers per plant were negative with higher magnitude. (Table3). Significant and positive genotypic/ phenotypic correlations between fodder yield and leaf width of sorghum was observed as reported by (Yadav, et al., 2003), (Iyanar et al., 2010), (Jain and Patel, 2012) and (Kaour, 2013). (Chaudhary et al., 2017b).
The direct effect of phenotypic path coefficients, test weight (0.283), effective tillers per plant (0.257) and ear head girth (0.236) were having the high direct effect on grain yield per plot. Indirect effect of ear head length (0.107) was observed higher on grain yield per plot via ear head girth but its direct effect was negatively higher on grain yield per plot.(Table 4)
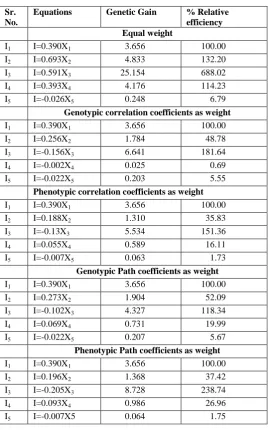
Selection indices were worked out taking five biometrical characters and were constructed taking all possible combinations of the characters. Total 31 selection indices were constructed using equal weight (W1) for all characters. The genotypic correlation coefficients (W2), phenotypic correlation coefficients (W3), direct effects of biometrical characters based on genotypic (W4) and phenotypic correlations (W5) as weight for different characters. The expected genetic gain and percent relative efficiency (PRE) of different indices were worked out and the results are given in Table 5 to 9.
126
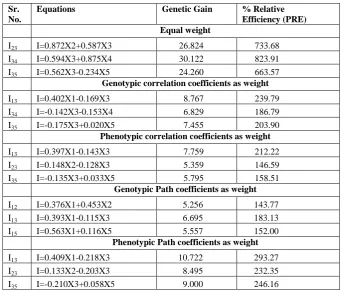
index with different weights. PRE for selection of biometrical characters other than grain yield ranged from 6.79% to 688.02%, 0.69% to 181.64%, 1.73% to 151.36%, 5.67% to 118.34% and 1.75% to 238.74for W1, W2, W3, W4 and W5, respectively (Table 5).The lowest PRE were observed for effective tillers per plant in all weight methods except genotypic correlation coefficient taken as weight while the highest PRE was observed for ear head length in all weight methods. The highest relative efficiency (688.02) was observed for ear head length relative to grain yield with equal weight followed by the method of phenotypic path coefficient taken as weight, genotypic correlation coefficient taken as weight, phenotypic correlation coefficient taken as weight and genotypic path coefficient taken as weight for the same character. Possible combinations of two characters of five yield and yield attributing characters were used to construct selection indices using different weights (W1 to W5) as mentioned above. Total 10 indices in each weight method were constructed and best three indices with their percent relative efficiency are selected (Table6). PRE ranged from 10.03% (ear head girth and effective tillers per plant in genotypic path coefficient as taken weight) to 823.91% (ear head length and girth in equal weight). In equal weight method, the highest PRE was observed for combination of ear head length and ear head girth characters (I34) while
combination of grain yield and ear head length (I13)
gave higher PRE in rest of the methods.
Different indices with their genetic gain and PRE for different weight method are given in Table7. The highest PRE (874.82%) was observed for combination of test weight, ear head length and ear head girth (I234)) in equal weight methods whereas
combination of three characters (grain yield, ear head length and effective tillers per plant) had higher PRE in all methods (I135) except equal
weight method.
There were five possible combinations of four characters and selection indices were worked out with different weights (Table8).Thus, total 25 indices with their genetic gain and their percent relative efficiency are given in Table 8. The results revealed that PRE ranged from 127.14 (test weight, ear head length, ear head girth and tillers per plant (I2345) in genotypic path coefficient taken as
weight) to 856.91(I1234) (grain yield, test weight,
ear head length and ear head girth in equal weight methods) with equal weight. Among other than equal methods, higher PRE was observed for combination of four characters (grain yield, test weight, ear head length and tillers per plant) except genotypic correlation taken as weight, in which combination of grain yield, ear head length and ear head girth and tillers per plant had higher PRE (I1235).
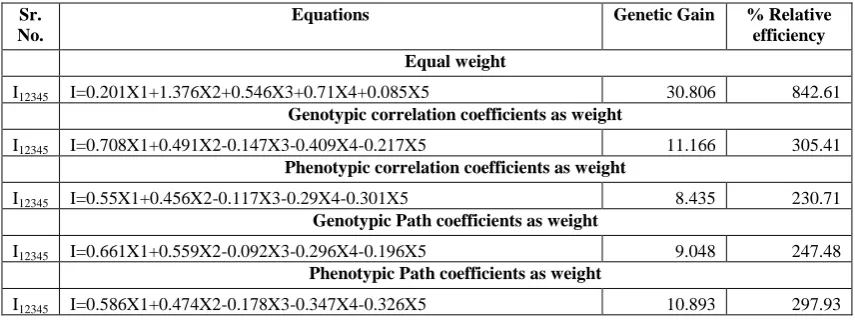
Combinations of all five biometrical characters were used to construct selection indices using different weights. The selection indices with their percent relative efficiency are given in Table 9. Percent relative efficiencies were 842.61, 305.41, 230.71, 247.48 and 297.93% respectively for W1,W2,W3,W4 and W5.
Among all methods, the highest percent relative efficiency was observed to be 842.61 in equal weight methods relative to grain yield followed by the method of genotypic correlation coefficient, phenotypic path coefficient, genotypic path coefficient and phenotypic correlation coefficient taken as weight for the combination of all five characters. (Ferdous, et al., 2010; Chaudhary, A. P., 2017).
Results presented in Table 10 indicated that the highest percent relative efficiency was observed with index I234 (874.82) consisting of test weight,
ear head length and ear head girth with equal weights but in other methods, the highest PRE was observed with the index I1345 (297.04) in the
method of genotypic correlation coefficient taken as weight and in rest of methods, Index I1235showed
highest PRE. Therefore, one can use equal weight of variables for construction of selection indices to achieve higher genetic gain. The selection index consisting of test weight, ear head length and ear head girth (I234) with equal weight was considered
more reliable as it was commonly having highest relative efficiency in all methods.Green fodder yield and grain yield of sorghum have to be simultaneously improved through selection was reported by (Biswas, et al.2001).
The index score values were worked out for all five weight methods for all genotypes in respect of highest PRE given by different combination of characters. The results indicated that in general PRE with equal weight was higher than rest of the weights in all combinations of indices. The rank correlation among different methods for selection score values were positive and highly significant indicating agreement with all methods except equal weight. Looking to the overall results it was observed that selection index with equal weight had highest PRE but rank correlation between grain yield rank and score value rank of equal weight was non-significant whereas rank of other methods had significant positive correlation with grain yield rank. Therefore, the following index based genotypic correlation taken as weight is considered better than all other indices. (Kaour, 2013).
References
127 components in rice (Oryza sativa L.).
Afr. J. PlantSci., 5, 207–212.
Anonymous, (2017). Agricultural statistics at a glance 2016, Directorate of economics and statistics, Ministry of agriculture & farmers welfare, Govt. of India.
Biswas, B. K., Hasanuzzaman, M., El Taj, F., Alam, M. S., & Amin, M. R. (2001).Simultaneous selection for fodder and grain yield in sorghum. Journal of Biological Sciences, 1(5), 321-323.
Chaudhary, A. P., Parmar D. J., Muniya S. D. and Patel K. V. (2017a). Construction of selection index using three different weight methods in rice (oryza sativa l.) Trends in Bioscience,10 (24), 5164-5173.
Chaudhary, A. P., Parmar D. J., Muniya S. D. and Darji V.B. (2017b). Construction of selection index using simple correlation coefficients and path coefficients (direct effects) as a weight in rice.
International Journal of Current Research,
9(7), 53864-53869.
Ferdous, M. F., Shamsuddin, A. K. M., Hasna, D. and Bhuiyan, M. M. R. (2010). Study on relationship and selection index for yield and yield contributing characters in spring wheat. J. Bangladesh Agril. Univ., 8(2): 191–194. Fisher, R. A. (1936). The use of multiple measurements
intaxonomic problems! Annals of Eugenics, 7 (2), 179-188.
Habib, S. H., Iftekharuddaula, K. M., Basha, M. K., Akter, K. & Hossain M. K. (2007). Genetic variation, correlation and selection indices in advanced breeding lines of rice (Oryza sativa
L.). Bangladesh Journal of Plant Breeding and Genetics, 20 (1), 25-32.
Hazel, L. N. (1943). The genetic basis for constructing selection indexes. Genetics, 28(6), 476-490. Iyanar K.,Vijayakumar G., Khan A.K. Fazllullah (2010).
Correlation and path analysis in multicut fodder sorghum. Electronic J. Plant Breeding, 1(4): 1006-1009.
Jain, S. K. and Patel P. R. ( (2012) ). Genetic variability in land races of forage sorghum. Int Jour of Agric Sci., 180-185.
Kole, P. C., Chakraborty, N. R. & Bhat, J. S. (2008). Analysis of variability, correlation and path coefficients in induced mutants of aromatic non-basmati rice! Tropical Agricultural Research and Extension, 11, 60-64.
Kaour, Satvinder. (2013). Comparison of selection indices using different weights in forage sorghum [Sorghum bicolor (L.) Moench].
Unpublished M.Sc. thesis, AAU, Anand .
Rao, V.T., Bhadru, D., Mohan, Y.C. and Bharathi D. (2011). Identification of yield components as selection criteria under aerobic condition in rice. Crop Research, 42 (1, 2 &. 3), 15-17.
Smith, F. (1936). A discriminant function for plant selection. Annals of Eugenics, 7 (3), 240-250.
Yadav, R, Grewal R. P. S. and Pahuja S. K. (2003). association studies for fodder yield and its components in forage sorghum. Forage Research, 230-232.
128
Table 1. (I) Mean performance of twenty one genotypes for yield and yield attributing characters in bajra crop
Sr. No.
Genotypes Grain yield (kg/Plot) (GYP)
1000 seed wt. (gm ) (T_WT)
Ear head length (cm)
(EHL)
Ear head girth (cm)
(EHG)
Effective tillers/Plant
(ETP)
1 GHB-935 5.121 7.622 22.23 9.13 3.9
2 GHB-939 3.673 8.042 27.73 9.77 3.1
3 GHB-941 3.776 8.935 20.63 9.57 2.5
4 GHB-952 4.940 7.425 21.63 9.13 3.6
5 GHB-953 5.400 7.169 19.90 9.43 3.2
6 GHB-961 3.441 7.947 22.80 9.97 3.2
7 GHB-964 3.334 6.743 24.77 8.60 4.3
8 GHB-965 3.340 7.802 23.87 8.20 2.8
9 GHB-966 3.028 7.521 25.20 9.30 3.1
10 GHB-984 3.981 6.879 18.93 8.50 4.4
11 GHB-993 3.959 7.010 22.30 9.27 2.7
12 GHB-996 3.661 8.227 27.93 8.90 2.8
13 GHB-997 2.936 6.362 26.37 7.93 3.2
14 GHB-1000 4.784 7.844 24.17 9.20 3.9
15 ABH-09-04 4.146 7.852 31.20 10.23 3.0
16 GHB-1026 4.056 7.975 28.10 9.37 3.3
17 GHB-1107 2.405 6.113 23.33 8.73 2.3
18 GHB-1032 3.867 8.107 35.47 11.93 3.3
19 GHB-558 (c) 3.926 7.828 21.03 9.57 3.9
20 GHB-538 (c) 4.755 8.229 23.23 7.83 3.8
21 GHB-732 (c) 4.943 7.801 22.97 8.60 4.0
S.Em. 0.320 0.170 1.27 0.37 0.4
CD (P=0.05) 0.928 0.489 3.45 1.05 1.2
(II) Variability: CV,GCV, PCV and h2 for different characters of bajra
Sr. No.
Varibility Grain yield (kg/Plot) (GYP)
1000 seed wt. (gm ) (T_WT)
Ear head length (cm)
(EHL)
Ear head girth (cm)
(EHG)
Effective tillers/Plant
(ETP)
1 CV % 14.15 3.90 8.54 6.90 21.77
2 GCV % 17.96 8.60 15.33 8.81 11.56
3 PCV % 22.86 9.44 17.55 11.19 24.65
4 h2 % 61.70 82.90 76.30 62.00 22.00
129
Table 2. Genotypic (upper diagonal values) and phenotypic (lower diagonal values) correlation coefficients between different characters in bajra
Characters
Grain yield (kg/Plot)
1000 seed wt. (gm )
Ear head Length (cm)
Ear head girth (cm)
Effective tillers/Plant
Grain yield (kg/Plot) 1.000 0.369 -0.264 -0.006 0.818**
1000 seed wt. (gm ) 0.271 1.000 0.217 0.416 -0.071
Ear head Length (cm) -0.220 0.202 1.000 0.626** -0.343
Ear head girth (cm) 0.141 0.333* 0.453** 1.000 -0.284
Effective tillers/Plant 0.255 -0.079 -0.141 -0.122 1.000 *, ** Significant at P<0.05 and <0.01 level, respectively
Table 3. Genotypic path coefficients (direct and indirect effects) of causal characters on grain yield per plot of bajra
Characters T_WT EHL EHG ETP Genotypic correlation
with GYP
T_WT 0.394 -0.037 0.073 -0.060 0.369
EHL 0.085 -0.172 0.110 -0.287 -0.264
EHG 0.164 -0.108 0.175 -0.237 -0.006
ETP -0.028 0.059 -0.050 0.836 0.818**
*, ** Significant at P<=0.05 and 0.01 level, respectively
Table 4. Phenotypic path coefficients (direct and indirect effects) of causal variables on grain yield per plot of bajra
Characters T_WT EHL EHG ETP Genotypic correlation
with GYP
T_WT 0.283 -0.07 0.079 -0.02 0.271
EHL 0.057 -0.347 0.107 -0.036 -0.220
EHG 0.094 -0.157 0.236 -0.031 0.141
130
Table 5. Selection indices, expected genetic gain and relative efficiency (%) for single character by using different weight methods
Sr. No.
Equations Genetic Gain % Relative efficiency Equal weight
I1 I=0.390X1 3.656 100.00
I2 I=0.693X2 4.833 132.20
I3 I=0.591X3 25.154 688.02
I4 I=0.393X4 4.176 114.23
I5 I=-0.026X5 0.248 6.79
Genotypic correlation coefficients as weight
I1 I=0.390X1 3.656 100.00
I2 I=0.256X2 1.784 48.78
I3 I=-0.156X3 6.641 181.64
I4 I=-0.002X4 0.025 0.69
I5 I=-0.022X5 0.203 5.55
Phenotypic correlation coefficients as weight
I1 I=0.390X1 3.656 100.00
I2 I=0.188X2 1.310 35.83
I3 I=-0.13X3 5.534 151.36
I4 I=0.055X4 0.589 16.11
I5 I=-0.007X5 0.063 1.73
Genotypic Path coefficients as weight
I1 I=0.390X1 3.656 100.00
I2 I=0.273X2 1.904 52.09
I3 I=-0.102X3 4.327 118.34
I4 I=0.069X4 0.731 19.99
I5 I=-0.022X5 0.207 5.67
Phenotypic Path coefficients as weight
I1 I=0.390X1 3.656 100.00
I2 I=0.196X2 1.368 37.42
I3 I=-0.205X3 8.728 238.74
I4 I=0.093X4 0.986 26.96
131
Table 6. Selection indices, expected genetic gain and relative efficiency (%) for possible combination of two characters by using different weight methods
Sr. No.
Equations Genetic Gain % Relative
Efficiency (PRE) Equal weight
I23 I=0.872X2+0.587X3 26.824 733.68
I34 I=0.594X3+0.875X4 30.122 823.91
I35 I=0.562X3-0.234X5 24.260 663.57
Genotypic correlation coefficients as weight
I13 I=0.402X1-0.169X3 8.767 239.79
I34 I=-0.142X3-0.153X4 6.829 186.79
I35 I=-0.175X3+0.020X5 7.455 203.90
Phenotypic correlation coefficients as weight
I13 I=0.397X1-0.143X3 7.759 212.22
I23 I=0.148X2-0.128X3 5.359 146.59
I35 I=-0.135X3+0.033X5 5.795 158.51
Genotypic Path coefficients as weight
I12 I=0.376X1+0.453X2 5.256 143.77
I13 I=0.393X1-0.115X3 6.695 183.13
I15 I=0.563X1+0.116X5 5.557 152.00
Phenotypic Path coefficients as weight
I13 I=0.409X1-0.218X3 10.722 293.27
I23 I=0.133X2-0.203X3 8.495 232.35
I35 I=-0.210X3+0.058X5 9.000 246.16
Table 7. Selection indices, expected genetic gain and relative efficiency (%) for possible combination of three characters by using different weight methods
Sr. No.
Equations Genetic Gain % Relative
Efficiency Equal weight
I134 I=0.04X1+0.565X3+0.877X4 28.906 790.65
I234 I=0.836X2+0.591X3+0.875X4 31.984 874.82
I345 I=0.57X3+0.831X4-0.22X5 29.154 797.44
Genotypic correlation coefficients as weight
I123 I=0.387X1+0.408X2-0.174X3 9.142 250.06
I134 I=0.489X1-0.139X3-0.277X4 9.158 250.50
I135 I=0.556X1-0.177X3+0.158X5 10.354 283.20
Phenotypic correlation coefficients as weight
I123 I=0.376X1+0.353X2-0.149X3 8.104 221.66
I134 I=0.466X1-0.108X3-0.201X4 7.558 206.72
I135 I=0.425X1-0.143X3+0.19X5 8.411 230.07
Genotypic Path coefficients as weight
I123 I=0.375X1+0.446X2-0.121X3 7.395 202.26
I125 I=0.554X1+0.401X2+0.14X5 6.701 183.29
I135 I=0.554X1-0.124X3+0.14X5 8.444 230.96
Phenotypic Path coefficients as weight
I123 I=0.394X1+0.331X2-0.222X3 10.868 297.27
I134 I=0.498X1-0.168X3-0.253X4 10.210 279.27
132
Table 8. Selection indices, expected genetic gain and relative efficiency (%) for possible combination of four characters by using different weight methods
Sr. No.
Equations Genetic Gain % Relative
efficiency Equal weight
I1234 I=-0.003X1+1.203X2+0.553X3+0.825X4 31.3288 856.91
I1345 I=0.083X1+0.585X3+0.953X4-0.221X5 30.5305 835.08
I2345 I=0.849X2+0.567X3+0.83X4-0.175X5 31.0346 848.87
Genotypic correlation coefficients as weight
I1234 I=0.467X1+0.484X2-0.144X3-0.301X4 9.5653 261.63
I1235 I=0.545X1+0.375X2-0.181X3+0.179X5 10.6792 292.10
I1345 I=0.671X1-0.14X3-0.347X4+0.12X5 10.8596 297.04
Phenotypic correlation coefficients as weight
I1234 I=0.433X1+0.452X2-0.115X3-0.231X4 8.0748 220.86
I1235 I=0.397X1+0.367X2-0.149X3+0.212X5 8.7605 239.62
I1345 I=0.501X1-0.108X3-0.209X4+0.16X5 8.2161 224.73
Genotypic Path coefficients as weight
I1234 I=0.42X1+0.545X2-0.088X3-0.188X4 7.3318 200.54
I1235 I=0.54X1+0.41X2-0.128X3+0.163X5 9.0092 246.42
I1345 I=0.638X1-0.083X3-0.231X4+0.106X5 8.2650 226.07
Phenotypic Path coefficients as weight
I1234 I=0.463X1+0.471X2-0.175X3-0.285X4 10.5521 288.62
I1235 I=0.412X1+0.349X2-0.222X3+0.234X5 11.4829 314.08
I1345 I=0.531X1-0.168X3-0.261X4+0.173X5 10.8124 295.74
Table 9. Selection indices, expected genetic gain and relative efficiency (%) for all five characters by using different weight methods
Sr. No.
Equations Genetic Gain % Relative
efficiency Equal weight
I12345 I=0.201X1+1.376X2+0.546X3+0.71X4+0.085X5 30.806 842.61
Genotypic correlation coefficients as weight
I12345 I=0.708X1+0.491X2-0.147X3-0.409X4-0.217X5 11.166 305.41
Phenotypic correlation coefficients as weight
I12345 I=0.55X1+0.456X2-0.117X3-0.29X4-0.301X5 8.435 230.71
Genotypic Path coefficients as weight
I12345 I=0.661X1+0.559X2-0.092X3-0.296X4-0.196X5 9.048 247.48
Phenotypic Path coefficients as weight
133
Table 10. Different combinations of characters in top three ranking selection indices in different methods
Combination Rank Equal Wt. Geno. Corr. Wt.
Pheno. Corr. Wt.
Geno. Path coeff. Wt
Pheno path wt. Combination of
two characters
1 I34 (823.91) I13
(239.79)
I13 (212.22) I13 (183.13) I13 (293.27)
2 I23 (733.68) I35
(203.9)
I35 (158.51) I15 (152)
I35 (246.16)
3 I35 (663.57) I34
(186.79)
I23 (146.59) I12 (143.77) I23 (232.35) Combination of
three characters
1 I234 (874.82) I135
(283.2)
I135 (230.07)
I135 (230.96)
I135 (309.59)
2 I345 (797.44) I134
(250.5)
I123 (221.66)
I123 (202.26)
I123 (297.27)
3 I134 (790.65) I123
(250.06)
I134 (206.72)
I125 (183.29)
I134 (279.27) Combination of
four characters
1 I1234 (856.91) I1345
(297.04)
I1235 (239.62)
I1235 (246.42)
I1235 (314.08)
2 I2345 (848.87) I1235
(292.1)
I1345 (224.73)
I1345 (226.07)
I1345 (295.74)
3 I1345 (835.08) I1234
(261.63)
I1234 (220.86)
I1234 (200.54)
I1234 (288.62)
Table 11. Rank correlation between different methods based on (I234)
gyp equal Geno corr Pheno corr Geno path Pheno path
gyp 1.000 - - -
equal -0.242 1.000 - - - -
Geno corr 0.673* -0.725* 1.000 - - -
Pheno corr 0.447* -0.499* 0.826* 1.000 - -
Geno Path 0.506* -0.392 0.782* 0.969* 1.000 -