Issues
ISSN: 2146-4138
available at http: www.econjournals.com
International Journal of Economics and Financial Issues, 2015, 5(4), 954-967.
Is “Harmonious Development” Valid for European Union
Regions?
Görkemli Kazar
1, Altuğ Kazar
2*
1
Department of Economics, Mersin University, Turkey,
2Department of Economics, Tunceli University, Turkey.
*Email: [email protected]
ABSTRACT
This paper analyzes the relationship between income inequality and economic development within 273 Nomenclature of Territorial Units for Statistics European regions. In the study human development index (HDI) values as well as weighted and unweighted gini levels are constructed for each of
these regions for 2000-2010 period. Although there is evidence of narrowing income per capita and HDI differences within the regions, the regional
disparities steady still in Europe. The results show that before the latest enlargement of European Union, the income inequality and economic development relation was in line with the “harmonious development” goal of the treaties. However, the enlargement process spoils this relation as more resources are devoted to underdeveloped regions of the union.
Keywords: Economic Development, Income Inequality, Regional Analysis
JEL Classifications: D3, O10, O11, O18
1. INTRODUCTION
Since 1980’s globalization process formed a more integrated
world economy (Cornia, 2011). As the globalization accelerated
in 1990’s, the structural transformations related with development
disturbed the distribution of income
1(Milanovic, 2002).
Accordingly, a far more unequal global economy emerged over
the last three decades. All these problems led to a general concern
of inequality in the field of development economics for narrowing
the gaps between the “developing” and the “developed” regions
(Pinto, 2013). Early studies mainly stemmed from the Kuznets
hypothesis
2(Kuznets, 1955). Since then, several empirical studies
have been conducted to analyze the relationship between inequality
and growth (Wahiba and Weriemmi, 2014). However, various
conclusions are derived which leaves the relationship between
income inequality and development still a debated issue.
1 Chen and Sapshord (2005) and Kanbur and Venables (2005) showed that
the inequality within countries is increasing all around the world.
2 Kuznets (1955) claims that inequality rises in early stages of development
as industries grow. Then, investing in technology and human capital which becomes the main source of growth causes reduced inequality (Guiga and
Rejeb, 2012).
European Union (EU) is a geo-political entity founded upon
numerous treaties with its own dynamics. However, the regions
with unequal endowments in resources and technology caused the
enlargement policy of the union leading to both winners and losers
(Petrakos, 2009). After the establishment of the Common Market
and the completion of the Economic and Monetary Union, regional
inequalities in Europe attracted a widespread interest
3. In addition,
the convergency issue within the union was examined as a measure
of success of the integration, development and cohesion policies.
European Economic Community Treaty (EEC Treaty) of 1957
reported that “harmonious development” within Europe can be
materialized by reducing regional inequality. As of the Treaty
of Maastricht, majority of states in Europe included in the
European Union. This regional integration leads to economic
convergence
4in European zone by free and easier trade
3 Dunford (1993); Neven and Gouyette (1995); Puga (1999); Braunerhjelm
et al. (2000); Boldrin and Canova (2001); Crespo-Cuaresma et al. (2002)
are some of the studies analyzing the regional disparities.
4 The renewed interest in growth theory (Romer, 1990; Aghion and Howitt,
1998) contributed to literature on economic convergence (Quah, 1997; Barro
Kazar and Kazar: Is “Harmonious Development” Valid for European Union Regions?
International Journal of Economics and Financial Issues | Vol 5 • Issue 4 • 2015 955
(Ben-David 1993, 1996, 2001). But, the European integration
experience displayed divergence in living standards between
sub-national regions within Europe. After the EEC Treaty,
sizable intervention and large regional policy expenditures are
materialized for reducing inequality within regions. However,
a number of studies concluded that inequalities within regions
of Europe rose in spite of economic convergence across states
(Puga, 2001). The studies of Kanbur and Venables (2005),
Ezcurra and Rapun (2006), and Barrios and Strobl (2009)
contributed to the discussion of the relationship between
inequality and development in Europe. These studies showed
conflicting results depending on the time periods and countries
under consideration. The study of Midelfart-Knarvik et al
.
(2000) concluded that the industrial structures of EU Member
States have become increasingly different over the last two
decades. Moreover, when compared to that of Greek, Spanish
and Portuguese accession, expansion of the EU over 12 new
member states increased EU-wide regional inequality. This
result is also supported by international and regional economics
which explains income disparities due to the endowment of
natural resources, factors of production, or technological
differences between regions. Stolper-Samuelson theorem
(1941) states that owners of relative rich endowment factors
may be the winners from integration processes and of relative
poor factors may be the losers of theses processes.
In this study the relationship between the economic development
and inequality for European 273 regions at Nomenclature of
Territorial Units for Statistics
5(NUTS) 2 level is examined
for 2000-2010 period. Unlike previous studies, as a proxy
of development regional HDI is calculated according to new
calculation formula of the United Nations Development
Programme (UNDP) for each NUTS 2 level regions. In addition,
as a proxy of inequality the contribution of the regions to
income inequality is computed by weighted and unweighted
Gini calculation formula. Later, the constructed values and their
ranks are compared to examine the relation between inequality
and development in European regions. The paper is organized
as follows: The next section outlines related literature about
inequality and development including convergence, the third
section summarizes the inequality and development within
European countries, the fourth section describes the data, and the
fifth section provides the results of the calculations and estimation
results. Finally, the sixth section summarises the findings and
provides the conclusions.
2. RELATED LITERATURE
Since 1950’s and 1960’s unequal disribution of resources is
an important concept. Therefore, with the contributions of
Kaldor, Williamson and Kuznets, the trade-off between reducing
inequality and promoting growth became a debated issue. The
relation between income distribution and economic development
5 The Commission uses as regional statistical concept the spatial classification
established by Eurostat on the basis of national administrative units. The
current NUTS classification valid from 1 January 2012 until 31 December 2014 lists 97 regions at NUTS 1, 270 regions at NUTS 2 and 1294 regions
at NUTS 3 level.
was examined by several early studies such as Benabou (1996),
Perotti (1996), Alesina and Rodrik (1994), Alesina and Perotti
(1996) and Persson and Tabellini (1994). They found significant
and large negative relation between inequality and growth. Some
other studies that contribute to the inequality-economic growth
literature are Robinson (1976), Deininger and Squire (1996),
Mbaku (1997), Aghion et al. (1999), Forbes (2000), Galbaith and
Kum (2003) and Chakrabarty (2004).
In 1990’s some of the studies investigating regional convergence
also contribute to additional empirical insights into the relationship
between the regional income disparities and growth (e.g. Barro
and Sala-i-Martin, 1995; Armstrong, 1995; Tondl, 2001; Le Gallo
et al., 2003; Arbia and Piras, 2004). The studies that cover early
periods, except for 1980s and early 1990s, observed the process
of absolute convergence in Europe (Neven and Gouyette, 1995;
Magrini, 1999; Boldrin and Canova, 2001). Since the formation
of EU increased the volume of trade among member countries
(Frankel 1997; Frankel and Rose 2002), economists have started
to search whether single European market and an integrated
monetary policy stimulate convergence. However, integration
theory states two different feasible outcomes: (1) divergence
6due to increasing factor mobility to more developed markets, (2)
convergence in the long run as all members have to satisfy the
macroeconomic criteria (Marques and Soukiazis, 1998). Barro
and Sala-i-Martin (1991), Neven and Guyette (1995), Armstrong
(1995), Ben-David (1993, 2001), Dewhurst and Mutis-Gaitan
(1995); Leonardi (1995), Fagerberg and Verspagen (1996), Paci
(1997) are the examples of the studies that found evidence of
convergence. On the other hand, the studies of Hallett (1981),
Arestis and Paliginis (1995) and Slaughter (1997, 2001) displayed
divergence within the economies. In addition, there were some
mixed results including both convergence and divergence due to
methodology, periods and countries included (Dunford, 1996;
Marques and Soukiazis, 1998). Since regional convergence is
a long run phenomenon, the results of related studies varied
in short run and in long run (e.g., Armstrong, 1995; Barro and
Salai-Martin, 1995).
3. INEQUALITY AND DEVELOPMENT IN
EUROPE
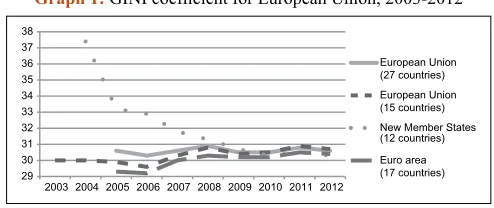
In Graph
1 the Gini coefficient values for EU is given for the
period 2003-2012. The
Graph 1 gives information about the
average distribution of income in former members, new comers
and union as a whole.
The Graph 1 shows that after the biggest enlargement of EU
in 2004, the Gini coefficient sharply declines between 2004
and 2008 period for the new member 12 states (Cyprus,
The Czech Republic, Estonia, Hungary, Latvia, Lithuania,
Malta, Poland, Slovakia, Romania, Bulgaria). However, the
inequality within EU including 15 elderly states displays an
increase after 2005.
6 According to Dall’erba (2003) the gains of integration have benefited
For 2008 onwards, in spite of Eurozone crisis in late 2009,
the inequality fluctuations seem to be settling down for all
classifications of EU countries. So, the published Gini data of
EU shows the combined outcome of government debt crisis with
a banking crisis in Eurozone does not disturb the distribution of
income within the member states. In addition, the enlargement
of EU decreases the inequality for newly comers on account of
at least 1% increase of the inequality for the members already
within the union.
After clarifying the fact that inequality rises within the EU,
Table 1
is formed to show the average change in the income inequality
of European countries considering ex-ante and ex-post Eurozone
crisis. According to the
Table 1, the inequality within most of the
new member states decline throughout 2003-2008 period except
Cyprus, Bulgaria, Latvia, Malta and Romania. On the other hand,
the expansion of EU disturbs the income distribution of Very High
Human Developed elderly members
7.
The Eurozone crisis began with the underreporting budget deficit
of Greek government. The crisis spread to Ireland and Portugal
initially, then effected the other countries within the Eurozone.
Because of the crisis, for countries subject to sovereign debt such
as Cyprus, Greece, Hungary, Ireland, Latvia, Portugal, Romania
and Spain, bailout packages are provided. In addition, as France
owned 10% of that Greek debt, the income inequality within the
country had a rising trend. Although they still have far more fair
distribution than others, Denmark and Sweden faced an increasing
trend in inequality. In expansion and Eurozone crisis period,
Belgium, Ireland, Portugal, United Kingdom, Norway, Lithuania
and Poland had decreasing inequality according to Table 1. On
the other hand, by displaying rising inequality Cyprus, Denmark,
France, Spain and Sweden are the losers of this integration process
and crisis era.
7 Denmark, France, Spain, Sweden, Germany, Finland and Netherlands are
classified as Very High Human Developed countries according to Human
Development Reports of UN.
After the discussion of European countries’ income inequality,
in the Table 2 average annual human development index (HDI)
growth rates and the HDI rank of the countries for the year 2012
are given. According to 2012 HDI Rank standings, most of the
countries within European region are classified as very high
human developed countries and rest are classified as high human
developed countries, Moldova is an exception.
According to
Table 2, the very high human developed EU countries
such as Norway, Germany, Ireland, Iceland, Belgium, Austria,
France, Italy, Luxembourg, Greece, Cyprus, Malta, Hungary,
Portugal are succeed in promoting human development above
the average of the very high developed countries over at least two
decades between 1980 and 2000. Turkey, a candidate country for
membership of EU accomplishes to stay above the average of
high human developed countries’ average annual HDI growth and
this lasts all three periods. The last column of the table presents
the final data about the average annual HDI growth rates for the
period 2000-2012. It shows that 18 out of 28 EU member states
ensure the human development growth rates higher than the
average of the country classifications that they are included in
(Netherlands, Ireland, Sweden, Denmark, Belgium, Luxembourg,
United Kingdom, Portugal, Croatia, Bulgaria are exceptions).
Examining non-EU member countries, Ukraine and Turkey are
the countries that are able to grow faster than the high income
countries average in Human development.
4. DATA
The data related with income distribution such as annual average
population (1000) and regional gross domestic product - million
Euro is taken from the Eurostat database for 2000-2010 period.
In addition, for calculating HDI levels for each of these NUTS 2
regions, life expectancy at birth data is taken from the Eurostat
database. The data that is necessary for HDI calculation such as
mean years of schooling years and expected years of schooling
years are taken at country level from the human development
reports of the UNDP. The methodology of calculation of inequality
and human development index are given in Appendix part.
5. INEQUALITY AND DEVELOPMENT
ANALYSIS
Before the discussion of the inequality and development
phenomenon within Europe, convergence tests are conducted
for understanding the success of the integration. The tests results
given in Table
3 show that β is significant and negative. This
29 30 31 32 33 34 35 36 37 382003 2004 2005 2006 2007 2008 2009 2010 2011 2012
European Union (27 countries) European Union (15 countries) New Member States (12 countries) Euro area (17 countries)
Graph 1: GINI coefficient for European Union, 2003-2012
Source: Eurostat
Table 1: Changes in GINI growth average, 2003-2012
Variables 2003-2008 rising inequality 2003-2008 decreasing inequality
2009-2012 rising
inequality Cyprus
a, Denmark, France, Spain, Sweden Austria, Croatiac, Czech Republica, Estoniaa, Greece,
Italy, Hungarya, Luxembourg, Sloveniaa, Slovekiaa 2009-2012
decreasing inequality Bulgaria
b, Germany, Latviaa, Iceland, Maltaa,
Romaniab, Finland, Switzerland, Netherlands Belgium, Ireland, Lithuania
a, Polanda, Portugal, United Kingdom, Norway
Source: Eurostat-Gini coefficient of equalized disposable income, authors own calculations, aThe new members of EU in 2004, bThe new members of EU in 2007, The new member of EU
Kazar and Kazar: Is “Harmonious Development” Valid for European Union Regions?
International Journal of Economics and Financial Issues | Vol 5 • Issue 4 • 2015 957
means that the income per capita differences within the regions
are narrowing between 2000 and 2010. Therefore, there is a
convergence process within the NUTS2 regions of Europe which is
in line with the second feasible outcome of the integration theory.
Also, the estimated value of β which is 3.4% also indicates the
rate at which regions approach to their steady state. Based on this
value, it would take nearly 20 years to close the half gap between
regions
8. Similar to Konya and Guisan (2008)
Table 4 is formed
to understand whether there is a convergence between European
Regions as HDI values are considered. Test results show that β
takes a significant and negative value which means the HDI values
of the regions are also converging.
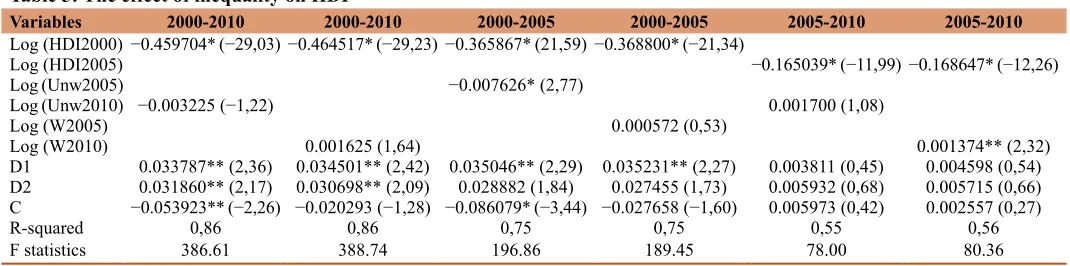
Next, to find a causal relationship between inequality and
HDI growth rate similar to You (2013) the following model is
formulated. The model below also gives us a sight about the effect
of the membership on HDI performances.
HDI growth = Inequality measure + HDI base year + Elderly
member dummy (D1) + New member dummy (D2).
In the analysis two different inequality measures are used namely,
weighted gini and unweighted gini. Three time periods are
used for understanding the relationship between inequality and
development. For longer time period between 2000 and 2010
no significant relationship between inequality and development
has been found. However, the results in Table 5 show that the
membership to the union has positive effects on the growth
of the human development. As an expected outcome being an
elderly member state represents greater values as opposed to a
newcomer. In 2000-2005 period the unweighted gini displays
a negative relationship with human development improvement.
8 Duncan and Fiontes (2006) reports ln(1/2) divided by the respective beta coefficient will give us the years to close half the gap.
Table 2: 2012 HDI rank and average annual HDI Growth, 2010
2012HDI rank
Country name 1980-1990 average annual HDI growth 1990-2000 average annual HDI growth 2000-2010 average annual HDI growth 2000-2012 average annual HDI growth 2012 HDI rank Country
name 1980-1990 average annual HDI growth 1990-2000 average annual HDI growth 2000-2010 average annual HDI growth 2000-2012 average annual HDI growth
1 Norway 0.59 0.79 0.32 0.29 32 Malta 0.59 0.57 0.52 0.46
4 Netherlands 0.52 0.56 0.31 0.28 33 Estonia 0.65 0.62
5 Germany 0.85 0.81 0.53 0.47 35 Slovakia 0.4 0.64 0.57
7 Ireland 0.62 1.04 0.42 0.35 37 Hungary 0.07 1.02 0.48 0.42
7 Sweden 0.38 0.93 0.11 0.12 39 Poland 0.49 0.46
9 Switzerland 0.27 0.49 0.33 0.29 41 Lithuania 0.32 0.68 0.65
13 Iceland 0.58 0.67 0.34 0.33 43 Portugal 1.04 0.93 0.43 0.35
15 Denmark 0.33 0.63 0.34 0.3 44 Latvia 0.35 0.55 0.87 0.82
17 Belgium 0.67 0.79 0.14 0.12 47 Croatia 0.52 0.63 0.54
18 Austria 0.66 0.62 0.51 0.46 56 Romania 0.05 0.99 0.86
20 France 0.75 0.85 0.44 0.38 57 Bulgaria 0.45 0.24 0.77 0.67
21 Finland 0.45 0.54 0.52 0.45 64 Serbia 0.56 0.49
21 Slovenia 0.58 0.48 70 Albania 0.54 0.66 0.59
23 Spain 0.8 1.15 0.43 0.37 78 Ukraine −0.58 0.85 0.8
25 Italy 0.64 0.78 0.56 0.46 90 Turkey 1.85 1.26 1.04 0.95
26 Luxembourg 0.81 0.78 0.16 0.14 113 Moldova −0.93 0.96 0.91
26 United Kingdom 0.47 0.7 0.39 0.33 Very high human
development* 0.56 0.59 0.4 0.36
28 Czech Republic 0.56 0.48 High human
development* 0.81 0.58 0.8 0.72
29 Greece 0.62 0.48 0.67 0.5 Medium human
development* 1.38 1.32 1.41 1.29
31 Cyprus 0.86 0.36 0.5 0.41 Low human
development* 1.05 0.95 1.82 1.62 Source: UN database, *Very high human developed countries are ranking between 1 and 47, high human developed countries are ranking between 48 and 94 (shaded gray area in the table), medium human developed countries are ranking between 95 and 141, HDI: Human development index
Table 3: Per capita income convergence results for
European regions, 2000-2010
Periods included: 10 Cross-sections included: 272 Total panel (unbalanced) observations: 2720 Variable Coefficient Standard error t-statistic
LGDP −0.034 0.002 −16.99 (0.00)
C 0.361 0.019 18.37 (0.00)
R-squared 0.095 F-statistic 288.58 (0.00)
The values in parenthesis show probabilities
Table 4: HDI convergence results for European regions,
2000-2010
Included observations: 257
Variable Coefficient Standard error t-statistic
HDI 2000 −0.697 0.018 −38.76 (0.00)
C 0.670 0.014 47.73 (0.00)
R-squared 0.855 F-statistic 1502.03 (0.00)
This means that within this period increase human development
is achieved by lowering the income inequality within the regions.
In addition, being an elderly member also improves the human
development within the regions. Between 2005 and 2010 there is
a positive relation between weighted gini and human development
index growth. According to this, increase in inequality leads to
a rise in human development. However, this outcome between
inequality and development contradicts with the 2000-2005 period
results which cause insignificant relationship for a longer period
of time (2000-2010). Additionally, in 2005-2010 period both of
the membership dummies do not have significant impacts on the
development levels of the regions.
These results show that the “harmonious development” by
reducing regional inequality within Europe was maintained until
the enlargement of the union. Afterwards, this cohesion policy is
mainly disturbed by unequal endowment of the regions of the new
member states. The sizable regional transfer of European Union
funds for the most of the underdeveloped regions causes this
disturbation by displaying a positive relation between inequality
and human development.
6. CONCLUSION
This paper analyzes the relationship between income inequality
and development within 273 NUTS2 European regions. Unlike
previous studies, the HDI values, weighted and unweighted gini
levels are computed for each of the NUTS2 regions. The general
discusssion about the European countries shows that the biggest
enlargement of EU in 2004 improves the country level equality
in new member states. However, this mainly disturbs the income
distribution in elderly members. The Eurozone crises also harm
the countries in EU that own the Greek debt. Both integration and
Eurozone crises lead to rising inequality in Cyprus, Denmark,
France, Spain and Sweden. In addition, the HDI trends of the
European countries show that most of the member states ensure
the human development growth rates higher than the average of
the country classifications.
After the enlargement, HDI seems to be increasing steadily among
the new comers because of the social policies consistent with EU
norms. But, the integration burden on these countries rises the
regional inequality. Among these, Southern European countries
had a planned economy with rigid labor characterization for long
years. As adaptation to a market oriented economy causes unequal
redistribution of income, population weighted regional inequality
increases. Therefore, to ensure economic growth and cohesion
in EU, it is necessary to activate the labor market reforms of the
lisbon strategy for new comers. In addition, the accumulation
of economic activity generated by the integration, allowed only
the richest regions of a country to converge with higher-income
economies. So, this deepens the interregional income disparities
within EU countries.
The convergence analysis shows that income per capita and
HDI differences among the regions are narrowing. Besides, the
relation between inequality and development display different
characteristics for different periods. Before enlargement the
“harmonious development” is ensured by lower levels of the
inequality. However, the enlargement mainly spoils this goal
by redistributing the funds of the union to the most of the under
developed regions which also contribute to most of the inequality
within the union.
The study finds that “harmonious development” in Europe is
temporarily disturbed with the lower income of the new comers.
Therefore, an equal income distribution will be assured by
the effective use of the Cohesion Funds and Structural Funds
to support the lowest developed regions of the Europe. This
policy will also ensure “harmonious development” and solve the
demographic problems based on factor mobility which deepens the
regional inequality in the EU. For a further discussion, the validity
of the “harmonious development” can be tested and compared for
other economic coorperations.
REFERENCES
Adabar, K. (2005), The Regional Dimensions of Economic Growth in
Indian Federalism. Unpublished PhD Thesis, University of Mysore, Mysore.
Aghion, P., Caroli, E., García-Peñalosa, C. (1999), Inequality and
economic growth: The new perspective of the growth theories.
Journal of Economic Literature, 37, 1615-1660.
Aghion, P., Howitt, P. (1998), Endogenous Growth Theory. Cambridge, MA: MIT Press.
Alesina, A., Perotti, R. (1996), Income distribution, political ınstability, and ınvestment. European Economic Review, 40(6), 1203-1228. Alesina, A., Rodrik, D. (1994), Distributive Politics and Economic
Growth. NBER Working Paper Series, No. 3668.
Table 5: The effect of inequality on HDI
Variables 2000-2010 2000-2010 2000-2005 2000-2005 2005-2010 2005-2010
Log (HDI2000) −0.459704* (−29,03) −0.464517* (−29,23) −0.365867* (21,59) −0.368800* (−21,34)
Log (HDI2005) −0.165039* (−11,99) −0.168647* (−12,26)
Log (Unw2005) −0.007626* (2,77)
Log (Unw2010) −0.003225 (−1,22) 0.001700 (1,08)
Log (W2005) 0.000572 (0,53)
Log (W2010) 0.001625 (1,64) 0.001374** (2,32)
D1 0.033787** (2,36) 0.034501** (2,42) 0.035046** (2,29) 0.035231** (2,27) 0.003811 (0,45) 0.004598 (0,54)
D2 0.031860** (2,17) 0.030698** (2,09) 0.028882 (1,84) 0.027455 (1,73) 0.005932 (0,68) 0.005715 (0,66)
C −0.053923** (−2,26) −0.020293 (−1,28) −0.086079* (−3,44) −0.027658 (−1,60) 0.005973 (0,42) 0.002557 (0,27)
R-squared 0,86 0,86 0,75 0,75 0,55 0,56
F statistics 386.61 388.74 196.86 189.45 78.00 80.36
Kazar and Kazar: Is “Harmonious Development” Valid for European Union Regions?
International Journal of Economics and Financial Issues | Vol 5 • Issue 4 • 2015 959
Arbia, G., Piras, G. (2004), Convergence in per-capita GDP across
European regions using panel data models extended to spatial autocorrelation effects in preparation for the 44th Congress of the European Regiona Science Association, Regions and Fiscal
Federalism. University of Porto, Porto, Portugal. p25-29.
Arestis, P., Paliginis, E. (1995), Divergence and peripheral fordism in
the European union. Review of Social Economy, 53(2), 261-283.
Armstrong, H.W. (1995), An appraisal of the evidence from
cross-sectional analysis of the regional growth process within the European
union. İn: Armstrong, H.W., Vickerman, R.W., editors. Convergence and Divergence Among European Regions. London: Pion. p40-65. Barrios, S., Strobl, E. (2009), The dynamics of regional inequalities.
Regional Science and Urban Economics, 39(5), 575-591.
Barro, R.J., Lee, J.W. (2010), A new data set of educational attainment in the World, 1950–2010. NBER Working Paper 15902, Cambridge, MA: National Bureau of Economic Research. Available from: http:// www.nber.org/papers/w15902. [Last accessed on 2013 Dec 03].
Barro, R., Sala-i-Martin, X.(1991), Convergence across states and regions.
Brooking Papers of Economic Activity, 1, 107-158.
Barro, R., Sala-i-Martin, X. (1992), Convergence. Journal of Political
Economy, 100(2), 223-251.
Barro, R., Sala-i-Martin, X. (1995), Economic Growth. New York: McGraw Hill.
Ben-David, D. (1993), Equalizing exchange: Trade liberalization and
ıncome convergence. The Quarterly Journal of Economics, 108,
653-679.
Ben-David, D. (1996), Trade and convergence among countries. Journal
of International Economics, 40, 279-298.
Ben-David, D. (2001), Trade liberalization and ıncome convergence: A comment. Journal of International Economics, 55, 229-234. Benabou, R. (1996), Inequality and Growth. NBER Macro Annual 1996.
Cambridge: MIT Press.
Boldrin, M., Canova F. (2001), Europe’s regions: Income disparities and regional policies. Economic Policy, 32, 207-253.
Braunerhjelm, P., Faini, R., Norman, V.D., Ruane, F., Seabright, P. (2000),
Integration and the Regions Of Europe: How the Right Policies Can Prevent Polarization. London: Centre for Economic Policy Research.
Chakrabarty, D. (2004), Inequality, Politics and Economic Growth.
33rd Conference of Economists, University of Sydney, Australia, September, 27-30.
Chen, J., Sapshord, D. (2005), Global Development and Poverty
Reduction: The Challenge for International Institutions. Cheltenham: Edward Elgar.
Cornia, G.A. (2011), Economic Integration, Inequality and Growth: Latin America vs. the European economies in transition. Working Papers 101, United Nations, Department of Economics and Social Affairs. Crespo-Cuaresma, J., Dimitiz, M.A., Rizberger-Grünewald, D. (2002),
Growth convergence and EU membership. Oesterreichische Nationalbank Working Papers.
Dall’erba, S. (2003), European Regional Development Policies: History
and Current Issues. University of Illinois EUC Working Paper, Vol. 2, No. 4.
De la Fuente, A. (2000), Convergence across countries and regions:
Theory and empirics. CEPR Discussion Paper. 2465.
Deininger, K., Squire, L. (1996), A new data set for measuring income inequality. World Bank Economic Review, 10, 565-591.
Dewhurst, J.H., Mutis-Gaitan, H. (1995), Varying speeds of regional
GDP per capita convergence in the European union, 1981-91. İn: Armstrong, H.W., Vickerman, R.W., editors. Convergence and
Divergence among European Regions. London: Pion. p22-39.
Duncan, R., Fuentes, R. (2006), Regional convergence in Chile: New tests, old results. Latin American Journal of Economic-formerly Cuadernos de Economia, Institudo de Economia. Pontificia Universidad Catolica
de Chile, 43(127), 81-112.
Dunford, M. (1993), Regional disparities in the European community: Evidence from Regio databank. Regional Studies, 27(8), 727-743. Dunford, M. (1996), Disparities in employment, productivity and output in
the EU: The roles of labour market Governance and welfare regimes.
Regional Studies, 30, 339-357.
Ezcurra, R., Rapun, M. (2006), Regional disparities and national
development revisited: The case of western Europe. European Urban and Regional Studies, 13(4), 355-369.
Fagerberg, J., Verspagen, B. (1996), Heading for divergence. Regional growth in Europe reconsidered. Journal of Common Market Studies, 34, 431-448.
Forbes, K.J. (2000), A reassessment of the relationship between inequality and growth. The American Economic Review, 90(4), 869-887.
Frankel, J. (1997), Regional Trading Blocs in the World Trading System. Washington, DC: Institute for International Economics.
Frankel, J., Rose, A. (2002), An estimate of the effect of common
currencies on trade and income. Quarterly Journal of Economics, 117(2), 437-466.
Galbraith, J. K., Kum, H. (2003). Inequality and Economic Growth: A Global View Based on Measures of Pay. CESifo Economic Studies,
49(4), 527-556.
Guiga, H., Rejeb, J.B. (2014), Poverty, growth and ınequality in
developing countries. International Journal of Economics and
Financial Issues, 2(4), 470-479.
Hallett, E.C. (1981), Economic convergence and divergence in the European
community: A survey of the evidence. İn: Hodges, M., Wallace, W.,
editors. Economic Divergence in the European Community. London:
George Allen and Unwin. p16-31.
IMF, (International Monetary Fund). (2010), Government Finance Statistics. Washington, DC: IMF. Available from: http://www. imf.org/external/pubs/ft/gfs/manual/gfs.htm. [Last accessed on 2015 Jun 03].
Kanbur, R., Venables, A.J. (2007), Spatial disparities and economic development. İn: Held, D., Kaya, A., editors. Global Inequality. Cambridge: Polity Press. p204-215.
Konya, L., Guisan, M-C., (2008). What does the human development index tell us about convergence? Applied Econometrics and International Development, 8(1), 19-40.
Kuznets, S. (1955), Economic growth and income inequality. American
Economic Review, 45, 1-28.
Le Gallo, J., Ertur, C., Baumont, C. (2003), A spatial econometric analysis of convergence across European regions, 1980-1995. İn: Fingleton, B.,
editor. European Regional Growth. Berlin: Springer. p11-53. Leonardi, R. (1995), Convergence, Cohesion, and Integration in the
European Union. New York: St. Martin’s Press.
Lessmann, C. (2011), Regional ınequality and decentralization – An empirical analysis. Environment and Planning A, 44(6), 1363-1388.
Magrini, S. (1999), The evolution of income dispersion among the regions of the European union. Regional Science and Urban Economics, 29(2), 257-281.
Marques, A., Soukiazis, E. (1998), Per capita ıncome convergence across
countries and across regions in the European Union: Some New Evidence. Paper Presented at the International Meeting of European Economy.
Mbaku, J.M. (1997), Inequality in ıncome distribution and economic
development: Evidence using alternative measures of development. Journal of Economic Development, 22(2), 57-67.
Midelfart-Knarvik, K.H., Overmanet, H.G., Redding, S.J., Venables, A.J. (2000), The Location of European Industry. Economic Papers
No. 142, European Commission.
Milanovic, B. (2002), Can we discern the effect of globalization on income
community. Journal of Common Market Studies, 33(1), 47-65. Paci, R. (1997), More similar and less equal. Economic growth in the
European regions. Weltwirtschaftliches Archive, 133(4), 609-634.
Perotti, R. (1996), Growth, income distribution, and democracy: What the data say. Journal of Economic Growth, 1, 149-187.
Persson, T., Tabellini, G. (1994), Is inequality harmful for growth? Theory
and evidence. American Economic Review, 84(3), 600-621. Petrakos, G. (2009), Regional growth and inequalities in the European
union. Discussion Papers Series, Department of Planning and Regional Development, School of Engineering, University of Thessaly, 15(2), 23-44.
Pinto, P.R. (2013), Why inequalities matter. In: Genevey, R., Pachauri, R.K., Tubiana, L., editors. Reducing Inequalities A
Sustainable Development Challenge. New Delhi: The Energy and Resources Institute Press.
Puga, D. (1999), The rise and fall of regional inequalities. European
Economic Review, 43, 303-334.
Puga, D. (2001), European regional policies in light of recent location
theories. Journal of Economic Geography, 2, 373-406.
Robinson, S. (1976), A note on the U hypothesis relating ınequality and economic development. American Economic Review, 66, 437-440. Romer, P. (1990), Endogenous technical change. Journal of Political
Economy, 98, 71-102.
Quah, D. (1997), Empirics for growth and distribution stratification,
polarization and convergence clubs. Journal of Economic Growth, 2, 27-59.
Sala-i-Martin, X. (2006), The world distribution of income: Falling
poverty and convergence, period. Quarterly Journal of Economics, 121(2), 351-397.
Shaban, R., Asoaka, H., Barnes, B., Drebentsov, V., Langenbrunner, J.,
Zurab, S., Stevens, J., Tarr, D., Tesliuc, E., Shabalina, O., Yemtsov, R.
(2006), Reducing Poverty Through Growth and Social Policy Reform in Russia. USA: The International Bank for Reconstruction and
Development, The World Bank.
Shah, A. (2008), Macrofederalism and Local Finance. USA: The International
Bank for Reconstruction and Development, The World Bank.
Shankar, R., Shah, A. (2003), Bridging the economic divide within countries – A scorecard on the performance of regional policies in reducing regional ıncome disparities. World Development, 31(8),
1421-1441.
Slaughter, M.J. (1997), Per capita ıncome convergence and the role of ınternational trade. American Economic Review, 87, 194-199. Slaughter, M.J. (2001), Trade liberalization and per capita ıncome
convergence: A difference-in-differences analysis. Journal of International Economics, 55, 203-228.
Tondl, G. (2001), Convergence after Divergence? Regional Growth in
Europe. Wien, New York: Springer.
UNDESA, (United Nations Department of Economic and Social Affairs). (2009), World Population Prospects: The 2008 Revision. Highlights. Working Paper No. ESA/P/WP.210.
UNDESA, (United Nations Department of Economic and Social Affairs). (2011), World Population Prospects: The 2010 Revision. New York: UNDESA.
UNESCO, (United Nations Educational, Scientific and Cultural
Organization), Institute for Statistics. (2011), UNESCO Institute for Statistics Data Site. New York. Available from: http://www.data.uis. unesco.org. [Last accessed on 2015 Jun 03].
UNDP, (United Nations Development Programme). (2010), Human Development Report 2011 The Real Wealth of Nations: Pathways
to Human Development. New York: UNDP.
UNDP, (United Nations Development Programme). (2013), United Nations
Development Programme International Human Development
Indicators Database. Available from: http://www.hdr.undp.org/en/ data. [Last accessed on 2015 Jun 03].
Wahiba, N.F., Weriemmi, M.E. (2014), The relationship between
economic growth and income inequality. International Journal of Economics and Financial Issues, 4(1), 135-143.
APPENDIx 1
A.1. Calculating Income Inequality for NUTS 2 Regions of Europe
Income distribution not only is unequal among the quintiles and rural-urban areas but also has regional aspects. Shankar and Shah (2003)
introduced two different calculation methods for Gini index, namely unweighted Gini index and weighted Gini index, in order to clarify
the disparities among the regions by taking population into consideration. Following Shankar and Shah (2003) the same formulation
is used by Adabar (2005), Shaban et. al. (2006), Shah (2008) and Lessmann (2011) that show the regional inequalities. Taking these
studies into consideration, similar inequality analysis will be conducted at NUTS 2 level for Europe. The calculation method firstly
calculates the inequality within regions and then enables us to reach the inequality at the country level. As we are mainly interested in
NUTS 2 level regions, the initial calculations will represent the partial contributions of the regions to the Gini index.
Unweighted Gini index is described as:
G
j n
i n
u u
i j
y
n (n
)
y
y
=
−
∑
∑
−
1
2
1
1
(1)
Whereas the weighted Gini index, G
w, paying attention to the role of population is described as:
G
p p
P
j n
i n
w i j i j
y
y
y
=
∑
∑
−
1
2
2(2)
in which:
G
w: The weighted Gini index.
G
u: The unweighted Gini index.
y
u: The unweighted mean of per capita gross domestic products of regions.
y
: The national mean of per capita gross domestic product.
y
i: Per capita gross domestic products of the region i.
y
j: Per capita gross domestic products of the region j.
n: Number of regions.
P: National population.
p
i: Population region i.
p
j: Population region j.
G
utakes values between 0-1, whereas G
wtakes values between 0 - [1-(p
i/p)]. In this scaling, 0 stands for perfect equality. In addition,
1 and 1-(p
i/p) denotes perfect inequality for G
uand G
w, respectively. If the region with small portion of population has greater portion
of gross domestic product, the value for perfect inequality for G
wwould approach to 1. The calculated Gini value approaching to 1
implies that the income inequality among regions or provinces is increasing.
A.2. Calculating Human Development Index for NUTS 2 Regions of Europe
The first step for calculating Human Development Index is the construction of the sub-indexes, namely Life expectancy index;
Education index and Income index. However, the units of the raw data that are used in the calculation process are different. The units
of Life expectancy index and Education index are years, whereas the unit of the raw data related with Income index is the per capita
Purchasing Power Parity (PPP) United States (US) dollars. In addition, even if the raw data units are the same for Life expentancy
index and Education index, the magnitudes of these indicators are dissimilar (UNDP, 2010; UNDP 2013). Identifying each of these
sub-indices as dimension index is calculated as:
highest of the observed values of 1980-2011 period and minimum values are determined at the subsistence levels. According to data
of UNDESA (2009) and UNDESA (2011), the maximum of the expected life expectancy value is observed as 83.2 years in Japan for
the year 2010 and the minimum value is taken as 20 years. Similarly, using the data of Barro and Lee (2010) and UNESCO (2011) the
expected years of schooling takes the highest value 20.6 in Australia and mean years of schooling takes the highest value 13.2 in United
States for the year 2010. The calculations of the HDI and its sub-components for the year 2010 show that New Zealand has the highest
education index level with the value of 0.951. In addition, for determining the highest and lowest values of income level the observed
levels of incomes within the studies World Bank (2010) and IMF (2010) are examined. The maximum per capita gross national income
(GNI) value is taken as the value of United Arab Emirates which is $108211
1and $163 (the value attained in Zimbabwe in 2008) is
determined as the minimum value.
The dimension index is calculated as geometric average of sub-indices
2. For the purpose of our study since the income data used in
the study is in terms of Euro, in order to calculate the income index, the maximum and minimum values are transformed to Euro using
reported PPP data of OECD for the year 2010
3.
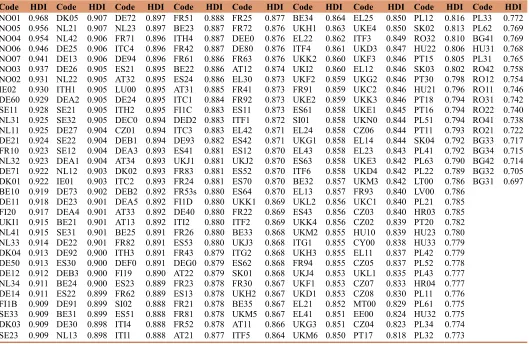
A.3. NUTS2 Regions Codes
Austria (AT): AT11: Burgenland(AT), AT12: Niederösterreich, AT13: Wien, AT21: Kärnten, AT22: Steiermark, AT31: Oberösterreich,
AT32: Salzburg, AT33: Tirol, AT34: Vorarlberg.
Belgium (BE): BE10: Rég. Bruxelles/Brussels Gewest, BE21: Prov. Antwerpen, BE22: Prov. Limburg (BE), BE23: Prov.
Oost-Vlaanderen, BE24: Prov. Vlaams-Brabant, BE25: Prov. West-Oost-Vlaanderen, BE31: Prov. Brabant Wallon, BE32: Prov. Hainaut, BE33:
Prov. Liège, BE34: Prov. Luxembourg (BE), BE35: Prov. Namur.
Bulgaria (BG):
BG31: Severozapaden, BG32: Severentsentralen, BG33: Severoiztochen, BG34: Yugoiztochen, BG41: Yugozapaden,
BG42: Yuzhen tsentralen.
Cyprus (CY): CY00: Kypros.
Czech Republic (CZ): CZ01: Praha, CZ02: Stredni, Cechy, CZ03: Jihozápad, CZ04: Severozápad, CZ05: Severovýchod, CZ06:
Jihovýchod, CZ07: Strední Morava, CZ08: Moravskoslezsko.
Germany (DE): DE11: Stuttgart, DE12: Karlsruhe, DE13: Freiburg, DE14: Tübingen, DE21: Oberbayern, DE22: Niederbayern,
DE23: Oberpfalz, DE24: Oberfranken, DE25: Mittelfranken, DE26: Unterfranken, DE27: Schwaben, DE30: Berlin, DE40:
Brandenburg, DE50: Bremen, DE60: Hamburg, DE71: Darmstadt, DE72: Gießen, DE73: Kassel, DE80: Mecklenburg-Vorpommern,
DE91: Braunschweig, DE92: Hannover, DE93: Lüneburg, DE94: Weser-Ems, DEA1: Düsseldorf, DEA2: Köln, DEA3: Münster,
DEA4: Detmold, DEA5: Arnsberg, DEB1: Koblenz, DEB2: Trier, DEB3: Rheinhessen-Pfalz, DEC0: Saarland, DED2: Dresden,
DEE0: Sachsen-Anhalt, DEF0: Schleswig-Holstein, DEG0: Thüringen, DK01: Hovedstaden, DK02: Sjælland, DK03: Syddanmark,
DK04: Midtjylland, DK05: Nordjylland.
Estonia (EE): EE00: Eesti EE00: Eesti.
Greece (EL): EL11: Anatoliki Makedonia Thraki, EL12: Kentriki Makedonia, EL13: Dytiki Makedonia, EL14: Thessalia, EL21:
Ipeiros, EL22: Ionia Nisia, EL23: Dytiki Ellada, EL24: Sterea Ellada,EL25: Peloponnisos, EL30: Attiki, EL41: Voreio Aigaio, EL42:
Notio Aigaio, EL43: Kriti.
Spain (ES): ES11: Galicia, ES12: Principado de Asturias, ES13: Cantabria, ES21: País Vasco, ES22: Comunidad Foral de Navarra,
ES23: La Rioja, ES24: Aragón, ES30: Comunidad de Madrid,ES41: Castilla y León, ES42: Castilla-la Mancha, ES43: Extremadura,
ES51: Cataluña, ES52: Comunidad Valenciana, ES53: Illes Balears, ES61: Andalucía, ES62: Región de Murcia,ES63: Ciudad Autónoma
de Ceuta (ES), ES64: Ciudad Autónoma de Melilla (ES), ES70: Canarias (ES).
Finland (FI): FI19: Länsi-Suomi, FI1B: Helsinki-Uusimaa, FI1C: Etelä-Suomi, FI1D: Pohjois- ja Itä-Suomi, FI20: Åland.
France (FR): FR10: Île de France, FR21: Champagne-Ardenne, FR22: Picardie, FR23: Haute-Normandie, FR24: Centre (FR), FR25:
Basse-Normandie, FR26: Bourgogne, FR30: Nord - Pas-de-Calais, FR41: Lorraine, FR42: Alsace, FR43: Franche-Comté, FR51: Pays
de la Loire, FR52: Bretagne, FR53: Poitou-Charentes, FR61: Aquitaine, FR62: Midi-Pyrénées, FR63: Limousin, FR71: Rhône-Alpes,
1 1980 value.
2 For detailed information about calculation, see UNDP(2010).
FR72: Auvergne, FR81: Languedoc-Roussillon, FR82: Provence-Alpes-Côte d’Azur, FR83: Corse, FR91: Guadeloupe (FR), FR92:
Martinique (FR), FR93: Guyane (FR), FR94: Réunion (FR).
Croatia (HR): HR03: Jadranska Hrvatska, HR04: Kontinentalna Hrvatska.
Hungary (HU): HU10: Közép-Magyarország, HU21: Közép-Dunántúl, HU22: Nyugat-Dunántúl, HU23: Dél-Dunántúl, HU31:
Észak-Magyarország, HU32: Észak-Alföld, HU33: Dél-Alföld.
Ireland (IE): IE01: Border, Midland and Western, IE02: Southern and Eastern.
Italy (IT): ITC1: Piemonte, ITC2: Valle d’Aosta/Vallée d’Aoste, ITC3: Liguria, ITC4: Lombardia, ITF1: Abruzzo, ITF2: Molise, ITF3:
Campania, ITF4: Puglia, ITF5: Basilicata, ITF6: Calabria, ITG1: Sicilia, ITG2: Sardegna, ITH1: Provincia Autonoma di Bolzano/
Bozen, ITH2: Provincia Autonoma di Trento, ITH3: Veneto, ITH4: Friuli-Venezia Giulia, ITI1: Toscana, ITI2: Umbria, ITI4: Lazio.
Lithuania (LT): LT00: Lietuva.
Luxembourg (LU): LU00: Luxembourg.
Latvia (LV): LV00: Latvija.
Malta (MT): MT00: Malta.
Netherlands (NL):
NL11: Groningen, NL12: Friesland (NL), NL13: Drenthe, NL21: Overijssel, NL22: Gelderland, NL23: Flevoland,
NL31: Utrecht, NL32: Noord-Holland, NL33: Zuid-Holland, NL34: Zeeland, NL41: Noord-Brabant, NL42: Limburg (NL).
Norway (NO): NO01: Oslo og Akershus, NO02: Hedmark og Oppland, NO03: Sør-Østlandet, NO04: Agder og Rogaland, NO05:
Vestlande, NO06: Trøndelag, NO07: Nord-Norge.
Poland (PL): PL11: Lódzkie, PL12: Mazowieckie, PL21: Malopolskie, PL22: Slaskie, PL31: Lubelskie, PL32: Podkarpackie, PL33:
Swietokrzyskie, PL34: Podlaskie, PL41: Wielkopolskie, PL42: Zachodniopomorskie, PL43: Lubuskie, PL51: Dolnoslaskie, PL52:
Opolskie, PL61: Kujawsko-Pomorskie, PL62: Warminsko-Mazurskie, PL63: Pomorskie, PT11: Norte.
Portugal (PT): PT15: Algarve, PT16: Centro (PT), PT17: Lisboa, PT18: Alentejo, PT20: Região Autónoma dos Açores (PT), PT30:
Região Autónoma da Madeira (PT).
Romania (RO):
RO11: Nord-Vest, RO12: Centru, RO21: Nord-Est, RO22: Sud-Est, RO31: Sud - Muntenia, RO32: Bucuresti - Ilfov,
RO41: Sud-Vest Oltenia, RO42: Vest.
Sweden (SE): SE11: Stockholm, SE12: Östra Mellansverige, SE21: Småland med öarna, SE22: Sydsverige, SE23: Västsverige, SE31:
Norra Mellansverige, SE32: Mellersta Norrland, SE33: Övre Norrland.
Slovenia (SI): SI01: Vzhodna Slovenija, SI02: Zahodna Slovenija.
Slovakia (SK): SK01: Bratislavský kraj, SK02: Západné Slovensko, SK03: Stredné Slovensko, SK04: Východné Slovensko.
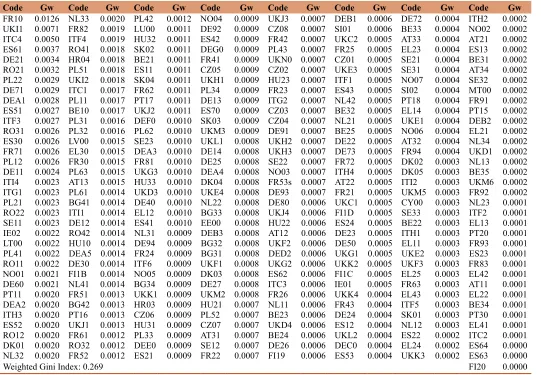
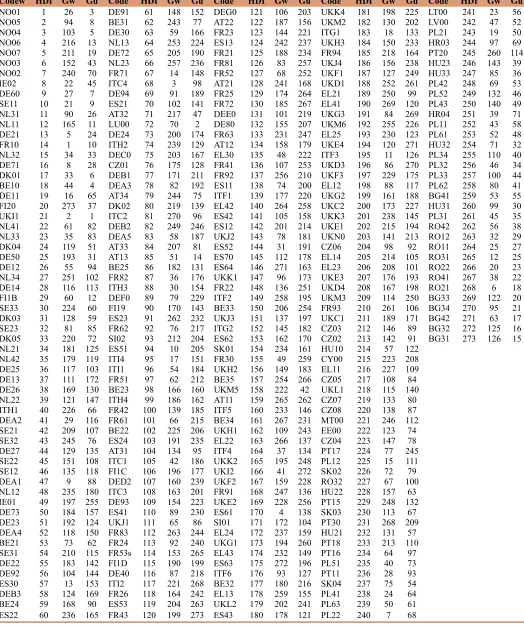
Table A4.1: Weighted Gini calculation of Europe using NUTS regions, 2010
Code Gw Code Gw Code Gw Code Gw Code Gw Code Gw Code Gw Code Gw
FR10 0.0126 NL33 0.0020 PL42 0.0012 NO04 0.0009 UKJ3 0.0007 DEB1 0.0006 DE72 0.0004 ITH2 0.0002
UKI1 0.0071 FR82 0.0019 LU00 0.0011 DE92 0.0009 CZ08 0.0007 SI01 0.0006 BE33 0.0004 NO02 0.0002
ITC4 0.0050 ITF4 0.0019 HU32 0.0011 ES42 0.0009 FR42 0.0007 UKC2 0.0005 AT33 0.0004 AT21 0.0002
ES61 0.0037 RO41 0.0018 SK02 0.0011 DEG0 0.0009 PL43 0.0007 FR25 0.0005 EL23 0.0004 ES13 0.0002
DE21 0.0034 HR04 0.0018 BE21 0.0011 FR41 0.0009 UKN0 0.0007 CZ01 0.0005 SE21 0.0004 BE31 0.0002
RO21 0.0032 PL51 0.0018 ES11 0.0011 CZ05 0.0009 CZ02 0.0007 UKE3 0.0005 SE31 0.0004 AT34 0.0002
PL22 0.0029 UKI2 0.0018 SK04 0.0011 UKH1 0.0009 HU23 0.0007 ITF1 0.0005 NO07 0.0004 SE32 0.0002
DE71 0.0029 ITC1 0.0017 FR62 0.0011 PL34 0.0009 FR23 0.0007 ES43 0.0005 SI02 0.0004 MT00 0.0002
DEA1 0.0028 PL11 0.0017 PT17 0.0011 DE13 0.0009 ITG2 0.0007 NL42 0.0005 PT18 0.0004 FR91 0.0002
ES51 0.0027 BE10 0.0017 UKJ2 0.0011 ES70 0.0009 CZ03 0.0007 BE32 0.0005 EL14 0.0004 PT15 0.0002
ITF3 0.0027 PL31 0.0016 DEF0 0.0010 SK03 0.0009 CZ04 0.0007 NL21 0.0005 UKE1 0.0004 DEB2 0.0002
RO31 0.0026 PL32 0.0016 PL62 0.0010 UKM3 0.0009 DE91 0.0007 BE25 0.0005 NO06 0.0004 EL21 0.0002
ES30 0.0026 LV00 0.0015 SE23 0.0010 UKL1 0.0008 UKH2 0.0007 DE22 0.0005 AT32 0.0004 NL34 0.0002
FR71 0.0026 EL30 0.0015 DEA3 0.0010 DE14 0.0008 UKH3 0.0007 DE73 0.0005 FR94 0.0004 UKD1 0.0002
PL12 0.0026 FR30 0.0015 FR81 0.0010 DE25 0.0008 SE22 0.0007 FR72 0.0005 DK02 0.0003 NL13 0.0002
DE11 0.0024 PL63 0.0015 UKG3 0.0010 DEA4 0.0008 NO03 0.0007 ITH4 0.0005 DK05 0.0003 BE35 0.0002
ITI4 0.0023 AT13 0.0015 HU33 0.0010 DK04 0.0008 FR53s 0.0007 AT22 0.0005 ITI2 0.0003 UKM6 0.0002
ITG1 0.0023 PL61 0.0014 UKD3 0.0010 UKE4 0.0008 DE93 0.0007 FR21 0.0005 UKM5 0.0003 FR92 0.0002
PL21 0.0023 BG41 0.0014 DE40 0.0010 NL22 0.0008 DE80 0.0006 UKC1 0.0005 CY00 0.0003 NL23 0.0001
RO22 0.0023 ITI1 0.0014 EL12 0.0010 BG33 0.0008 UKJ4 0.0006 FI1D 0.0005 SE33 0.0003 ITF2 0.0001
SE11 0.0023 DE12 0.0014 ES41 0.0010 EE00 0.0008 HU22 0.0006 ES24 0.0005 BE22 0.0003 EL13 0.0001
IE02 0.0022 RO42 0.0014 NL31 0.0009 DEB3 0.0008 AT12 0.0006 DE23 0.0005 ITH1 0.0003 PT20 0.0001
LT00 0.0022 HU10 0.0014 DE94 0.0009 BG32 0.0008 UKF2 0.0006 DE50 0.0005 EL11 0.0003 FR93 0.0001
PL41 0.0022 DEA5 0.0014 FR24 0.0009 BG31 0.0008 DED2 0.0006 UKG1 0.0005 UKE2 0.0003 ES23 0.0001
RO11 0.0022 DE30 0.0014 ITF6 0.0009 UKF1 0.0008 UKG2 0.0006 UKK2 0.0005 UKF3 0.0003 FR83 0.0001
NO01 0.0021 FI1B 0.0014 NO05 0.0009 DK03 0.0008 ES62 0.0006 FI1C 0.0005 EL25 0.0003 EL42 0.0001
DE60 0.0021 NL41 0.0014 BG34 0.0009 DE27 0.0008 ITC3 0.0006 IE01 0.0005 FR63 0.0003 AT11 0.0001
PT11 0.0020 FR51 0.0013 UKK1 0.0009 UKM2 0.0008 FR26 0.0006 UKK4 0.0004 EL43 0.0003 EL22 0.0001
DEA2 0.0020 BG42 0.0013 HR03 0.0009 HU21 0.0007 NL11 0.0006 FR43 0.0004 ITF5 0.0003 BE34 0.0001
ITH3 0.0020 PT16 0.0013 CZ06 0.0009 PL52 0.0007 BE23 0.0006 DE24 0.0004 SK01 0.0003 PT30 0.0001
ES52 0.0020 UKJ1 0.0013 HU31 0.0009 CZ07 0.0007 UKD4 0.0006 ES12 0.0004 NL12 0.0003 EL41 0.0001
RO12 0.0020 FR61 0.0012 PL33 0.0009 AT31 0.0007 BE24 0.0006 UKL2 0.0004 ES22 0.0002 ITC2 0.0001
DK01 0.0020 RO32 0.0012 DEE0 0.0009 SE12 0.0007 DE26 0.0006 DEC0 0.0004 EL24 0.0002 ES64 0.0000
NL32 0.0020 FR52 0.0012 ES21 0.0009 FR22 0.0007 FI19 0.0006 ES53 0.0004 UKK3 0.0002 ES63 0.0000
Table A4.2: Unweighted Gini calculation of Europe using NUTS Regions, 2010
Code Gu Code Gu Code Gu Code Gu Code Gu Code Gu Code Gu Code Gu
UKI1 0.0043 PL31 0.0014 HR03 0.0011 DE25 0.0009 EL22 0.0008 UKC1 0.0007 ES51 0.0007 DED2 0.0007
LU00 0.0041 HU33 0.0014 NO02 0.0011 SI01 0.0009 ES61 0.0008 DE13 0.0007 BE22 0.0007 FR24 0.0007
NO01 0.0034 FI20 0.0013 HR04 0.0011 EL14 0.0009 DK02 0.0008 UKK1 0.0007 DE80 0.0007 UKL2 0.0007
BE10 0.0028 RO42 0.0013 DK05 0.0011 FR93 0.0009 UKL1 0.0008 DE24 0.0007 CY00 0.0007 FR26 0.0007
NO04 0.0024 HU23 0.0013 PL51 0.0011 SE21 0.0009 ES21 0.0008 UKF3 0.0007 PT30 0.0007 UKH1 0.0007
DK01 0.0022 PL34 0.0013 EE00 0.0011 SE22 0.0009 DE22 0.0008 FR82 0.0007 FR92 0.0007 FR83 0.0007
DE60 0.0022 PL62 0.0013 AT34 0.0011 EL11 0.0009 FI19 0.0008 FI1C 0.0007 DEB1 0.0007 PT17 0.0007
NO05 0.0021 UKM5 0.0013 SE32 0.0011 PT18 0.0009 DE92 0.0008 ES70 0.0007 FR51 0.0007 DEB2 0.0007
SE11 0.0021 NO03 0.0013 BE31 0.0011 PL12 0.0009 UKK3 0.0008 AT12 0.0007 UKN0 0.0007 FR63 0.0007
FR10 0.002 PL33 0.0013 CZ04 0.0011 MT00 0.0009 ITF5 0.0008 NL12 0.0007 ES12 0.0007 UKK2 0.0007
NL11 0.0019 IE02 0.0013 SK02 0.0011 DE14 0.0009 NL22 0.0008 UKJ2 0.0007 FR61 0.0007 UKF1 0.0007
FI1B 0.0017 PL52 0.0013 CZ07 0.0011 PT20 0.0009 FR71 0.0008 ITG2 0.0007 BE32 0.0007 UKM3 0.0007
NO06 0.0016 AT32 0.0013 AT33 0.001 SE31 0.0009 EL43 0.0008 UKH2 0.0007 FR62 0.0007 FR22 0.0007
AT13 0.0016 PL61 0.0013 NL41 0.001 DEA2 0.0009 DEA4 0.0008 ITI1 0.0007 DE40 0.0007 FR52 0.0007
BG31 0.0016 PL43 0.0013 NL33 0.001 EL12 0.0009 ITI4 0.0008 FR42 0.0007 DEE0 0.0007 FR41 0.0007
BG32 0.0016 PL21 0.0013 CZ05 0.001 SE12 0.0009 DE91 0.0008 ITC1 0.0007 ITF1 0.0007 BE33 0.0007
BG42 0.0016 DK04 0.0013 SE23 0.001 NL42 0.0009 ES30 0.0008 DEA5 0.0007 FR23 0.0007 IE01 0.0007
RO21 0.0016 LV00 0.0012 UKJ1 0.001 EL41 0.0009 ITH3 0.0008 UKG2 0.0007 EL30 0.0007 UKE2 0.0007
NO07 0.0015 PL42 0.0012 CZ08 0.001 ES43 0.0009 EL13 0.0008 DE94 0.0007 DE93 0.0007 FR81 0.0007
BG33 0.0015 SK04 0.0012 DEA1 0.001 HU10 0.0008 AT22 0.0008 DE72 0.0007 NL13 0.0007 EL42 0.0007
BG34 0.0015 BG41 0.0012 CZ03 0.001 EL25 0.0008 DE73 0.0008 ES52 0.0007 UKK4 0.0007 FR30 0.0007
RO41 0.0015 LT00 0.0012 BE24 0.001 DE23 0.0008 ES42 0.0008 DEA3 0.0007 UKM6 0.0007 UKG1 0.0007
RO22 0.0015 HU21 0.0012 CZ02 0.001 NL21 0.0008 EL24 0.0008 UKE3 0.0007 UKC2 0.0007 UKD1 0.0007
DE21 0.0015 PL11 0.0012 CZ06 0.001 ITF3 0.0008 BE23 0.0008 UKE1 0.0007 UKF2 0.0007 AT11 0.0007
RO31 0.0015 DK03 0.0012 PT11 0.001 ITF6 0.0008 SK01 0.0008 ITF2 0.0007 DEF0 0.0007 ES53 0.0007
NL31 0.0015 SE33 0.0012 DE12 0.001 CZ01 0.0008 ITH4 0.0008 ES63 0.0007 ES41 0.0007 FR25 0.0007
RO11 0.0014 PL63 0.0012 AT31 0.001 ITH2 0.0008 ES64 0.0008 UKJ3 0.0007 BE34 0.0007 FR53 0.0007
DE71 0.0014 BE21 0.0012 ITC2 0.001 DE26 0.0008 FR94 0.0008 UKD4 0.0007 ES23 0.0007 BE35 0.0007
RO12 0.0014 HU22 0.0012 PT16 0.001 BE25 0.0008 ES22 0.0007 FI1D 0.0007 UKH3 0.0007 FR72 0.0007
HU31 0.0014 PL41 0.0012 ITC4 0.001 PT15 0.0008 DE30 0.0007 ES11 0.0007 FR21 0.0007 ITI2 0.0007
DE50 0.0014 DE11 0.0011 EL21 0.0009 ITG1 0.0008 DEC0 0.0007 ITC3 0.0007 ES24 0.0007 UKG3 0.0007
HU32 0.0014 ITH1 0.0011 RO32 0.0009 ITF4 0.0008 AT21 0.0007 UKM2 0.0007 NL23 0.0007 UKD3 0.0007
NL32 0.0014 SK03 0.0011 EL23 0.0009 DE27 0.0008 DEB3 0.0007 DEG0 0.0007 ES13 0.0007 UKE4 0.0007
PL32 0.0014 PL22 0.0011 NL34 0.0009 FR91 0.0008 ES62 0.0007 SI02 0.0007 UKJ4 0.0007 UKI2 0.0007
Code HDI Code HDI Code HDI Code HDI Code HDI Code HDI Code HDI Code HDI Code HDI
NO01 0.968 DK05 0.907 DE72 0.897 FR51 0.888 FR25 0.877 BE34 0.864 EL25 0.850 PL12 0.816 PL33 0.772
NO05 0.956 NL21 0.907 NL23 0.897 BE23 0.887 FR72 0.876 UKH1 0.863 UKE4 0.850 SK02 0.813 PL62 0.769
NO04 0.954 NL42 0.906 FR71 0.896 ITH4 0.887 DEE0 0.876 EL22 0.862 ITF3 0.849 RO32 0.810 BG41 0.769
NO06 0.946 DE25 0.906 ITC4 0.896 FR42 0.887 DE80 0.876 ITF4 0.861 UKD3 0.847 HU22 0.806 HU31 0.768
NO07 0.941 DE13 0.906 DE94 0.896 FR61 0.886 FR63 0.876 UKK2 0.860 UKF3 0.846 PT15 0.805 PL31 0.765
NO03 0.937 DE26 0.905 ES21 0.895 BE22 0.886 AT12 0.874 UKI2 0.860 EL12 0.846 SK03 0.802 RO42 0.758
NO02 0.931 NL22 0.905 AT32 0.895 ES24 0.886 EL30 0.873 UKF2 0.859 UKG2 0.846 PT30 0.798 RO12 0.754
IE02 0.930 ITH1 0.905 LU00 0.895 AT31 0.885 FR41 0.873 FR91 0.859 UKC2 0.846 HU21 0.796 RO11 0.746
DE60 0.929 DEA2 0.905 DE24 0.895 ITC1 0.884 FR92 0.873 UKE2 0.859 UKK3 0.846 PT18 0.794 RO31 0.742
SE11 0.928 SE21 0.905 ITH2 0.895 FI1C 0.883 ES11 0.873 ES61 0.858 UKE1 0.845 PT16 0.794 RO22 0.740
NL31 0.925 SE32 0.905 DEC0 0.894 DED2 0.883 ITF1 0.872 SI01 0.858 UKN0 0.844 PL51 0.794 RO41 0.738
NL11 0.925 DE27 0.904 CZ01 0.894 ITC3 0.883 EL42 0.871 EL24 0.858 CZ06 0.844 PT11 0.793 RO21 0.722
DE21 0.924 SE22 0.904 DEB1 0.894 DE93 0.882 ES42 0.871 UKG1 0.858 EL14 0.844 SK04 0.792 BG33 0.717
FR10 0.923 SE12 0.904 DEA3 0.893 ES41 0.881 ES12 0.870 EL43 0.858 EL23 0.843 PL41 0.792 BG34 0.715
NL32 0.923 DEA1 0.904 AT34 0.893 UKJ1 0.881 UKJ2 0.870 ES63 0.858 UKE3 0.842 PL63 0.790 BG42 0.714
DE71 0.922 NL12 0.903 DK02 0.893 FR83 0.881 ES52 0.870 ITF6 0.858 UKD4 0.842 PL22 0.789 BG32 0.705
DK01 0.922 IE01 0.903 ITC2 0.893 FR24 0.881 ES70 0.870 BE32 0.857 UKM3 0.842 LT00 0.786 BG31 0.697
BE10 0.919 DE73 0.902 DEB2 0.892 FR53s 0.880 ES64 0.870 EL13 0.857 FR93 0.840 LV00 0.786
DE11 0.918 DE23 0.901 DEA5 0.892 FI1D 0.880 UKK1 0.869 UKL2 0.856 UKC1 0.840 PL21 0.785
FI20 0.917 DEA4 0.901 AT33 0.892 DE40 0.880 FR22 0.869 ES43 0.856 CZ03 0.840 HR03 0.785
UKI1 0.915 BE21 0.901 AT13 0.892 ITI2 0.880 ITF2 0.869 UKK4 0.856 CZ02 0.839 PT20 0.782
NL41 0.915 SE31 0.901 BE25 0.891 FR26 0.880 BE33 0.868 UKM2 0.855 HU10 0.839 HU23 0.780
NL33 0.914 DE22 0.901 FR82 0.891 ES53 0.880 UKJ3 0.868 ITG1 0.855 CY00 0.838 HU33 0.779
DK04 0.913 DE92 0.900 ITH3 0.891 FR43 0.879 ITG2 0.868 UKH3 0.855 EL11 0.837 PL42 0.779
DE50 0.913 ES30 0.900 DEF0 0.891 DEG0 0.879 ES62 0.868 FR94 0.855 CZ05 0.837 PL52 0.778
DE12 0.912 DEB3 0.900 FI19 0.890 AT22 0.879 SK01 0.868 UKJ4 0.853 UKL1 0.835 PL43 0.777
NL34 0.911 BE24 0.900 ES23 0.889 FR23 0.878 FR30 0.867 UKF1 0.853 CZ07 0.833 HR04 0.777
DE14 0.911 ES22 0.899 FR62 0.889 ES13 0.878 UKH2 0.867 UKD1 0.853 CZ08 0.830 PL11 0.776
FI1B 0.909 DE91 0.899 SI02 0.888 FR21 0.878 BE35 0.867 EL21 0.852 MT00 0.829 PL61 0.775
SE33 0.909 BE31 0.899 ES51 0.888 FR81 0.878 UKM5 0.867 EL41 0.851 EE00 0.824 HU32 0.775
DK03 0.909 DE30 0.898 ITI4 0.888 FR52 0.878 AT11 0.866 UKG3 0.851 CZ04 0.823 PL34 0.774
SE23 0.909 NL13 0.898 ITI1 0.888 AT21 0.877 ITF5 0.864 UKM6 0.850 PT17 0.818 PL32 0.773
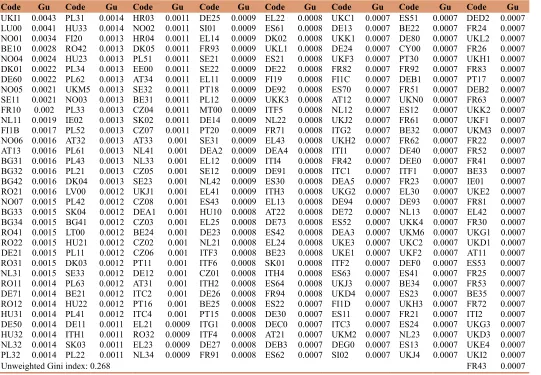
Table A4.4: HDI, unweighted Gini, weighted Gini ranks
Codew HDI Gw Gu Code HDI Gw Gu Code HDI Gw Gu Code HDI Gw Gu Code HDI Gw Gu
NO01 1 26 3 DE91 61 148 152 DEG0 121 106 203 UKK4 181 198 225 LT00 241 23 56
NO05 2 94 8 BE31 62 243 77 AT22 122 187 156 UKM2 182 130 202 LV00 242 47 52
NO04 3 103 5 DE30 63 59 166 FR23 123 144 221 ITG1 183 18 133 PL21 243 19 50 NO06 4 216 13 NL13 64 253 224 ES13 124 242 237 UKH3 184 150 233 HR03 244 97 69
NO07 5 211 19 DE72 65 205 190 FR21 125 188 234 FR94 185 218 164 PT20 245 260 114
NO03 6 152 43 NL23 66 257 236 FR81 126 83 257 UKJ4 186 156 238 HU23 246 143 39
NO02 7 240 70 FR71 67 14 148 FR52 127 68 252 UKF1 187 127 249 HU33 247 85 36
IE02 8 22 45 ITC4 68 3 98 AT21 128 241 168 UKD1 188 252 261 PL42 248 69 53
DE60 9 27 7 DE94 69 91 189 FR25 129 174 264 EL21 189 250 99 PL52 249 132 46 SE11 10 21 9 ES21 70 102 141 FR72 130 185 267 EL41 190 269 120 PL43 250 140 49 NL31 11 90 26 AT32 71 217 47 DEE0 131 101 219 UKG3 191 84 269 HR04 251 39 71 NL11 12 165 11 LU00 72 70 2 DE80 132 155 207 UKM6 192 255 226 PL11 252 43 58 DE21 13 5 24 DE24 73 200 174 FR63 133 231 247 EL25 193 230 123 PL61 253 52 48
FR10 14 1 10 ITH2 74 239 129 AT12 134 158 179 UKE4 194 120 271 HU32 254 71 32 NL32 15 34 33 DEC0 75 203 167 EL30 135 48 222 ITF3 195 11 126 PL34 255 110 40
DE71 16 8 28 CZ01 76 175 128 FR41 136 107 253 UKD3 196 86 270 PL32 256 46 34
DK01 17 33 6 DEB1 77 171 211 FR92 137 256 210 UKF3 197 229 175 PL33 257 100 44
BE10 18 44 4 DEA3 78 82 192 ES11 138 74 200 EL12 198 88 117 PL62 258 80 41 DE11 19 16 65 AT34 79 244 75 ITF1 139 177 220 UKG2 199 161 188 BG41 259 53 55
FI20 20 273 37 DK02 80 219 139 EL42 140 264 258 UKC2 200 173 227 HU31 260 99 30 UKI1 21 2 1 ITC2 81 270 96 ES42 141 105 158 UKK3 201 238 145 PL31 261 45 35 NL41 22 61 82 DEB2 82 249 246 ES12 142 201 214 UKE1 202 215 194 RO42 262 56 38 NL33 23 35 83 DEA5 83 58 187 UKJ2 143 78 181 UKN0 203 141 213 RO12 263 32 29
DK04 24 119 51 AT33 84 207 81 ES52 144 31 191 CZ06 204 98 92 RO11 264 25 27
DE50 25 193 31 AT13 85 51 14 ES70 145 112 178 EL14 205 214 105 RO31 265 12 25 DE12 26 55 94 BE25 86 182 131 ES64 146 271 163 EL23 206 208 101 RO22 266 20 23 NL34 27 251 102 FR82 87 36 176 UKK1 147 96 173 UKE3 207 176 193 RO41 267 38 22 DE14 28 116 113 ITH3 88 30 154 FR22 148 136 251 UKD4 208 167 198 RO21 268 6 18 FI1B 29 60 12 DEF0 89 79 229 ITF2 149 258 195 UKM3 209 114 250 BG33 269 122 20
SE33 30 224 60 FI19 90 170 143 BE33 150 206 254 FR93 210 261 106 BG34 270 95 21
DK03 31 128 59 ES23 91 262 232 UKJ3 151 137 197 UKC1 211 189 171 BG42 271 63 17 SE23 32 81 85 FR62 92 76 217 ITG2 152 145 182 CZ03 212 146 89 BG32 272 125 16
DK05 33 220 72 SI02 93 212 204 ES62 153 162 170 CZ02 213 142 91 BG31 273 126 15 NL21 34 181 125 ES51 94 10 205 SK01 154 234 161 HU10 214 57 122
NL42 35 179 119 ITI4 95 17 151 FR30 155 49 259 CY00 215 223 208
DE25 36 117 103 ITI1 96 54 184 UKH2 156 149 183 EL11 216 227 109
DE13 37 111 172 FR51 97 62 212 BE35 157 254 266 CZ05 217 108 84
DE26 38 169 130 BE23 98 166 160 UKM5 158 222 42 UKL1 218 115 140
NL22 39 121 147 ITH4 99 186 162 AT11 159 265 262 CZ07 219 133 80
ITH1 40 226 66 FR42 100 139 185 ITF5 160 233 146 CZ08 220 138 87
DEA2 41 29 116 FR61 101 66 215 BE34 161 267 231 MT00 221 246 112
SE21 42 209 107 BE22 102 225 206 UKH1 162 109 243 EE00 222 123 74
SE32 43 245 76 ES24 103 191 235 EL22 163 266 137 CZ04 223 147 78 DE27 44 129 135 AT31 104 134 95 ITF4 164 37 134 PT17 224 77 245 SE22 45 151 108 ITC1 105 42 186 UKK2 165 195 248 PL12 225 15 111 SE12 46 135 118 FI1C 106 196 177 UKI2 166 41 272 SK02 226 72 79
DEA1 47 9 88 DED2 107 160 239 UKF2 167 159 228 RO32 227 67 100
NL12 48 235 180 ITC3 108 163 201 FR91 168 247 136 HU22 228 157 63
IE01 49 197 255 DE93 109 154 223 UKE2 169 228 256 PT15 229 248 132 DE73 50 184 157 ES41 110 89 230 ES61 170 4 138 SK03 230 113 67 DE23 51 192 124 UKJ1 111 65 86 SI01 171 172 104 PT30 231 268 209 DEA4 52 118 150 FR83 112 263 244 EL24 172 237 159 HU21 232 131 57 BE21 53 73 62 FR24 113 92 240 UKG1 173 194 260 PT18 233 213 110
SE31 54 210 115 FR53s 114 153 265 EL43 174 232 149 PT16 234 64 97 DE22 55 183 142 FI1D 115 190 199 ES63 175 272 196 PL51 235 40 73 DE92 56 104 144 DE40 116 87 218 ITF6 176 93 127 PT11 236 28 93