Issues
ISSN: 2146-4138
available at http: www.econjournals.com
International Journal of Economics and Financial Issues, 2017, 7(3), 671-675.
Empirical Analysis of Operating Efficiency and Firm Value:
A Study of Fast Moving Consumer Goods and Pharmaceutical
Sector in India
Pritpal Singh Bhullar*
Department of Humanities and Management Studies, Giani Zail Singh Campus College of Engineering and Technology (Constituent College of Maharaja Ranjit Singh Punjab Technical University, Bathinda), Punjab, India. *Email: [email protected]
ABSTRACT
The present paper investigates the impact of operating efficiency on firm valuation for two economic sectors fast moving consumer goods (FMCG) and pharmaceutical sectors in India. The study considers 30 Indian firms from the period of 2005 to 2015. To examine the effect, six financial ratios are considered as proxy for operating efficiency and enterprise value (EV) as proxy for firm value. We employ panel data analysis to explore the relationship of dependent and independent variable. The results report that fixed asset turnover ratio (FATO) and net profit margin indicates negative relation with EV in pharmaceutical sector and EV/Sales and FATO confirms negative relation with EV for FMCG sector. The empirical results will act as guidelines for the valuation analysts for implication of new valuation variables by replacing conventional variables. Moreover, the study implies that value creation is more significant to current performance as compared to past performance.
Keywords: Operating Efficiency, Panel Data, Enterprise Value, Fast Moving Consumer Goods and Pharmaceutical Sector JEL Classifications: G32, M41
1. INTRODUCTION
In the present competitive business environment, market volatility level has been increased spontaneously across all the economic
sectors. The level of fragility in profitability has been stretched
due to shorten product life cycle; spontaneous changes in taste and preferences of consumers; uncertainty in sales and return on
capital employed (ROCE) etc., Due to the immense competition
for survival in companies, corporate restructuring (inorganic
growth) has been emerged as a popular expansion strategy among large and medium size business houses. The significance of valuation of firm can’t be surpassed under corporate restructuring as it establishes the value of the acquiring (target) firm. Valuation plays a crucial role at every stage of a firm’s life cycle (Aswath, 2011). Valuation of firm plays central stone during business operations like calculation acquisition price of firm, initial public offering (IPO), formulating different corporate restructuring
strategies etc.,
Valuation of firm is to estimate the future CRT in current value: a. What amount of cash flow firm can generate? (C - Cash flow) b. How much is the risk in the business of firm? (R - Risk in
business)
c. What is the minimum time period to achieve the desired target?
(T - Time period).
Evaluating the firm value and determine the various value drivers for both public and private sector firms are the crucial key stones in corporate restructuring strategy. Value of firm represents the past, present and future performance of firm as well as the long term
interest of investors (shareholders and stakeholders). Investors
invest their hard earned money with expectations of getting high
return at the end of the holding period of the asset (stocks, bonds,
derivates, saving accounts, fixed deposits and other investments
that add economic value to their investment. If the valuation of
the target firm is not determined correctly, it would prove a loss
prone acquisition deal for the acquirer. Decoding the true valuation
of the target firm has been remained a tough nut to crack for the financial analysts. It has been observed that the scope of operating efficiency in calculating valuation of firms has been increased in today’s business scenario. Operating efficiency of firms has been considered a significant factor while valuations as operating
activities and also considered as the core source of cash generation.
Operating efficiency refers to the profitable, efficient and judicious use of resources (financial) available to an organization in perfect consonance with clearly laid-down financial policies relating to
the operation. The main aim of the present study is to analyze the
effect of operating efficiency on the value of firm. Seetharaman and Johan (2011) pen down a strong positive correlation between
earnings per share (EPS) and the stock price of Public Bank in Malaysia. In the present paper, conventional measures like EPS and price-to-earnings has been avoided as while calculating the
total income of a firm from non-operating sources, the reality about operational efficiency of firm may be obscured, if not
hidden altogether.
Kirkwood and Nahm (2006) report that changes in firm efficiency are reflected in stock returns. Beccalli et al. (2006) also find that changes in efficiency are reflected in changes in stock prices and that the stocks of cost efficient banks tend to outperform their inefficient counterparts. Earlier, Chu and Lim (1998) had also
found that percentage changes in the prices of the bank shares
reflect percentage changes in profit. It has been analyzed that
still there is a huge gap to bridge between theory and practice.
A few researchers spent their time on analyzing the relationship between operational efficiency of firm and value of firm. Most of their research has been confined in banking sector.
2. REVIEW OF LITERATURE
A critical review has been made on the available studies that guide for developing new dimensions in firm valuation.
Positive correlation between EPS and the stock price exists in Public Bank Barhad, Malaysia (Seetharaman and Johan, 2011). The relationship between Bank efficiency change and stock price return has been examined during a study of 260 banks from countries from Asia and Latin America between 2000 and 2006.
The results support a positive and robust relationship between
profit efficiency changes and stock returns (Ioannidis et al., 2007). The empirical relationship between earnings and operating cash flows in equity valuation has been analyzed for a period of 1998-2000. Results reveal that earnings outperform operating cash flows in predicting future earnings (Subramanyam and Mohan, 2007). The evaluation has been performed between operational efficiency and firm performance from the year 1976 to year 2008. The findings of the study suggest that efficiency changes are positively related to future return and the firms which improve their efficiency show high profitability changes in current and future areas (Baik et al., 2010). An investigation has been done for a sample of over 7000 firms in 38 countries to investigate the relation between firm valuation and earnings quality. A positive
and significant relation between firm valuation and an aggregate
earnings quality measure was found that was based on seven earnings attributes (accruals quality, persistence, predictability, smoothness, value relevance, timeliness, and conservatism)
(Gaio and Rapason, 2011). The contribution of the Egyptian banks financial aspects to their operating efficiency has been
studied. The sample of 24 Egyptian commercial banks has been
analyzed for the period 2001-2008. The results show that in the highly competitive banks, the operating efficiency is positively and significantly affected by the asset quality, capital adequacy, credit risk and liquidity of banks (Hager et al., 2011). The study shows that non-performing assets, total income, total expenses and spread are the most significant factors influencing the operational profit. 21 Indian public sector banks have been studied a period of 5 years from 2006-2007 to 2010-2011. The results show that there is a significant relationship between profitability and six independent variables (Dhanapal and Ganeshan, 2012).
3. RESEARCH GAP
The above literature reviewed of past research studies brings out
the fact that the previous research studies have been confined to banking sector only and no such attempt has been made in context of other economic sectors to examine the impact of operating efficiency on firm value. In the current research study, the scope of research has been widened. An attempt has been made through this research work to analyze the effect of operating efficiency on firm value in pharmaceutical sector and fast moving consumer
goods (FMCG) sector. Moreover in the present research to keep the changing business scenario and interest of shareholders in mind,
an attempt has been made to use enterprise value (EV) as proxy of firm value as compared to stock price which has not been used as proxy of firm value in previous researches reviewed. The role of equity multiples in calculation of valuation of firms has been
gradually replaced by enterprise multiples.
4. RESEARCH METHODOLOGY
4.1. Research Objectives
Thepresent research is aimed to fulfill the following objectives that are very significant to know the impact of operating efficiency on valuation of firm.
a. To identify the effect of operating efficiency variables on firm valuation across industries under study (FMCG and
pharmaceutical industries).
• This research objective mainly focuses to identify
the effect of various variables represent the operating
efficiency of firm in terms of financial ratios that are expected to affect the valuation of firm. The above stated
objective has been achieved by performing panel data regression analysis.
b. To examine which operating efficiency variable can be
considered for increasing valuation of firm across the industries under study.
• To meet this objective, a study has been made to examine which variable has significant impact on valuation of firm
4.2. Research Hypothesis
• H01 - Operating efficiency variables have no significant effect
on EV across FMCG sector
• H02 - Operating efficiency variables have no significant effect
on EV across pharmaceutical sector
• H11 - Operating efficiency variables have significant effect on
EV across FMCG sector
• H12 - Operating efficiency variables have significant effect on
EV across pharmaceutical sector.
4.3. Selection of Companies
In the present research study, the FMCG sector and pharmaceutical sectors have been taken as these are considered as less recession
prone sectors (Urqhart, 1981). The 30 companies from two sectors
(pharmaceutical sector and FMCG sector) have been selected on the basis of the highest market cap in the sector. To avoid any anomalies, some major companies have been left deliberately from the study.
a. Only those companies have been considered whose financial
year ends on 31st March. Companies whose financial year ends either in June or in December have been ignored.
b. Only those companies have been selected in the sample which have complete financial record from 2005 to 2015 or which are listed before 2005.
The data of 30 companies under study has been collected mainly
from secondary data sources like annual reports. Capitaline
database has been used for downloading all the requisite financial historical data related to the companies from year 2005 to year 2015.
4.4. Research Variables
1. EV/earnings before interest, taxes, depreciation and amortization (EBITDA) - Aswath (2011) documents that EV/EBITDA multiple as a function of same variables that
determine the operating earnings multiples.
2. EV=Equity value+net debt+preferred stock+minority interest.
3. ROCE - ROCE represents the efficiency of company in terms of profitability of a firm expressing its operating profit as a
percentage of capital employed.
ROCE= Operating profit Capital employed
4. EV/Sales (EV/S) - It indicates the total value of firm to its sales. It represents the cost of buying a firm’s sales. This ratio is very useful during corporate restructuring of firm:
EV S =
Equity value+net debt+preferred stock+minority interestt Sales
5. Quality of income (cash flow from operating activities/net income) - Libby et al. (2011) documents that higher the quality of income ratio, higher is the firm’s ability to generate cash
from operating activities.
CFOA= Net cash flow from operating activities Sales
6. FATO - Libby et al. (2011) reports that FATO represents the firm’s operating efficiency in terms of converting fixed assets
into sales.
FATO = Net sales Total fixed assets
7. Net profit margin (NPM) - Libby et al. (2011) revealed that NPM is a good measure of operating efficiency as it shows the efficiency of company in converting its sales into profitability.
NPM= Profit after tax Sales ×100
Multiple regression has been used as a statistical technique to
measure the influence of independent variables on dependent variables. Panel data analysis has been applied by devising STATA software. All the statistical tests, in STATA softwares, have been
performed only after normalizing the data. The data has been normalized by taking natural logarithm after taking square of all
the values of ratios. Variance inflation factor (VIF) has been used
as a multi-collinearity diagnostic technique. VIF indicates whether independent variables have any correlation among themselves or
not. Residual normality test is performed to analyze the existence
of normality in residuals under regression. Hausman test has been
used to know whether fixed effect model (fe) or random effect
model (re) should be used for the data set under consideration.
The following ordinary least square model has been applied to
analyze the effect of operating efficiency variables (financial
ratios) on the dependent variable (EV).
EV =i X Yj
k k
k, i i
α +
∑
= + ∈1
Where,
EVi=EV of the ith entity and,
k=Six financial ratios (independent variable).
Table 1: Hausman test
Test statistics FMCG Pharmaceuticals
χ2 71.47 62.69
P>χ2 0.000 0.000
Source: Hausman test output in STATA. FMCG: Fast moving consumer goods
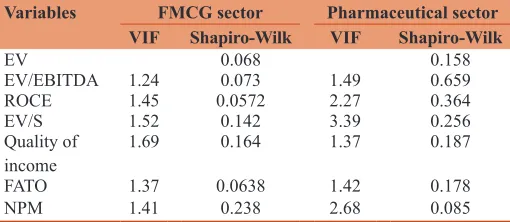
Table 2: Multi‑collinearity and residual normality
statistics
Variables FMCG sector Pharmaceutical sector
VIF Shapiro‑Wilk VIF Shapiro‑Wilk
EV 0.068 0.158
EV/EBITDA 1.24 0.073 1.49 0.659
ROCE 1.45 0.0572 2.27 0.364
EV/S 1.52 0.142 3.39 0.256
Quality of
income 1.69 0.164 1.37 0.187
FATO 1.37 0.0638 1.42 0.178
NPM 1.41 0.238 2.68 0.085
5. DATA ANALYSIS AND INTERPRETATION
5.1. Hausman Test
Hausman test has been performed to select the appropriate
regression model between fixed effect and random effect for execution of panel data analysis.
Table 1 documents the Hausman test statistics for FMCG and pharmaceutical sector. The results indicates the P value for both
sectors is lower than 0.05. The statistics presented in the above table supports the application of fixed effect regression model in the panel analysis as the P < 0.05 (Damodar et al., 2012).
5.2. Test of Multi Collinearity and Residual Normality Statistics
The following table shows the analysis of multi Collinearity and residual normality for the given data.
The results presented in the above Table 2 document the non
existence of multi-collinearity among all the independent variables
under FMCG and pharmaceutical sectors. The result indicates that
VIF values of all the research variables are lower than 10. This
further supports the elimination of the probability of biasness in
the final output. Residual normality for the variables has been analyzed by applying Shapiro-Wilk test in STATA. The output generated from Shapiro-Wilk test represents the higher than 0.05. This confirms the normal distribution of residual as well as
reliability of data for the regression.
5.3. Panel Data Regression Analysis
Level of effect of independent variables on the dependent variable
under the banking sector has been measured by the P > t values. The following table 3 shows the list of independent variables which has
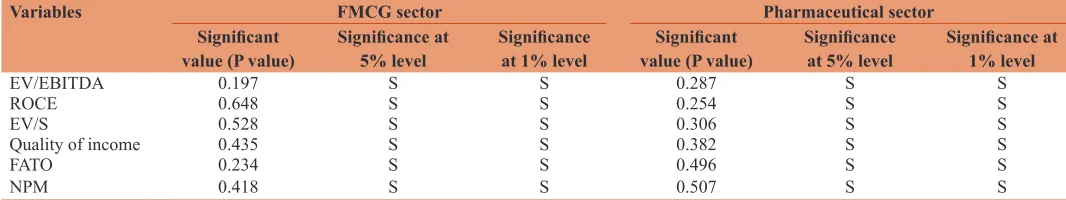
significant effect upon the EV as their values are higher than 0.05.
The statistics depict in the above table report that the significant value of all the independent variables i.e., EV/EBITDA, ROCE, EV/S, quality of income, FATO and NPM is higher than 0.05 at 5% and also higher than 0.01 at 1% level of significance for both
FMCG and Pharmaceutical sector. Consequently, the statistics
reject the null hypothesis of no significant effect of operating efficiency on value of firm at both 5% and at 1% significance level. The results confirms the significant effect of operating efficiency variables upon EV (firm value).
Within r2 depicts the effect of independent variable over dependent
variable within firms. The regression output support that for FMCG
sector overall r2 is 53.7% and for pharmaceutics it stands at 57.8%
that signifies an effective model (Table 4).
Table 5 reports the following regression equations for FMCG
sector and pharmaceutical sector on the basis of the above statistics.
5.3.1. Regression equation (FMCG sector)
EV = 5.238+0.538×EV/EBITDA+0.0176×ROCE–0.038×EV/ S−0.049×quality of income (cash flow from operating activities [CFOA]/net income)−0.385×FATO+0.372×NPM
It can be inferred from the above regression equation that negative
correlation exists between dependent variable EV and independent variables EV/S and FATO whereas other independent variables
document a positive correlation with EV.
As per coefficient values depicted in above Table 5 the following
regression equation has been formulated.
Table 3: Significance of relationship among study variables for FMCG sector and pharmaceutical sector
Variables FMCG sector Pharmaceutical sector
Significant
value (P value) Significance at 5% level Significance at 1% level value (P value)Significant Significance at 5% level Significance at 1% level
EV/EBITDA 0.197 S S 0.287 S S
ROCE 0.648 S S 0.254 S S
EV/S 0.528 S S 0.306 S S
Quality of income 0.435 S S 0.382 S S
FATO 0.234 S S 0.496 S S
NPM 0.418 S S 0.507 S S
Source: Regression analysis in STATA. S: Significant, EV/S: Enterprise value/Sales, ROCE: Return on capital employed, FATO: Fixed asset turnover ratio, NPM: Net profit margin, EBITDA: Earnings before interest, taxes, depreciation and amortization, FMCG: Fast moving consumer goods
Table 4: Regression statistics
Model statistics FMCG Pharmaceuticals
r2 within 0.759 0.795
r2 between 0.417 0.694
r2 overall 0.537 0.578
F value 41.13 33.36
P>F 0.000 0.000
FMCG: Fast moving consumer goods
Table 5: Regression statistics for FMCG sector and
pharmaceutical sector
Variables Coefficients
FMCG sector Pharmaceutical sector
EV/EBITDA 0.538 0.410
ROCE 0.0176 0.398
EV/S −0.038 0.341
Quality of income 0.049 0.024
FATO −0.385 −0.249
NPM 0.372 −0.028
Constant (α) 5.238 4.921
Source: Output of STATA. EV/S: Enterprise value/Sales, ROCE: Return on capital employed, FATO: Fixed asset turnover ratio, NPM: Net profit margin, EBITDA: Earnings before interest, taxes, depreciation and amortization, FMCG: Fast
5.3.2. Regression equation (pharmaceutical sector)
EV = 4.921−0.410×EV/EBITDA+0.398×ROCE+0.341×EV/ S + 0 . 0 2 4 × q u a l i t y o f i n c o m e ( C F O A / n e t income)−0.0249×FATO−0.028×NPM
On the basis of above regression equation, it can be noticed that two independent FATO and NPM are negative correlated with EV
whereas other variables are positive correlated with EV.
6. FINDINGS AND CONCLUSION
The impact of operating efficiency on firm value for FMCG sector and pharmaceutical sector has been examined in present research study. Operating efficiency has been gauged by six financial ratios whereas EV has been incorporated as proxy of firm value. Panel data analysis has been applied with fixed effect model. The analysis document the significant effect of independent variables on the EV. The statistics of FATO and NPM indicates negative
relation with EV in pharmaceutical sector whereas in FMCG
sector, similar scenario has been depicted by EV/S and FATO. The
present paper establish an important foundation for understanding
the significance of EV multiples over P/E multiples.
7. IMPLICATIONS OF STUDY
The results of present research work establish some thought
provoking grounds that will further signifies as guidelines for the future research work in the similar field. In the present fragile
business environment where companies left no stone unturned for right valuation, enterprise valuation multiples have cracked the
attention of corporate financial analysts and their role has been emerged as influential for the valuation. The significant influence of operating efficiency on other economic sectors (not only confined for banking sector) has been practically exemplified in
the present paper. The empirical results of present research study will prove very handful for corporate analysts and its statistical
findings must embark new dimensions in firm valuation during corporate restructuring, IPO and acquisition. The study emphasize
on the replacement of conventional valuation variables by current
business environment oriented new influencing variables for
valuation purposes.
REFERENCES
Aswath, D. (2011), The Little Book on Valuation. Hoboken, NJ: John Wiley & Sons.
Baik, B., Chae, J., Choi, S., Farber, D.B. (2010), Changes in operational efficiency and firm performance: A frontier analysis approach. Contemporary Accounting Research, 30, 996-1026.
Beccalli, E., Casu, B., Girardine, C. (2006), Efficiency and stock performance in European banking. Journal of Business Finance and Accounting, 33(1-2), 245-262.
Chu, S.F., Lim, G.H. (1998), Share performance and profit efficiency of banks in an oligopolistic market: Evidence from Singapore. Journal of Multinational Financial Management, 8, 155-168.
Damodar, G.N., Porter, D.C., Sangeeta, G. (2008), Panel data regression. Basic Econometrics. New York: McGraw Hill. p637-639.
Dhanapal, C., Ganesan, G. (2012), Measuring Operational Efficiency of Public Sector Banks in India. The 2012 International Conference on Business and Management. Vol. 1. p1-14.
Gaio, C., Raposo, C. (2011), Earnings quality and firm valuation-international evidence. Accounting and Finance, 51(2), 467-499. Hager, M.A., Wael, M., Tarek, E. (2011), Determinants of operating
efficiency for lowly and highly competitive banks in Egypt. Cambridge Business and Economics Conference, 1, 1-35.
Ioannidis, C., Philip, M., Fotios, P. (2008), The Relationship between Bank Efficiency and Stock Returns: Evidence from Asia and Latin America. University of Bath School of Management, Working Paper Series No. 10. p1-28.
Kirkwood, J., Nahm, D. (2006), Australian banking efficiency and its relation to stock returns. The Economic Record, 82, 253-267. Libby, R., Libby, P.A., Short, D.G. (2011), Financial Accounting. 6th ed.
Toronto, ON: Pearson Prentice Hall. p666.
Seetharaman, A., Johan, R.R. (2011), An empirical study on the impact of earnings per share on stock prices of a listed bank in Malaysia. The International Journal of Applied Economics and Finance, 5(2) 114-126.
Subramanyam, K.R., Mohan, V. (2007), Earnings, cash flows, and ex post intrinsic value of equity. The Accounting Review, 82(2), 457-481. Urqhart, M. (1981), The service industry: Is it recession proof. Monthly