Giorgio Demurtas1and Nick Gerardus Cornelis Janssen2 1DTU Wind Energy, Frederiksborvej 399, 4000 Roskilde, Denmark
2Romo Wind A/S, Olof Palmes Alle 47, 8200 Aarhus N, Denmark
Correspondence to:Giorgio Demurtas ([email protected])
Received: 12 April 2016 – Published in Wind Energ. Sci. Discuss.: 19 April 2016 Revised: 18 July 2016 – Accepted: 7 September 2016 – Published: 27 September 2016
Abstract. A spinner anemometer can be used to measure the yaw misalignment and flow inclination experi-enced by a wind turbine. Previous calibration methods used to calibrate a spinner anemometer for flow angle measurements were based on measurements of a spinner anemometer with default settings (arbitrary values, generallyk1,d =1 andk2,d=1) and a reference yaw misalignment signal measured with a yaw position sensor.
The yaw position sensor is normally present in wind turbines for control purposes; however, such a signal is not always available for a spinner anemometer calibration. Therefore, an additional yaw position sensor was installed prior to the spinner anemometer calibration. An innovative method to calibrate the spinner anemome-ter without a yaw positions sensor was then developed. It was noted that a non-calibrated spinner anemomeanemome-ter that overestimates (underestimates) the inflow angle will also overestimate (underestimate) the wind speed when there is a yaw misalignment. The new method leverages the non-linearity of the spinner anemometer algorithm to find the calibration factorFα by an optimization process that minimizes the dependency of the wind speed on
the yaw misalignment. The new calibration method was found to be rather robust, withFαvalues within±2.7 %
of the mean value for four successive tests at the same rotor position.
1 Introduction
The spinner anemometer (Pedersen et al., 2007) measures the horizontal wind speedUhor, yaw misalignmentγand flow
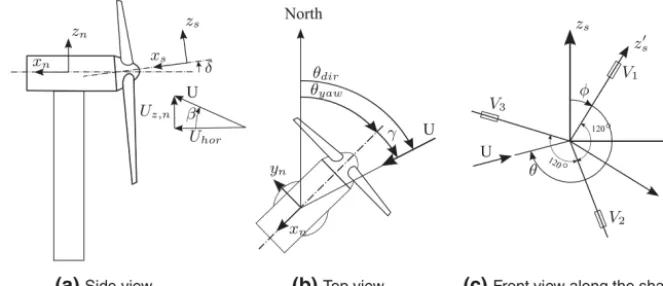
in-clinationβ experienced by a wind turbine by measuring the flow on the spinner by using three 1-D sonic sensors. The three 1-D sonic sensors are mounted on the spinner and con-nected to a so-called “conversion box”. Each sonic sensor arm also contains a 1-D accelerometer, the measurements of which are used in the conversion box to calculate the rotor position. The main purpose of the conversion box is to exe-cute the conversion algorithm that transforms the 1-D sonic sensor readings, which are in a rotating coordinate reference system (Fig. 1), to the fixed nacelle coordinate reference sys-tem as Uhor,γ andβ. The conversion algorithm takes into
consideration the wind turbine tilt angleδ, which is set in the conversion box as a constant. The shape of the spinner is ac-counted for by two calibration coefficients: k1andk2. The
first coefficient mainly relates to wind speed measurements,
while the ratio of the two coefficientskα=k2/k1mainly
re-lates to flow angle measurements. The relations between the wind speedU, flow angleαand azimuth position of the stag-nation pointθproducingV1,V2andV3measured by the three
1-D sonic sensors are
V1=U(k1cos(α)−k2sin(α) cos(θ))
=U·k1(cos(α)−kαsin(α) cos(θ)), (1)
V2=U
k1cos(α)−k2sin(α) cos
θ−2π
3
=U·k1
cos(α)−kαsin(α) cos
θ−2π
3
Figure 1.Coordinate systems and definition of angles: rotating spinner coordinate systemxs0 ,y0s andz0s; non-rotating shaft coordinate systemxs,ysandzs; fixed nacelle coordinate systemxn,ynandzn; yaw directionθyaw; yaw misalignmentγ; flow inclination angleβ; tilt
angleδ; azimuth position of flow stagnation point on spinnerθ(relative to sonic sensor 1) and rotor azimuth positionφ(position of sonic sensor 1 relative to vertical). From Demurtas et al. (2016).
V3=U
k1cos(α)−k2sin(α) cos
θ−4π
3
=U·k1
cos(α)−kαsin(α) cos
θ−4π
3
. (3)
The conversion algorithm (Eqs. 5 to 18) was derived from Eqs. (1) to (3). The values ofk1andk2constants are
gener-ally not know when the spinner anemometer is installed on a wind turbine for the first time; they are therefore set to an ar-bitrary value, generallyk1,d=1 andk2,d=1. The calibration
procedure will then provide the correction factorsF1andFα
to correct the default values to calibrated values (Eq. 4). The output values relative to a spinner anemometer which mea-sures with default calibration settings has the subscript “d” (Uhor,d,γd,βd).
k1=F1·k1,d k2=F2·k2,d=kα·k1=kα,d·Fα·k1 (4)
α=arctan k1 p
3(V1−Vave)2+(V2−V3)2
√
3k2Vave
!
(5)
Vave=
1
3(V1+V2+V3) (6)
U= Vave
k1cosα
(7)
V1< Vave: θ=arctan
(V2−V3)
√
3 (V1−Vave) V1≥Vave: θ=arctan
(V2−V3)
√
3 (V1−Vave)
+π (8)
Ux,s=Ucos(α) (9)
Uα=Usin(α) (10)
Uy,s= −Uαsin(φ+θ) (11)
Uz,s= −Uαcos(φ+θ) (12)
Ux=Ux,scos(δ)+Uz,ssin(δ) (13)
Uy=Uy,s (14)
Uz=Uz,scos(δ)−Ux,ssin(δ) (15) Uhor=
q U2
x+Uy2 (16)
γ=arctan
U
y Ux
(17)
β=arctan
U
z Uhor
(18)
Existing calibration methods for flow angle measurements
Two methods based on measurements to calibrate a spinner anemometer for flow angle measurements proposed in Peder-sen and Demurtas (2014) consist of yawing the wind turbine by±60◦ several times under manual control (as indicated by the turbine yaw position sensor, with respect to the mean wind direction). During this test, the output parameters of the spinner anemometer (Uhor,γ,β) are recorded at a high
sam-pling frequency (10 Hz). The analysis of the measurements provides the correction factorFα that, multiplied by the
de-faultkα,d, gives the correctkαcalibration value.
The methods are based on the assumption that the wind direction is constant during the test. Due to this require-ment, Pedersen and Demurtas (2014) recommended doing the test at wind speeds above 6 m s−1. Both methods need the yaw position to be measured in order to calculate the ref-erence yaw misalignmentγref, defined as the mean wind
di-rection minus the instantaneous yaw position during the test (see Pedersen and Demurtas (2014) for details). In the first method (abbreviated as GGref),Fα was calculated by
cali-brating the measurements iteratively, until the linear fit ofγ as a function ofγrefwas giving a line of slope equal to 1.
In the second method (abbreviated as TanTan), only one linear fitting was made to tan(γ) as a function of tan(γref). In
some scatter in the measurements which will reduce the re-peatability of the result. While in principle a single yawing movement is sufficient, in practice the wind speed fluctua-tions need to be averaged by yawing the wind turbine several times. The spinner anemometer is able to measure inflow an-gles (yaw misalignmentγ and flow inclinationβ) and wind speedU. A wrongkα value will result in a wrong value of
the angleγ, which will turn into a wrong value of the hori-zontal wind speed Uhor. In other words, a wrongkα makes
the wind speed measurement dependent on the yaw mis-alignment. This property of the spinner anemometer model (Eqs. 1–3) was verified with a data set consisting of con-stant wind speed Uhor and 13 values of yaw misalignment
going from−60 to 60◦in steps of 10◦. The tilt angle and the flow inclination were set to arbitrary values (equal to zero for Fig. 2). In the real world the tilt angle of the wind turbine is typically between 3 and 6◦, while the flow inclination varies within approximately±10◦. The conversion algorithm takes into consideration both the tilt angleδand the measured flow inclination βd when calculating the yaw misalignment γd;
therefore, they have no influence on the result of this method. V1,V2andV3were calculated with Eqs. (1)–(3) withkα=1
andk2=1.
Equations (5) to (18) (which are the direct conversion al-gorithm presented in Pedersen and Demurtas, 2014) were used with new values of kα equal to 0.5, 1 and 2, with the
calculatedV1,V2andV3to calculateUhor,d andαd.k1was
kept equal to 1.
When the conversion was made withkα=1,Uhor,dandαd
matched the (correct) initial values ofUhorandα(black line
in Fig. 2). On the other hand, when the conversion was made withkα,d=0.5, the wind speed and angle were overestimated
(blue curve in Fig. 2) becausekα,dis too small compared to
the correctkαvalue equal to 1 in this example. Similarly, with kα,d=2, the angles and the wind speed were underestimated
(red curve in Fig. 2).
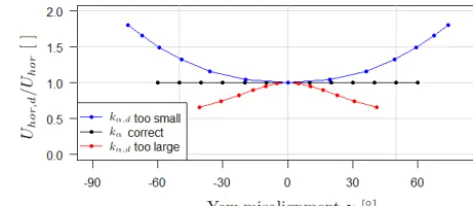
From the experience of calibration on several turbines, the default settings ofkα,d=1 is too small. Therefore, the wind
speed response looks like a happy smile, and anFα>1 is
re-quired to correct the default calibration value. Note that the wind speed is still measured correctly for a small inflow an-gle (where the three curves of Fig. 2 are close to each other).
(equal to 1 for our theoretical spinner model). Blue curve shows kαset to 0.5. To correct the blue curve to the black curve, the
cor-rection should be made withFα>1 (Fα=2 in this case). Red line
showskα set to twice the correct value; therefore, we needFα<1
to correct the measurements to the black line.
The method to optimize Fα consists of minimizing the
RMSE (root mean square error) of a horizontal linear fit made to the measurements ofUhor,dfor varyingFα.Uhoris
obtained applying theFαcalibration to the measurements of Uhor,d,γdandβdacquired with default valuesk1,dandk2,d.
For this reasonUhoris a function ofUhor,d,γd,βd,k1,d,k2,d
andFα.
The function object of the optimization is
RMSE=f Uhor,d, γd, βd, k1,d, k2,d, Fα
= v u u t 1 n n X 1
Uhor−Uhor 2
, (19)
where the first three variables come from the measurements, the fourth and fifth are the settings of the spinner anemometer at the time of acquisition of the measurements, and the last one (Fα) is the independent variable used in the
optimiza-tion. The function of Eq. (19) was optimized to its minimum using a combination of golden section search and successive parabolic interpolation (Brent, 1973).
3 Application of the method
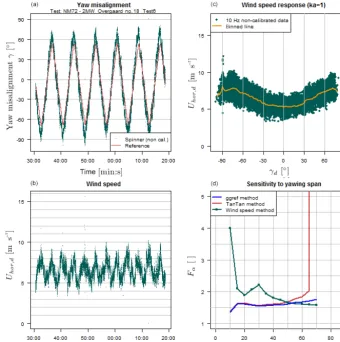
Figure 3.Before calibration, test 6.(a)Time series of yaw misalignment as measured by the spinner anemometer and by the yaw position sensor.(b) Wind speed time series as measured by the spinner anemometer beforeF1 calibration.(c)Wind speed as a function of yaw
misalignment measured by spinner anemometer.(d)Calibration correction factorFαcalculated in three different methods as a function of
yawing span ranging from±10 to±90◦in steps of±5◦.
Figure 3d shows the value ofFαcalculated with the three
different methods (GGref and TanTan from Pedersen and De-murtas (2014) and the present method, WSR), for varying ranges of yawing the wind turbine out of the wind (data were filtered according to γrefin steps of 5◦ span per side). The Fα value was calculated with the WSR method only if there
were at least 30 s of measurements in the outmost 5◦of the considered range (which justifies the fact that the scatter plot of Fig. 4c appears wider than the maximum range shown in Fig. 3d by the green line).
4 Discussion
As seen also in tests performed on other wind turbine mod-els, the GGref and TanTan methods tend to give a higherFα
for increasing yawing span than the WSR method. This is especially true for the TanTan method because of the tangent function properties, which tend to increase rapidly when ap-proaching a 90◦angle.
As seen in Fig. 3d, the value ofFα is dependent on the
chosen width of yawing the turbine in and out of the wind. For the TanTan and GGref methods, Pedersen and Demurtas (2014) suggested limiting the span to±45◦. The value ofFα
calculated with the WSR method tends to stabilize and be comparable with the previous two methods for a yawing span within 50 and 70◦.
Above a certain large inflow angle (depending on the spin-ner shape) the air flow would separate from the spinspin-ner sur-face with the consequence of the downwind sensor measur-ing in a separated flow region. In this condition the spinner anemometer cannot measure correctly, since the relation be-tween the sensor path velocities does not follow the spinner anemometer mathematical model (Eqs. 1 to 3).
The Fα value calculated for a yawing span of ±60◦
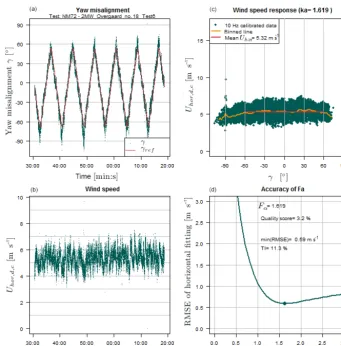
Figure 4.After calibration, test 6.(a)Time series of yaw misalignment as measured by the spinner anemometer and by the yaw position sensor.(b)Wind speed time series as measured by the spinner anemometer beforeF1calibration and afterFαcalibration.(c)Wind speed as
a function of yaw misalignment both measured by spinner anemometer and calibrated withFα.(d)Root mean square error of the horizontal
fit (red line in c) as a function ofFα.
RMSE varies as a function ofFα, and it also shows the
opti-mumFα as a dot at the minimum RMSE.
The method is based on the assumption of a constant wind speed. When applying the method to a spinner anemome-ter exposed to natural wind the wind speed will naturally vary in the time frame of about 1 h needed to complete the six yawing cycles (Fig. 3a). The wind speed variations are clearly visible in the wide scatter of Fig. 3c, which are av-eraged when calculating the RMSE (Eq. 19). The turbulence reduces the repeatability of the result (Fα) since it introduces
some randomness into the measurements. The result can be improved by a large number of tests or by using a stable wind source. The worst case is that the increase (and decrease) in wind speed is synchronized with the yaw position of the tur-bine, which is basically impossible when the turbine is yawed several times.
5 Sensitivity analysis
The calibration test was performed several times on the exact same turbine. The rotor was stopped with one blade point-ing downwards (the so-called bunny position), and the na-celle was yawed six times for each test: by ±90◦ (test 7 to 10) or±60◦ (test 1 to 6) by operating it manually from the turbine control panel. The yaw moves with a speed of about 0.5◦s−1; therefore, one test of six sweeps takes ap-proximately 1 h. Tests 7 to 10 were made on the same day, one after the other, for the exact same rotor position. The WSR method was used to calculateFα for each test and
sev-eral yawing spans (Fig. 6); this is also reported in Table 1 for the case of±60◦yawing span. Test 3 and 5 faced some data acquisition problems and were discarded.
Regarding the ability of the method to give reproducible results, the variation ofFαfor tests 7 to 10 is within±2.7 %
Table 1. Fα values for eight calibration tests made on the same
wind turbine. Tests 7 to 10 were made with exact same rotor posi-tion relative to a wind turbine yawing span of±60◦.
Test 1 2 4 6 7 8 9 10
Fαvalue 1.63 1.72 1.73 1.62 1.46 1.53 1.48 1.53
Figure 5.Root mean square error as a function ofFα. Markers
lo-cate the minimum value of RMSE and the correspondingFαvalue.
Bold coloured lines are tests performed for the exact same rotor po-sition.
variations is the wind turbulence. The eight results are within
±8.5 % of the mean value 1.59. It seems that theFα value
relative to the first four tests (about 1.67) is higher than the last four tests (1.50), which could be due to a different rotor position, which plays a role if the rotational symmetry of the spinner and sensor mounting positions is not accurate. The accuracy of the mounting position of the sonic sensors on this spinner was not investigated.
6 Goodness of a calibration and benchmark on 17 wind turbine models
The variations encountered in the estimation of Fα call for
the definition of a variable to judge the quality of the calibra-tion. One indicator could be related to the shape of the curves of Fig. 5. The flatter and shallower the minimum, the larger the uncertainty on Fα. The indicator was called the quality
score (QSC, see Eq. 20), calculated as the slope to the left of the minimum point.
QSC=RMSE (Fα−0.1)−RMSE (Fα)
0.1 (20)
Figure 7 shows QSC as a function of the span of yawing. What minimum quality score should a test have to give meaningfulFα? To answer this question, the wind speed
re-sponse method was applied to a database of yawing tests con-sisting of 29 calibration tests made on 17 turbine models. Re-sults are shown in Figs. 8 and 9.
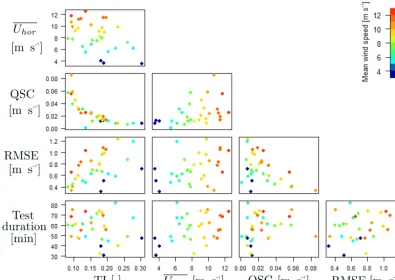
Figure 8 can help to identify which conditions of wind speed and turbulence lead to a more precise estimate ofFα,
which means a more steep RMSE(Fα) curve or, in other
Figure 6.Sensitivity of theFα to the yawing span. Bold coloured
lines are tests performed for the exact same rotor position. For test 2 the wind turbine was yawed by±60◦, but an initial offset of the tur-bine with respect to the wind direction and a wind direction change during the test determined measurements up to 80◦. The values in the legend show the mean wind speed during the test.
Figure 7.The quality score (QSC) is a measure of how much the RMSE as a function ofFα peaks at the minimum. A wide yawing
span gives a clearer peak. The values in the legend show the mean wind speed during the test.
words, a high QSC. Average wind speed and turbulence in-tensity were calculated from the measurements calibrated withFα for a range of yaw misalignments included in the
interval−30 to 30◦. This is to ensure that there is no flow separation from the spinner surface and therefore ensure the spinner anemometer model validity (the spinner anemome-ter model is expressed by Eqs. (1)–(3)). Figure 8 shows an inverse relation between the quality score and the turbu-lence intensity of the wind speed as measured by the spinner anemometer during the yawing test. Figure 8 shows that the QSC increases with the wind speedUhor.
Figure 8.Application of the method to a large database of wind turbines. Colour-coded according to the mean wind speed.
Figure 9.Fα calculated with three methods over a large database
of wind turbines. Colour-coded according to the mean wind speed.
increasing Uhor; however, the scatter of QSC also increases
and there are several points with a low QSC despite the high wind speed. This means that to achieve a high QSC, a low TI is more important than a high wind speed.
7 Comparison with previous methods
The Fα was calculated with the three methods GGref,
Tan-Tan, and WSR for a range of yawing (γref), i.e. ±45,±45
and±60◦, respectively. Figure 9 shows a comparison ofFα
values for 29 tests made on 17 wind turbine models. All the spinner anemometer were initially set with the same default calibration values (k1,d=1,k2,d=1); therefore, it is
possi-ble to compare theFα values directly. Most of the turbines
present anFαbetween 1 and 2, values which are attributable
to a pointed spinner shape (like a Vestas V52) or a rounded spinner (like a NEG Micon NM80). The four tests with an Fα between 2.5 and 3.5 belong to a flat spinner like the one
of a Siemens SWT-6.0-154.
The two methods which agrees the most are the GGref and the TanTan methods. This good agreement, however, does not imply that theFα estimate is accurate but rather that the
two methods are similar (in fact, they are both based on a linear fitting of the measurements, as described in the sec-tion “Existing calibrasec-tion methods for flow angle measure-ments”).
The value ofFα calculated with the WSR method shows a
lower level of agreement with the other two methods, being based on a completely different principle.
8 Conclusions
The robustness of the method was investigated by repeat-ing the calibration test on the same turbine several times, with the rotor locked in the exact same rotor position to avoid sen-sor mounting deviations playing a role. TheFα values found
for four tests for the exact same rotor position were within
±2.7 % of the mean value.
The quality score parameter (QSC) was introduced to quantify the goodness of the Fα estimate. The QSC was
found inversely dependent on the turbulence intensity. To have a precise estimate of Fα, it is therefore better to
per-form the test in low-turbulence wind conditions. The relation found between the QSC and the width of yawing suggests yawing the turbine further than by±60 and up to±80◦(these values might be different for other spinner shapes). Another issue to consider is that the test could start with an offset and end up being−90 to 70◦instead of−80 to 80◦. This is easily avoidable by yawing the wind turbine a bit further than the desired yawing span.
The sensitivity of the method to the width of yawing the turbine in and out of the wind was investigated by applying the calibration method to a subset of the original database. The subset was obtained filtering for γref∈[−s, s], where swas the span ranging from 10 to 90◦in steps of 5◦. Signifi-cant variations of theFαvalue were found for yawing spans
below approximately 60◦.
TheFα calculated with the wind speed response method
was compared with the Fα calculated with previous
meth-ods (GGref, TanTan) using 29 calibration tests performed by Romo Wind A/S on 17 wind turbine models. The sensitivity to the span of yawing showed that the WSR method tends to stabilize to the same values as GGref for a yawing span larger than approximately 50◦. Both the GGref and TanTan methods gave similar values of up to±40◦; then, the Tan-Tan method gave a higherFαand diverged from GGref for a
yawing span larger than 70◦.
A recommended yawing span to use to calculateFαseems
to be±60◦ for the WSR method and±40◦for the TanTan and GGref methods; however, the turbine should be yawed further than this angle (±90◦recommended) to compensate for initial offset error in the yaw position and wind speed direction change during the test.
It is best to perform the test at the lowest possible turbu-lence intensity, which might be found in stable atmospheric conditions (typically by night) at a flat site with low rough-ness.
It is recommended to verify the variation ofFαas a
func-tion of the span of yawing (using the calibrated yaw mis-alignment if the yaw sensor is not available), since substan-tially different spinner shapes might give a stableFα at
k2 Calibration constant (equal tokα·k1)
RMSE Root mean square error
QSC Quality score
GGref Gamma–gamma reference method α Inflow angle with respect to the shaft axis
δ Shaft tilt angle
β Flow inclination angle
γ Yaw misalignment
γref Reference yaw misalignment
φ Rotor position
Uhor Mean horizontal wind speed
θ Azimuth position of flow stagnation point on spinner (relative to sonic sensor 1) F1 Calibration correction factor mainly related to wind speed calibration
Fα Calibration correction factor mainly related to angle calibration F2 Calibration correction factor (Fα·F1)
TI Turbulence intensity
Acknowledgements. We thank Romo wind A/S for financing one third of the PhD project that this article is part of.
Edited by: H. Hangan
Reviewed by: three anonymous referees
References
Brent, R. P.: Algorithms for Minimization without Derivatives, Prentice-Hall, DTU Wind Energy, Roskilde, Denmark, 1973. Demurtas, G., Pedersen, T. F., and Zahle, F.: Calibration of a
spin-ner anemometer for wind speed measurements, Wind Espin-nergy, doi:10.1002/we.1965, in press, 2016.
Pedersen, T. F., Madsen, H., Møller, R., Courtney, M., Sørensen, N., Enevoldsen, P., and Egedal, P.: Spinner Anemometry – An Innovative Wind Measurement Concept, European Wind Energy Association (EWEA), 7–10 May 2007, Milan, Italy, 2007. Pedersen, T. F. and Demurtas, G.: Calibration of a spinner