__________
* Corresponding author
E-mail address:[email protected](Z.Nikraftar);[email protected](A.Sam Khaniani)
DOI: 10.22059/eoge.2018.257714.1022 45
Assessing the impact of cold and warm ENSO on drought over Iran
Zahir Nikraftar1, Ali Sam Khaniani2*
1 Department of Geomatics Engineering, Shahid Rajaee Teacher Training University, Tehran, Iran
2 Babol Noshirvani University of Technology, Civil Engineering Department, P.O. Box484, Shariati Ave, Babol, Mazandaran
47148-71167, Iran
Article history:
Received: 1 December 2017, Received in revised form: 5 April 2018, Accepted: 15 April 2018 ABSTRACT
The impacts of El Niño Southern Oscillation (ENSO) on climate change and in the global scale are well known, and have attracted the attention of researchers since the twentieth century. The study of ENSO impact on climate using precipitation and near surface temperature data from re-analysis products makes global and long-term analyses of this phenomenon possible. The common method to analyze the ENSO impact is to quantify the probability of extreme drought occurrences when the surface temperatures of central-east equatorial Pacific sea are abnormal. Although the results are always uncertain due to the complexity of atmospheric teleconnections, application of the recently available gridded datasets helps one to conduct more precise modeling and predictions. Spatiotemporal patterns of ENSO impact from 1980 to the end of 2013 for four ENSO indices (e.g. Nino 3.4, MEI, ONI, SOI) over Iran was investigated in this study. Spatial maps of the Pearson correlation coefficients and a composite analysis were obtained between the GPCC precipitation and temperature dataset with ENSO states. In addition, the frequency maps of extreme drought conditions during ENSO states were acquired. The results show that the western (along the range of Zagros Mountain) and northern (along the Alborz Mountain and the coastlines of the Caspian Sea to Khorasan Province) regions are more affected by ENSO events. The Pearson correlation coefficient for all four ENSO indices over the mentioned regions was determined to be about 0.70 for precipitation datasets and -0.70 for temperature datasets. The frequency analysis of extreme drought based and CZI (Chinese Z Index) and ENSO phases shows that the western and northeast parts of Iran are more affected by central-east equatorial Pacific teleconnections. Composite analysis for all four ENSO indices shows the precipitation (over the rainy months)/temperature (over the summer months) anomalies, for the El Niño states about +25 (mm)/ -0.5˚ (C) and for the La Niña states about -25 (mm)/+0.6˚ to 1˚ (C).
S
KEYWORDS
Southern Oscillation Index
Climate
GPCC Datasets
Chinese Z Index
Teleconnections
Composite Analysis
1. Introduction
Several mechanisms such as hydrological system and heat transfer between the ocean and atmosphere have a considerable impacton climate change of the Earth (Shimola & Krishnaveni, 2014). Earth's climate has experienced faster changes in the last century. Therefore, regional studies and analyses have become more essential (Agnew & Chappel, 1999).
Rainfall, as an important hydrologic climatic variable, has a key role in different fields and applications. The variability
of rainfall, both in space and time, makes it very necessary in water different disciplines such as agriculture, forestry, supply, reservoir management, tourism and many other activities (Agnew & Chappel, 1999; Sivakumar et al., 2000; Daşci et al., 2010). Considering the various socio-economic impacts of rainfall variability on countries as well as the damage caused by extreme precipitation events and droughts around the world, the attention of scientists to assess the rainfall variability has increased in recent years (New et al., 2001; Dore, 2005; Alexander et al., 2006).
64 Precipitation is a result of many complex atmospheric
processes. Interactions between the oceans and atmosphere can be connected to the rainfall amount and its variability. The El Niño Southern Oscillation (ENSO) is a well-known teleconnection pattern associated with the rainfall variability over different parts of the world (Kahaya & Dracup, 1993). This mode of climate variability has an effective role on the sever phenomena such as tropical cyclones and floods in different regions of the globe (Zebiak et al., 2015).
El Niño and La Niña are long episodes of sea surface temperature (SST) deviation appearing over the central and eastern tropical Pacific (Kang & Kug, 2002). These opposite phases are known as the ENSO cycle. Also, El Niño and La Niña are respectively referred to warm (abnormal SST) and cold (subnormal SST) phases of ENSO, which can have significant impacts on ocean process as well as global weather and climate (Brönnimann, 2007). In recent years, many studieshave shown the influence of ENSO on rainfall variability in different parts of the world (Allan & Pariwono 1990; Frederiksen & Balgovind, 1994; Wu & Zhang, 1996; Harison & Larkin, 1998; Wang et al., 2006; Ward et al., 2010; Li et al., 2011; Davey et al., 2014;). For example, using 50-year-observational data of water consumption, river water discharge and regional precipitation, Wang et al. (2006) illustrated the relationship between ENSO events, reducing water discharges and anthropogenic impacts in the drainage basin. Also, based on daily precipitation data of 743 stations in China, Li et al. (2011) examined the relationship between ENSO and the frequency of extreme precipitation events in China from 1951 to 2004. They stated that extreme rainfall events took place more often during the El Niño events in winters and springs. Using observational and re-analysis datasets for near surface temperature and rainfall with near-global coverage, the probability of the impact of ENSO on precipitation was analyzed by Davey et al. (2014). Another study by Jong et al. (2016) in California, which was conducted using the observational data for the period 1901– 2010, investigated the impacts of El Niño on winter precipitations. The results of their study suggest that the effect of El Niño on California precipitation intensifies from early to late winter.
Evaluation of ENSO impact on precipitation and drought patterns has a great economic and social value for improved management of water resources. Accordingly, in this study, the authors focus on the impact of ENSO events on Iran’s precipitation and drought from 1980 to 2015. The main objective of this work is to investigate the features of regional and seasonal dependence of Iran’s precipitation and near surface temperature variability to the ENSO cycles. For this purpose, the CZI index, which is related to rainfall, along with near surface temperature data were compared with four indices associated with El Niño and La Niña events over the country. These studies can be useful for climate monitoring as well as conservation, food security and water resources management. In section 2, we describe the employed data and methodology used to investigate the impact of ENSO events on rainfall variability. Spatiotemporal comparison of results between SST anomalies, near surface temperature and
1 Central Tropical Pacific SSTs.
2 Multivariate ENSO Index
CZI index in the entire country are given in section 3. The summary and conclusions are drawn in the final section. 2. Data and methodology
2.1 Precipitation and Temperature
The precipitation and temperature datasets used in this
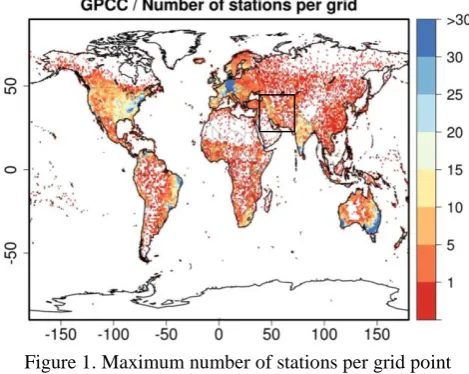
study is from the Global Precipitation Climatology Centre (GPCC) gridded monthly precipitation datasets at a resolution of 0.5° × 0.5° from 1980 to 2014. GPCC datasets were established in 1989 at Deutscher Wetterdienst (DWD, German Weather Service). The main task of this project was to analyze the monthly precipitation and temperature based on in situ measurements. The number of rain gauges utilized for this project estimated to range between 150,000 and 250,000 gauge stations (Schneider et.al, 2008). An indicative estimation of the global spatial coverage by meteorological stations is presented in figure 1 (Zittis, 2017).
Figure 1. Maximum number of stations per grid point considered for the compilation of the 1° version of the
GPCC gridded precipitation dataset 2.2 ENSO
El Niño and La Niña arerespectively defined as warm and
cool phases of climate pattern across the tropical Pacific, which are called “ENSO” for short. The pattern of ENSO can
show irregularity in atmospheric condition for every two to
seven years and affect the pattern of precipitation,
temperature and wind in global scale. This makes it possible
to predate these patterns. There are several indices that
characterize ENSO, which are calculated based on SST but
in different locations and time scales. In this study, four types of these indices named NINO 3.41, MEI2, ONI3 and SOI4
have been utilized to investigate the effect of ENSO on Iran’s climate. These indices are applied to monitor the tropical Pacific that are based on SST anomalies averaged across a specific region over a period of at least 30 years. Essentially,
the Niño 3.4 and ONI indices are the most commonly used
indices to define the El Niño and La Niña events and other indices are used to help characterize the unique nature of each event. In order to achieving more comprehensive
3Oceanic Niño Index
64
results, along with Niño 3.4 and ONI, also SOI and MEI indices were investigated in this study.
2.2.1 NINO 3.4
The Niño 3.4 anomalies represent the average equatorial SSTs across the Pacific from dateline to the South American
coast. This index used 5-month running the mean of SST
over the mentioned period. El Niño or La Niña were then
defined as when Niño 3.4 crossed +/- 0.4°C for about period
of six months and more (Trenberth, Kevin & National Center
for Atmospheric Research). 2.2.2 MEI
MEI was calculated based on six main variables over the tropical pacific. They were sea-level pressure, zonal and meridional components of the surface wind, sea surface temperature, surface air temperature, and the total cloudiness fraction of the sky and defined as the first un-rotated Principal Component (PC) of all six observed fields combined. El Niño or La Niña was defined as when MEI Crosses +/-1°C for about period of six months and more. 2.2.3 ONI
The NOAA's primary indicator for monitoring ocean
circulation and oscillation patterns is ONI, which was computed based on the measurement from the region as well as the Niño 3.4 region. This index used 3-month SST running means. Then El Niño or La Niña defined when ONI index crossed +/-0.5°C for about five consecutive months. 2.2.4 SOI
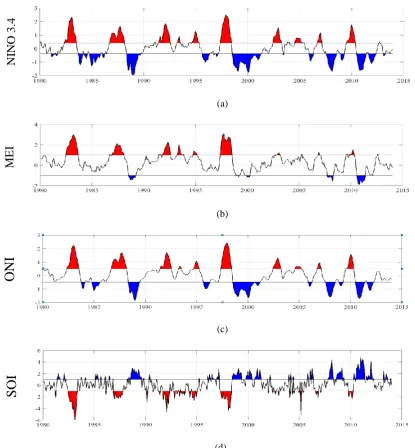
SOI is one of the key atmospheric indices for measuring the strength of El Niño and La Niña events and their potential impacts on the Australian region (Commonwealth of Australia 2018, Bureau of Meteorology). SOI measures the difference in surface air pressure between Tahiti and Darwin. Sustained positive normalized SOI values above about +1 indicate a La Niña event while sustained negative values below about –1 indicate an El Niño. Time series of these four indices from 1980 to 2014 along with their relative La Niña and El Niño events (ENSO cycle) are illustrated in Figure 2.
ENSO cycle is a scientific term that describes the temperature fluctuations between the ocean and atmosphere in the central east Equatorial Pacific (National Oceanic and Atmospheric Administration). In figure 2, the data was obtained from the Climate Prediction Center, NOAA/National Weather Service. The anomalies were calculated based on SST and SOI every three months relative to the corresponding three- month-values averaged over 1981–2010. The red and blue colors indicate the warm (El Niño) and cold (La Niña) phases of the ENSO cycle, respectively.
2.3 Methodology
In order to obtain the detailed information on the spatial and temporal pattern of ENSO over Iran, the following strategies were implemented; we calculated the Chinese Z index (CZI) and temperature anomaly from 1980 to the end of 2013 to survey the spatial and temporal pattern of drought
over Iran. Since ENSO indices are calculated based on the moving average with different time scales and illustrate the anomalies over oceans, we compared them with the precipitation and temperature anomaly indices, which were mentioned above. In the final step, the spatiotemporal relation between ENSO and the meteorological components (i.e. precipitation and temperature) were monitored and processed.
2.3.1 Chinese Z Index (CZI)
As an alternative to Standardized Precipitation Index (SPI), CZI was developed by the National Climate Center of China in 1995, which is related to Wilson–Hilferty cube-root transformation (Kendall & Stuart, 1977) assuming that the distribution of precipitation follows Pearson type Ш distribution (Salehnia et.al, 2017). The CZI can be calculated using the following equations:
1/3
C C
6 6
CZI ZScore 1
C 2 C 6
st st
t
st st
(1)
where Cst is the coefficient of skewness in the time step t. Time step can vary from month to season or year.
ZScore is a statistical parameter equal to the standard variation and can be calculated using the following equation:
where
x
j stands for precipitation in the month j.x
andσ
stand for the mean and standard deviation of long-term precipitation, respectively. The anomalies for the near surface temperature dataset can be calculated using the following equation. i i TT
T
TA
(4)where
TA
i is the temperature anomaly in monthi
,T
iis temperature in monthi
. The long-term average and standard deviation of temperature (34 years in this study) areT
andT
, respectively. In order to monitor the effect of ENSO in dry and wet seasons of Iran, the Pearson correlation coefficient between ENSO indices and CZI/TA were calculated in rainy seasons /summertime all over Iran. 2.3.2 Composite analysisMonitoring some of the basic structures and patterns of a the meteorological or climatological phenomenon, which occur over a given time is entirely, and in large-scale, very difficult. Composite analysis is often a suitable technique to deal with this obstacle. Besides, it has been known as a useful tool in exploring the impact of atmospheric teleconnections on climate. Composite analysis is a sampling technique based on conditional probability and for ENSO composite analysis over Iran, it is defined as a probability of occurring extreme wet and dry condition, during the El Niño and La Niña events (Boschat et.al, 2016). Then, the difference
3 1 3
(
)
n j j sx
x
C
n
(2) jx
x
ZScore
64 between the mean values of precipitation or temperature
during El Niño/ La Niña in rainy/summer months and the mean value of precipitation or temperature during rainy/summer months over the entire study period can be expressed as anomalies based on the following equations:
(P ) (P )
P MEAN Rainy Nino MEAN Rainy
(5)
(
)
(
)
T
MEAN T
summer NinaMEAN T
summer
(6)(a)
(b)
(c)
(d)
Figure 2. Three-month mean value, (a) sea surface temperature (SST) anomalies (◦C) averaged over the Niño 3.4 region, and (b) calculated based on six main variables over the tropical pacific including sea-level pressure, zonal
and meridional components of the surface wind, sea surface temperature, surface air temperature, and total cloudiness fraction of the sky, and (c) calculated based on the measurement from the region identical to the Niño
3.4 index region, and (d) the Southern Oscillation Index (SOI)
N
IN
O
3.4
ME
I
ONI
SO
64 (a)
(b)
Figure 3. Time series of four ENSO indices used in this study, compared to (a) CZI, and (b) temperature anomalies (TA) from 1980 to 2013. The red boxes show the El Niño events and the blue boxes show the La Niña events
where AP and AT stand for precipitation and temperature anomaly and first term in the right hand of equation stand for mean of precipitation/temperature during El Niño/ La Niña and second term stands for mean of precipitation/temperature in entire study period for rainy/summer months.
3. Implementation
From monthly GPCC
0.5
0.5
gridded datasets over Iran, the spatially and temporally averaged precipitation and temperature were calculated from 1980 to 2013. Then, the spatial and temporal patterns of precipitation and temperature were disused. Basically, Iran can be divided into 3 major climate areas, which are Arid (desert) and semi-arid climate (most of Iran), Mediterranean climate (the narrow strip alongside Caspian Sea, north of Iran) and Cold dry climate (in the mountainous areas). For the precipitation datasets, the Pearson correlation coefficient between four ENSO indices (during El Niño events) with their relative November-March mean precipitation was calculated. In addition, for the temperature datasets, the Pearson correlation coefficient between four ENSO indices (during La Niña events) with their relative June-August temperature was applied. In the next stage, the impact of cold and warm ENSO events on precipitation and temperature over Iran was monitored and obtained the numerical results based on the composite analysis.3. Results
3.1 Precipitation and Temperature pattern in Iran
Figure 3 plots the CZI index and temperature anomalies in the study period, which is derived from the GPCC datasets time series, along with ENSO indices. As it turns out from Figure 3.a, a strong coherence is evident between ENSO indices and CZI index for the entire period and particularly during the strong El Niño or La Niña episodes. The increase in rainfall and cloudiness, which is associated with the El Niño events, will reduce the temperature, particularly over northern and eastern Iran as Figure 3.b confirms. In contrast,
during the La Niña events, higher temperature and low precipitation is expected. For better understanding of the effect of ENSO on Iran, it is necessary to be familiar with Iran’s climate.
05 events with their relative June-August temperature. Figure 5
shows a high correlation (i.e. about 0.7) between El Niño-La Niña events (for NINO 3.4, MEI and ONI) and precipitation for wintertime in western Iran (along the Zagros mountain to the Urmia basin). Also, in the northern part along with a Caspian Sea and the northeast part (Khorasan), the correlation coefficient is high (i.e. 0.7). These correlations for SOI index are in opposite direction because of the nature of this index. Unlike other indices, the SOI index has opposite fluctuations so that the El Niño events are present when SOI is below -1 for some time. Moreover, the La Niña events are present when SOI index (unlike the other indices) has opposite fluctuations, such that the El Niño event is defines when SOI is below -1 for some time and the La Niña events are present when the SOI index exceeds +1 for a given period. As it turns out from Figures of the central part of Iran, the correlation coefficient is erratic and varies almost between 0.2 to 0.4. The correlation coefficient in the southern and southeast parts is close to zero. In the costal part of the southern regions, the correlation coefficient increases, which is probably due to its vicinity to the Persian Gulf. Therefore, there is a good agreement between all ENSO indices that makes them reliable sources for studying the oceanic teleconnections effects on the global and regional climate. As mentioned before, the effects of El Niño and La Niña events on temperature contradicts that of rainfall in Iran. This means that during the El Niño event, when precipitation and cloudiness increase, the temperature falls. On the other hand, for La Niña events, this behavior is in a reverse manner. As shown in Figure 6, in the western part (i.e. along with the Zagros mountain), northern part (i.e. along with Caspian Sea) and northeast part (i.e. Khorasan), the temperature is almost high but is negatively signed correlation coefficient with ENSO events amounting between -0.3 to -0.6. For the central and southern parts, these values range between -0.2 to 0. Essentially, the cold phase of ENSO leads to the higher frequency of rainfall in winters and cooler summers, whereas the warm phase of ENSO leads to lower frequency of rainfall and warmer summers. As it is clear from Figure 5.d, SOI have a strong positive correlation with temperature all over Iran except for some regions in central and southern parts where the correlation coefficient ranges almost between 0.1-0.4.
3.2 ENSO impact’s in frequency of extreme precipitation
Figure 7 shows the frequency of months with abnormal (and subnormal) precipitation during the El Niño (and La Niña) events for the entire study period. As it is clear from Figure 7, the months with abnormal precipitation range for El Niño phases have a higher frequency almost all over the country than the months with subnormal range during the La Niña phases. Particularly, the frequencies abnormal and subnormal precipitation in the western, eastern, northeast, and northern parts of Iran are high that means these parts are more affected by ENSO phases. In southern parts along the
Persian Gulf coasts, the effect of El Niño is observable, but for La Niña this is not valid.
3.3 Composite analysis results
One of the most common methods to visualize and quantify the ENSO effects is composite analysis. The basic concept in this method is that the average of precipitation and temperature during ENSO periods supposed to be a mean of ENSO impact. However, the critical assumption here is that all ENSO events have similar impacts and characteristics for any random fluctuation. The existence of two types of ENSO events (e.g. with different characteristic and impact) will makes the above assumptions invalid. It has been declared in many studies that there are two types of El Niño events; Eastern-Pacific (EP) El Niño (SOI) and Central-Pacific (CP) El Niño (NINO 3.4) (Ashok et al. 2007; Kao & Yu2009; Larkin & Harrison 2005; Yeh et al. 2009; Yu et al.2010). EP-El Niño is manifested by maximum sea surface temperature anomalies (SSTAs) located over the Niño 3 region (5N–5S, 150W–90W) based on Mo., (2010), El Niño event and it has a mean duration of 15 months. On the other hand, the CP-El Niño has warmer SSTAs in the Niño 4 region (5N–5S, 160E– 150W) and it has a shorter duration of about 8 months (Kug et al. 2009; Yu et al. 2010). In total, highlighting the common features between different ENSO indices using the composite analysis is quite appropriate. In the next section, the composite analysis is used to analyze the atmospheric response to the ENSO cold and warm phases. Furthermore, the composite analysis increases the statistical significance of the ENSO response signal. In addition, the composite analysis is applied to precipitation in wet months (i.e. from the previous November to late March) and to temperature in dry months (i.e. for June, July and August). The composite analysis applied in this study is the difference between the mean of precipitation (temperature) for all wet (and dry) months over the study period and the mean precipitation (temperature) of wet (and dry) months over the ENSO periods. In Figure 7, the El Niño (and La Niña) events for all ENSO indices are related to anomalously wetter (and dryer) winter-spring condition over the major parts of Iran. The ENSO warm and cold phases composite are substantially symmetrical all over the country, but with reversed sign of anomalies. This Figure illustrates rather strong signature of ENSO teleconnections over Iran for precipitation and temperature datasets. Because of different patterns and locations of convection over the tropical Pacific Ocean, EP and CP El-Niño’s induce different atmospheric response and regional impacts over Iran. Figure 7 shows the comparison of precipitation anomalies for all four ENSO indices (for El Niño and La Niña events separately) used in this study using 12 months moving-mean of GPCC precipitation data over Iran based on the composite analysis.
05 (a) (b)
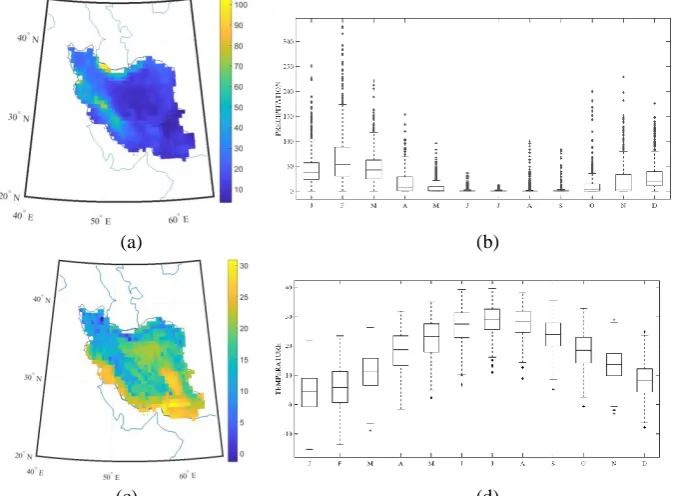
(c) (d)
Figure 4. Meteorological parameters, (a) long-term mean precipitation from 1980 to 2013, (b) box plot of monthly mean precipitation, (c) long-term mean temperature from 1980 to 2013, and (d) box plot of monthly mean temperature over Iran
(a) (b) (c) (d)
Figure 5. Pearson correlation coefficient between (a) Nino 3.4 events and wintertime precipitation, (b) MEI events and wintertime precipitation, (c) ONI events and wintertime precipitation, and (d) SOI events and wintertime precipitation
(a) (b) (c) (d)
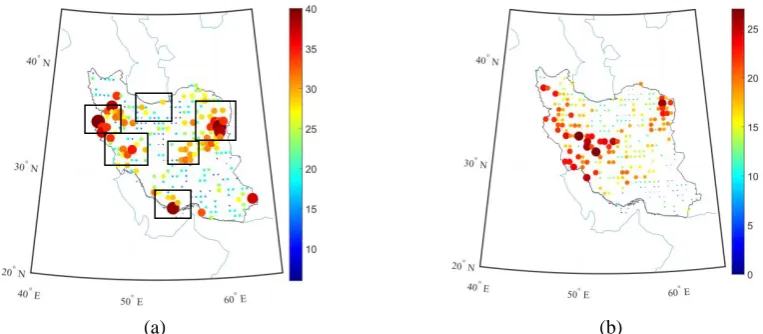
05 (a) (b)
Figure 7. Frequency of month with extreme precipitation condition during ENSO events based on Nino 3.4 from 1980 to end 2013. a) Number of abnormal months during the El Niño events, b) Number of subnormal
months during the La Niña events. Extremes defined based on CZI index
3.4 El Niño’s impact on precipitation
The result of these four ENSO types shows that there is a positive rainfall anomaly over the western and northern Iran during the El Niño years. However, there is some meaningful difference between the magnitudes of anomaly for these indices over the mentioned regions. The magnitude of anomalies over the Zagros Mountains, Kurdistan and Caspian Sea coastal regions are stronger. The magnitude of precipitation anomaly for NINO 3.4, MEI, SOI and ONI in these regions ranges between 15 to 20 mm per month. The density of the contour lines over these regions indicate the variability of anomaly that might be related to the movements of the air masses associated with the ENSO EL Nina’s event. In the central part, the anomalies are very limited, about 0 to 5 mm per month, and the density of contour line is low and seems to have a stable regime that is not affected by El Niño. Almost all four indices support this fact. In eastern and southern parts, Nino 3.4, MEI, and ONI show a very small anomaly similar to the central part; but SOI shows a relatively strong anomaly up to 15 mm per month. In the southeast part, a negative anomaly of about -5 mm per month is observed by Nino 3.4, MEI, and ONI; but, SOI shows a positive anomaly of about 5 mm. These differences between SOI and other indices could be related to the nature of this index that was previously discussed. The results for ENSO influence precipitation and temperature in seven regions over Iran (Black boxes in figure 7.a) are shown in Table 1.
3.5 La Niña’s impact on precipitation
In figure 8, all indices indicate that the western part of the country suffers from La Niña’s effect critically. From southwest to northwest of the country, the Figure shows a negative anomaly between -10 mm to almost -25 mm, which varies from one index to another. Nino 3.4 and SOI show more extreme conditions than others. For the northern part, Nino 3.4, MEI, and ONI show almost extreme negative anomalies of about -20 mm per month. SOI shows less negative values of about -5 mm in this region. In central and eastern parts, all four indices show very small anomalies
(about zero). Also, the southern part has negative anomalies of about -5 mm based on all indices.
3.6 El Niño’s impact on temperature
The pattern composites of Iran surficial temperature anomaly during June-August of 34 years between 1980 and 2013 for the cold and warm phases of ENSO are shown in Figure 8. The negative anomaly during the El Nino years, over the western and northern Iran, are statistically significant, which is almost confirmed by all four indices. The first three indices (i.e. Nino 3.4, MEI and ONI) show a negative anomaly from -0.15˚ up to -0.5˚C; except for SOI, which shows a small-anomaly for some regions along the Zagros Mountain, the negative and small anomaly close to zero is observed in the central and eastern parts. Again, SOI shows relatively positive anomalies over the same region in the central part, which indicates the nominal discrepancies between the SOI and other three indices associated with their nature. The results shown in Figure 9 are in general agreement with those of precipitation composite, in which the surface temperature has an inverse relationship with rainfall. In the southern part, all indices agree and show relatively positive anomalies during the El Niño periods. As it is clear from Figure 8, during the El Niño periods, the anomalies of this part are low and close to zero.
3.7 La Niña’s impact on temperature
05
Nino 3.4: El Niño MEI: El Niño ONI: El Niño
SOI: El Niño Nino 3.4: La Niña MEI: La Niña
ONI: La Niña SOI: La Niña
Figure 8. Composite precipitation anomalies (unit: mm per month) for the El Niño and La Niña events
Table 1. numerical results for ENSO influence precipitation and temperature over Iran (location of these regions is shown in Figure 7a
Wintertime Precipitation ( mm) Summertime Temperature (C˚)
EVENTS El Niño La Niña El Niño La Niña
Index Nino3.4 MEI ONI SOI Nino3.4 MEI ONI SOI Nino3.4 MEI ONI SOI Nino3.4 MEI ONI SOI Northern
Part
+7 +8 +6 +3 -8 -20 -8 -5 -0.15 -0.17 -0.15 -0.19 +0.25 +0.3 +0.2 +0.2
Kurdistan +13 +17 +10 +9 (*) -10 -12 -17 -13 -0.2 -0.25 -0.2 -0.14 +0.2 -0.1 +0.22 +0.2 Zagros
Mountain
+20 +16 +17 +20 -20 -10 -20 -23 -0.3 -0.35 -0.3 -0.1 +0.15 +0.35 +0.43 0
Southern Part
+5 +3 +6 +3 -5 -3 -6 -6 -0.2 -0.2 -0.24 -0.15 +0.1 +0.7 +0.1 +0.3
06
Nino 3.4: El Niño MEI: El Niño ONI: El Niño
SOI: El Niño Nino 3.4: La Niña MEI: La Niña
ONI: La Niña SOI: La Niña
Figure 9. Composite temperature anomalies (unit: C˚ per month) for the El Niño and La Niña events
over the southern slopes of the Alborz Mountains and the northwestern part of Iran where the Alborz and Zagros Ranges meet as well as over the Zagros Mountains. In contrast to these regions, the correlations were generally found to be weak and insignificant for southern and especially southeastern parts of the country.
4. Conclusion
Climate extremes of dry and wet conditions have been shown using the ENSO phases of 1980 to 2013 years indicating the precipitation and temperature anomaly patterns over Iran. The sea surface temperature and rainfall anomaly composites have a reverse sign over the El Niña and La Niña periods. These patterns are highly in agreement with the previous findings on the ENSO relationship to Iran’s climate (Nazemosadat & Cordery, 2000). In comparison with other parts of the country, the negative SOI–rainfall,
00 monthly maximum and minimum anomalies during the
summer time were
1
C
. Based on a three-month moving average composite analysis, more effective investigations can be conducted to find the difference between SOI and other indices, which was beyond the scope of this research. ReferencesAgnew, C.T. & Chappel, A. (1999). Drought in the Sahel, Geo J., 48, 299-311.
Allan, R.J. & Pariwono, J.I. (1990). Ocean-atmosphere interactions in low-latitude Australia. Int. J. Climatol., 10, 145–178.
Alexander, L. V., Zhang, X., Peterson, T. C., et al., (2006). Global observed changes in daily climate extremes of temperature and precipitation,” Journal of Geophysical Research Atmospheres, vol. 111, no. 5, Article ID D05109, pp. 1–22.
Ashok, K., Behera, S. K., Rao, S. A., Weng, H., & Yamagata, T. (2007). El Niño Modoki and its possible teleconnection. Journal of Geophysical Research: Oceans, 112(C11).
Boschat, G., Simmonds, I., Purich, A., Cowan, T., & Pezza, A. B. (2016). On the use of composite analyses to form physical hypotheses: An example from heat wave–SST associations. Scientific reports, 6, 29599.
Brönnimann, S. (2007). Impact of El Niño–Southern Oscillation on European climate. Rev. Geophys. 45, RG3003.
Davey, M.K., Brookshaw, A. & Ineson, S. (2014). The probability of the impact of ENSO on precipitation and near-surface temperature. Clim. Risk Manag. 1, 5–24. (doi:10.1016/j.crm.2013.12.002).
Dore, M. H. I. (2005). Climate change and changes in global precipitation patterns: what do we know? Environment International, vol. 31, no. 8, pp. 1167–1181
Frederiksen, C.S. & Balgovind, R.C. (1994). The influence of the Indian Ocean: Indonesian SST gradient on the Australian winter rainfall and circulation in an atmospheric GCM. Q. J. R. Meteorol. Soc., 120, 923– 952.
Harrison, D. E. & Larkin, N. K. (1998). Seasonal U.S. temperature and precipitation anomalies associated with El Niño: Historical results and comparison with 1997–98. Geophys. Res. Lett., 25(21), 3959–3962.
Kahya, E. & Dracup, J.A. (1993). US streamflow patterns in relation to the El Niho: Southern Oscillation. Water Resour. Res., 29, 2491–2503.
Kang, I.-S., & Kug, J.-S. (2002). El Nin˜o and La Nin˜ a sea surface temperature anomalies: Asymmetry characteristics associated with their wind stress anomalies. J. Geophys. Res., 107, 4372, doi:10.1029/2001JD000393.
Kao, H. Y., & Yu, J. Y. (2009). Contrasting eastern-Pacific and central-Pacific types of ENSO. Journal of Climate, 22(3), 615-632.
Kendall, M., & Stuart, A. (1977). The advanced theory of statistics. Vol. 1: Distribution theory. London: Griffin, 1977, 4th ed.
Kug, J. S., Sooraj, K. P., Kim, D., et al. (2009). Simulation of state-dependent high-frequency atmospheric variability associated with ENSO. Clim Dyn 32:635–48.
Kug, J. S., Jin, F. F., & An, S. I. (2009). Two types of El Niño events: cold tongue El Niño and warm pool El Niño. Journal of Climate, 22(6), 1499-1515.
Larkin, N. K., & Harrison, D. E. (2005). On the definition of El Niño and associated seasonal average US weather anomalies. Geophysical Research Letters, 32(13). Li, W., Zhai, P. & Cai, J. (2011). Researeh on the
Relationship of ENSO and the Frequeney of Extreme Precipitation Events in China. Advances in Climate Change Research 2, 101–107
Mo, K. C. (2010). Inter decadal modulation of the impact of ENSO on precipitation and temperature over the United States. J Climate 23: 3639–56.
Nazemosadat, M. J., & Cordery, I. (2000). On the relationships between ENSO and autumn rainfall in Iran. International Journal of Climatology, 20(1), 47-61. New, M., Todd, M., Hulme, M. & Jones, P. (2001).
Precipitation measurements and trends in the twentieth century. International Journal of Climatology, vol. 21, no. 15, pp. 1899–1922.
Salehnia, N., Alizadeh, A., Sanaeinejad, H., Bannayan, M., Zarrin, A., & Hoogenboom, G. (2017). Estimation of meteorological drought indices based on AgMERRA precipitation data and station-observed precipitation data. Journal of Arid Land, 9(6), 797-809.
Schneider, U., Fuchs, T., Meyer-Christoffer, A., & Rudolf, B. (2008). Global precipitation analysis products of the
GPCC. Global Precipitation Climatology Centre
(GPCC), DWD, Internet Publikation, 112.
Shimola, K. &Krishnaveni, M. (2014). A study on rainfall variability and its pattern in a semi-arid basin, Tamil Nadu, India, Disaster Advances.
Sivakumar, M., Gommes, R. & Baier, W. (2000). Agrometeorology and sustainable agriculture. Agric. Forest Meteorol, 103, 11–26.
Wu, G.-X. & Zhang, X.-H. (1996). Research in China on climate and its variability. Theor. Appl. Climatol., 55, 3– 17.
Yeh, S. W., Kug, J. S., Dewitte, B., Kwon, M. H., Kirtman, B. P., & Jin, F. F. (2009). El Niño in a changing climate. Nature, 461(7263), 511.
Yu, J., Kao, H, & Lee T (2010). Subtropics-related inter annual sea surfacetemperature variability in the central equatorial Pacific. J Climate23:2869–84.