DOI: 10.22075/JRCE.2017.1517.1142
Journal homepage: http://civiljournal.semnan.ac.ir/
Analysis of Flow Pattern with Low Reynolds Number
around Different Shapes of Bridge Piers, and
Determination of Hydrodynamic Forces, applying
Open Foam Software
H. Karami1, S. Farzin1*, M. Badeli2, and S.F. Mousavi3
1. Assistant Professor, Faculty of Civil Engineering, Semnan University, Semnan, Iran 2. Graduated MSc. student, Faculty of Civil Engineering, Semnan University, Semnan, Iran 3. Professor, Faculty of Civil Engineering, Semnan University, Semnan, Iran
* Corresponding author: [email protected]
ARTICLE INFO ABSTRACT
Article history: Received: 17 July 2016 Accepted: 24 May 2017
In many cases, a set of obstacles, such as bridge piers and abutments, are located in the river waterway. Bridge piers disrupt the river’s normal flow, and the created turbulence and disturbance causes diversion of flow lines and creates rotational flow. Geometric shape and position of the piers with respect to flow direction and also the number of piers and their spacing are effective in changing the river-flow conditions, such as the formation of vortices, their breakdown and hydrodynamic forces exerted on the piers. This article has been performed by applying the two-dimensional, open-source, OpenFOAM software. For this purpose, after selecting the grid size in GAMBIT software, different pier shapes were examined , considering different Reynolds numbers, and formation of the flow pattern, Strouhal number, vortex magnitude, and drag and lift coefficients for each pier shape were specified. Results for three different pier shapes indicated that in Reynolds number of 200, the highest drag coefficient (1.82) and maximum flow velocity (1.55 m/s) correlated to the square pier. The lowest drag coefficient (0.46) was calculated for the rectangular pier (having a semi-circular edge on one side and a sharp-nose edge on the other side) when the flow collides with the semi-circular edge. The least drag and lift forces are exerted to the rectangular pier, as compared to other pier shapes. The lowest lift coefficient (0.012) was obtained for a rectangular pier. On the other hand, the position of the sharp-nosed edge in the wake region caused the vortex shedding to occur at a greater distance from the pier.
Keywords:
Bridge Piers and Abutments, Flow Pattern,
1. Introduction
Study of the hydraulic structures is one of the essential fields for hydraulic researchers. Bridges are the most important river structures. Bridge piers act as a barrier against the river flow and contemplating their position in the flow path, affect hydraulic properties of the flow. Normal and regular river flow changes rapidly after a collision to bridge piers, leads to horizontal contraction and rotational flows will be created around the piers. By diversion of the flowlines and formation of the boundary layer, the high-pressure layer is observed in upstream of the piers and low-pressure areas arise in downstream of the piers. As a result of rotational flows, fluctuant forces are generated. Fluctuant forces created in the flow direction are called drag forces, and fluctuant forces created perpendicular to the flow direction are called lift forces. In the structural design of bridge piers, considering fluctuant forces are an important part of the design process. In terms of geometry, different shapes of bridge piers are effective in the imposed forces. Results of different investigations have revealed that pier shape is effective on flow separation. On the other hand, the created rotational flows and swirling vortices will be effective on bed scour.
Different researchers have examined drag and lift coefficients experimentally and numerically. Fredsoe and Hansen [1] studied the lift forces on fissured and non-fissured pipes. They have discussed the effect of shear force on lift coefficient and presented some formulas. Park et al. [2] applying a Navier-Stokes equations code, examined flow, base pressure, velocity distribution, Strouhal number, and drag and lift
coefficients around a circular cylinder. It was indicated that in Reynolds number (Re) of 160, drag and lift coefficients were 1.32 and 0.5, respectively. Saha et al. [3] examined three-dimensional characteristics of transient flow around a square cylinder and the formation and breakdown of vortices in the Re number of 150 to 500. Results revealed that transition flow occurs between the Re number of 150 to 175. In Re number of 175, instability was observed as shifting vortices in the flow with low frequency. Shifting of the vortices was attributed to their coalescence or phase change in their structural consistency. Zhao et al. [4] have surveyed the numerical simulation of viscous flow around two cylinders with different diameters. This study inspected the impact of spacing between the two cylinders and angle of repose of the small cylinder on drag and lift coefficients, pressure distribution, and flow properties. The amount and frequency of pulsating forces were compared in the two cylinders with an equivalent-diameter cylinder. Zhang and Gay [5] applied immersed finite-element method (IFEM) in analyzing the drag coefficient of a circular cylinder for Re number of 20 to 200. They found that the drag coefficient in Re number of 200 was equal to 1.55.
for a circular cylinder. Results revealed that at Re number of 200, the Strouhal number, drag coefficient, and lift coefficient were 0.18, 1.22, and 0.67, respectively. Gera et al. [8] did numerical modeling of two-dimensional flow around a square cylinder at Re number of 50 to 250. In this study, the finite volume method and the SIMPLE algorithm were utilized. Results displayed that the formation of the vortices started at Re number of 50. Omid Naeini and Fazli [9] used FLUENT software to simulate two-dimensional flow and the impact of pier shape on flow pattern flow forming, vortex magnitude and vortex breakdown parameters (including drag and lift coefficients) at Re number of 2×10⁵. For verification of the numerical results, an experimental model was applied. Results exhibited that rectangular pier with a round edge and a sharp-nose edge, if it is placed against the flow, has the best performance and exerts the least forces on the piers. Bai and Li [10], by using FLUENT software, numerically investigated flow around a circular cylinder at low Re numbers. Results indicated that by applying a dike behind the cylinder, at the Re number of 200, the drag coefficient reduces from 1.33 to 1.01 and lift coefficient reduces from 0.65 to 0.1. Keramati Farhoud et al. [11] by using FLUENT software, investigated drag and lift coefficients, at Re number of 720, on a circular cylinder. According to the results, the drag coefficient was equal to 1.356, and the lift coefficient was equal to 0.51. Vikram et al. [12] analyzed numerically two-dimensional flow past circular and square cylinders for Re numbers of 100 and 200 by using FLUENT software. Results indicated that pressure in the upstream face of the circular cylinder was more than the front end face of the square cylinder, but
downstream of the square cylinder has less pressure compared to a circular cylinder. The lift coefficient of the square cylinder was less than the circular cylinder.
By scrutinizing the previous researches, it can be observed that numerous numerical models and experimental activities have been applied in calculating drag and lift coefficients, at different Re numbers, on the square and circular cylinders. Moreover, the effect of the cross-sectional shape of the cylinder on the incoming forces has been dealt-with in some researches. In the present research, numerical modeling of different shapes of bridge piers and their effects on hydrodynamic forces was achieved using open-source OpenFOAM software.
2. Materials and Methods
2.1. Numerical Model
OpenFOAM software [13] is based on the finite volume method for reticulation of the solution domain. In the numerical model of this study, and as a result of the laminar and incompressible fluid flow conditions in this research, the IcoFoam solver was applied. This solver is usually utilized for two and three-dimensional flow problems. Two standard algorithms in the finite volume numerical method are PISO and SIMPLE, which are used to solve the Navier-Stokes coupled and nonlinear equations. PISO algorithm is an effective method to solve the Navier-Stokes equations in unsteady flow problems. The SIMPLE algorithm is used more for solving steady flows. The IcoFoam solver, based on the PISO algorithm, analyze flow velocity, and pressure in the numerical model.
equations. The continuity equation is as follows:
.( )U 0 (1)
where indicates velocity and is divergence operator.
The nonlinear momentum equation is expressed as:
.( . ) .( )
U
U U U p
t
(2)
where p is unit pressure, t is time, ν is kinematic viscosity and indicates density. In incompressible fluid flow, the continuity equation is only a mathematical constraint for flow solution and expresses that if a proper pressure field is applied for solving the momentum equation, the obtained velocity field is free from divergence. While the acquired velocity field from the primary pressure field does not necessarily satisfy the continuity equation, in order to solve the Navier-Stokes equations, an equation is required to correct the pressure.
One of the methods for writing an equation for pressure is combining momentum and continuity equations that arise from the divergence of momentum equation. For this purpose, it is necessary to approximate linearly the non-linear equation of momentum. This approximation is presented in Eq. (3):
.( . ) .( )
U
U U p
t
(3) where, is surface flux.
Finally, the divergence of the semi-discrete momentum equation, contemplating the continuity equation, will lead to the following equation, that is the general case of Poisson pressure equation:
1 ( )
.( ) .( )
p p
H U
p (4)
where, p is the velocity coefficient in the cell center and H(U) consists of discrete-time sentences. In consonance with the mentioned discussions, the PISO algorithm is based on solving the discretized Navier-Stokes equations and conducting a series of operations to eliminate the effects of linearization [14].
Drag and lift forces exerted to cross-sections are specified with drag and lift coefficients, and these coefficients are a function of Re number. The Re number is defined as:
Re UD (5)
where D is diameter, U is flow velocity, ρ is fluid density and is fluid dynamic viscosity. Drag coefficient (CD) and lift coefficient (CL) are computed from Eqs. (6) and (7), respectively: 2 1 2 D D F C DU (6) 2 1 2 L L F C DU (7)
where, FD and FL are drag force and lift force, respectively.
2.2. Boundary Conditions
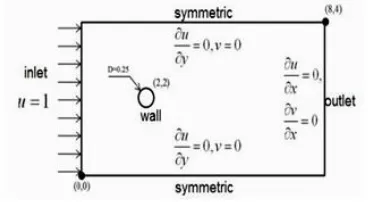
was contemplated in determining the boundary conditions for bridge pier.
The effect of the cross-sectional shape of the pier on hydrodynamic forces exerted on them was investigated. Drag and lift coefficients, Strouhal number and vortex shedding at two Re numbers of 40 and 200 were inspected, as well. First, validation of the software was performed with modeling of circular bridge pier, and then the modeling process was continued for square and rectangular (a semi-circular edge on one side and a sharp-nose edge on the other side) cross-sections.
Fig. 1. Computational domain and boundary conditions
2.3. Grid Generation
Type of grid network and its density affect the accuracy of analysis and optimization of computational time. A very small network requires much computational time and may have a negative effect on the convergence of results. Applying a coarse grid is not necessarily appropriate because it may create an error in the results of boundary layers. Grid generation was accomplished in GAMBIT software, and among different patterns, square grids with map pattern had the best compatibility and quality. After some preliminary grid generation, for the first layer around bridge piers, 1 cm grids size and for the rest of the solution domain, 5 cm grid size was selected. The mesh
pattern for a circular cross-section is depicted in Figures 2 and 3.
Fig. 2. Gridding in the entire domain
Fig. 3. Gridding in the vicinity of the pier 2.4. Error Criteria
For choosing the best numerical model, the modeling process was achieved by two solvers of PisoFoam and IcoFoam. The results of these solvers were compared by a comparison of statistical criteria. These criteria include mean absolute error (MAE), root mean square error (RMSE) and determination coefficient (R2), which are given in equations (8), (9) and (10):
1 1 N
i
MAE M C
N
(8)
2
1
N
i
M C RMSE
N
2
2 1
2 2 1 1
1
N
i
N N
i i
M C
R
C M
N
(10)
In these equations, C and M are calculated and measured values, respectively, and N indicates the number of modeling tries. As R2 gets closer to 1.0 and RMSE and MAE get closer to zero, it means that numerical modeling results have better accordance with the experimental data.
3. Results and Discussion
3.1. Verification of the Numerical Model
Considering the scrutinized range of Re number (40 to 200), the results of numerical modeling are validated by comparison with the experimental data presented by other
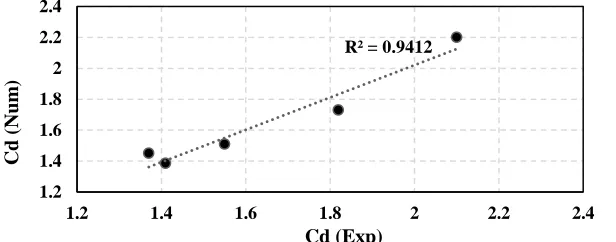
studies. Results of numerical modeling of drag coefficient are compared with those of Zhang and Gay [5] in Figure 4. This figure displays that experimental and numerical drag coefficients are very close to each other, which validates the numerical model. Results of the error criteria for the two solvers (IcoFoam and PisoFoam) are presented in Table 1. According to this table, for IcoFoam solver, R2=0.94 and RMSE=0.07, and for PisFoam solver, R2=0.91 and RMSE=0.072. The MAE values for these solvers are 0.066 and 0.063, respectively. Consequently, it could be concluded that based on these criteria, the IcoFoam solver has less error in calculations, and it was selected as the better solver for future applies in this research. This solver is usually appropriate for laminar flows. The experimental and numerical drag coefficients acquired from using the IcoFoam solver are compared in Fig. 5.
Fig. 4. Comparison of drag coefficient in this study and Zhang and Gay [5].
Table 1. Error criteria for validation of different solvers.
Solver R2 RMSE MAE
IcoFoam 0.94 0.07 0.066
PisoFoam 0.91 0.072 0.063
0 0.5 1 1.5 2 2.5
0 50 100 150 200 250
Cd
Re
Fig. 5. Comparison of experimental and numerical drag coefficient in IcoFoam solver. 3.2. Analysis of Simulation Results
Based on the flow examination in low Re numbers, simulations were performed for two Re numbers of 40 and 200. Pursuant to Fig. 6, the reason for choosing these two Re numbers is the status of vortices formation and breakdown. As mentioned earlier, modeling and analysis were performed by IcoFoam solver.
The modeling time was 100 seconds. Three cross-sections of circular, square and
rectangular (the last one with one edge having semi-circular section and the other side having sharp-nose) investigated. The length of the square cross-section was 0.25 m. In the rectangular cross-section, the diameter of semi-circle was 0.25 m, the length of the rectangle was 0.5 m, and the angle of the sharp nose was 30o. Drag and lift coefficients and Strouhal number were computed for each cross-section.
Fig. 6. Formation and breakdown of vortices (cylindrical cross-section) [15]
3.2.1. Drag and Lift Coefficients for Circular-Base Pier
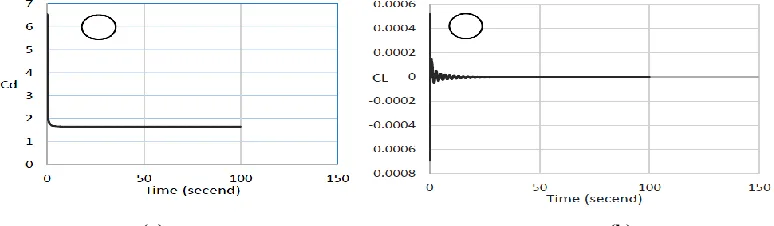
Simulation of flow around a circular-base pier was performed for two Re numbers of 40 and 200 and the corresponding drag and lift coefficients were determined. The obtained results in Figures 7 and 8 reveals that at Re number of 40, as time passes, the drag coefficient gets close to a constant value of 1.64 and lift coefficient becomes zero. At Re number of 200, drag coefficient
gets close to 1.5 and lift coefficient oscillates between +0.85 and -0.85.
Two very important effects of fluid flow are the effects of inertia and viscosity. The relationship between these two effects indicates the type of flow. This relationship is expressed by the Re number. When the Re number is large, inertia effects dominate, and when it is small, the effect of viscosity is stronger. In the case of the circular cross-section of the pier, it is observed that when Re number increases from 40 to 200,
R² = 0.9412
1.2 1.4 1.6 1.8 2 2.2 2.4
1.2 1.4 1.6 1.8 2 2.2 2.4
Cd (
Num
)
consequently the effect of inertia dominates, compared to viscosity, which causes the growth of lift coefficient and reduction of the drag coefficient. As a result of the
fluctuating nature of drag and lift forces and the acquired coefficients, it is concluded that a large force is exerted to this cross-section.
(a) (b)
Fig. 7. a) Lift coefficient and b) Drag coefficient for the circular-base pier (Re=40)
(b) (a)
Fig. 8. a) Lift coefficient and b) Drag coefficient for the circular-base pier (Re=200) 3.2.2. Square-Base Pier
According to Figures 9 and 10, in the study of flow around a square-base pier, and the Re number of 40, the drag coefficient was obtained as 2.06 and lift coefficient was zero. Drag coefficient at Re number of 200 was calculated as 1.82, and the lift coefficient was +0.68 to -0.68.
Inspecting flow properties around square sections are issues correlated to the fluid flow around objects with sharp edges. These sections are part of the bluff bodies. When these objects are located in the flow path, the flow around them separates from the solid faces, the Re number increases, and vortices begin to form in front surfaces in
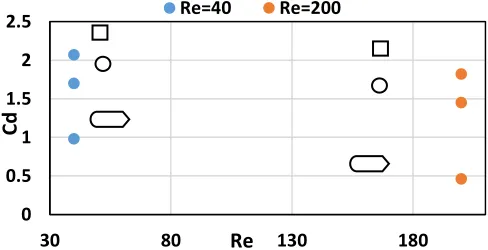
the downstream. High drag and lift coefficients are the results of these wakes and vortices around the square-base piers. Figure 13 illustrates a comparison of drag coefficient for different pier cross-sections. In both Re numbers of 40 and 200, the highest drag coefficient (2.06 and 1.82) was calculated for square-base pier; Subsequently, circular-base with values of 1.64 and 1.5 ranked next; and the lowest drag coefficient (0.97 and 0.46) was acquired for rectangular-base pier with a semi-circular edge on one side and sharp-nose edge on the opposite side.
coefficients reduce more. Confirming to Figure 12, the sharp-nose edge caused more reduction of drag coefficient in the rectangular cross-section. Meanwhile, it can be concluded that by increasing the Re number, the drag coefficient reduces more.
Comparison of the lift coefficients in Figures 10, 11, and 12 confirms that the rectangular-base pier has the least lift coefficient with respect to piers having a square or circular cross-sections.
(a) (b)
Fig. 11. a) Lift coefficient and b) Drag coefficient for rectangular pier shape (Re = 40)
(b) (a)
Fig. 12. a) Lift coefficient and b) Drag coefficient for rectangular pier shape (Re = 200)
Fig. 13. Evaluation of the drag coefficient for different pier shapes at Re=40 and Re=200 3.3. Analysis of Strouhal Number
Strouhal number is a dimensionless number which is applied in fluid dynamics to
describe the fluctuations of fluid flow [16 and 17]. Normalized frequency of vortex shedding is defined by Strouhal number (Eq. 11):
0 0.5 1 1.5 2 2.5
30 80 130 180
Cd
Re
. fv L St
U
(11) where fv is the frequency of vortex shedding, L is the characteristic length, and U is flow velocity. Variation of Strouhal number with Re number for different flow regimes is depicted in [16] and [17].
The obtained Strouhal number for circular cross-section pier revealed that there is a suitable match between numerical and experimental Strouhal numbers. Comparison of Strouhal numbers of the three pier cross-sections indicates that circular section has higher Strouhal number than the other two
cross-sections. According to the drag and lift coefficients, the value of Strouhal number and how the flow separates from the pier base, it could be concluded that severity of vortex breakdown in square and circular sections is higher than the other cross-section and this causes immense fluctuation force to be applied to these piers.
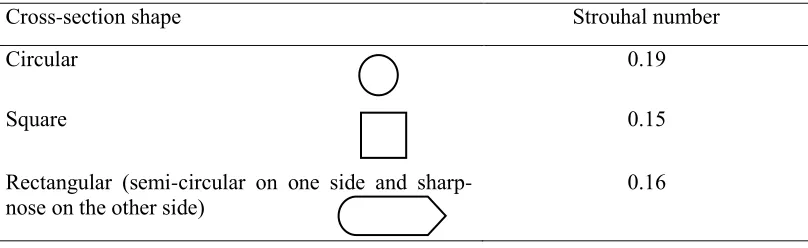
Analysis of Strouhal number in Re number of 200, considering the frequency of vortex shedding, length of each pier cross-section, and flow velocity of 1 m/s for all three sections of bridge piers are presented in Table 2.
Table 2. Strouhal number at Re = 200
Cross-section shape Strouhal number
Circular 0.19
Square 0.15
Rectangular (semi-circular on one side and sharp-nose on the other side)
0.16
3.4. Analysis of Flow Characteristics
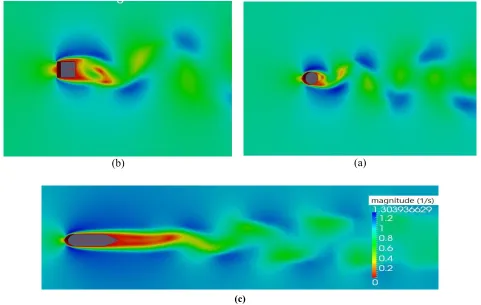
One of the factors that are considered for comparison of the performance of piers is the severity or magnitude of occurrence of vortex breakdown. Comprehending the way this breakdown takes place largely depends on the flow separation in the wake region. The vortex which begins from the upper corner of the pier base, as a result of its clockwise rotational motion, creates an upward vertical force component and a horizontal force component onto the base. However, the Vortex formed in the bottom corner of the pier base, due to counterclockwise swirling, generates a downward vertical force component and a horizontal component onto the base. Consequently, it can be concluded that in
one period of lift oscillation force, the drag force passes two frequency periods. As a matter of fact, the frequency of the drag force is twice the frequency of the lift force. Vortex breakdown for three pier cross-sections is depicted in Fig. 14.
Figure 14 illustrated that having a sharp-nose edge in the wake zone reduces the vortex breakdown because the flow separates in a better way from the pier surface and causes vortex breakdown to occur further from the pier. Then again, vortex breakdown in square pier is more severe than the circular pier, and this suggests that large fluctuation force is exerted to the square pier.
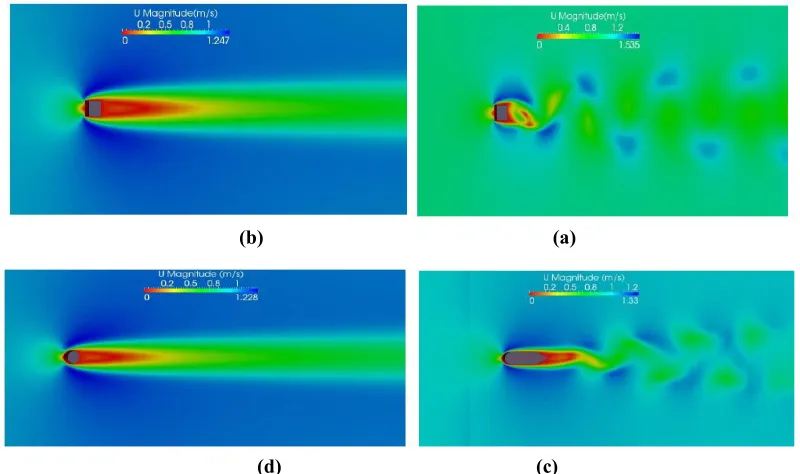
Figure 15 indicates the examination of the flow velocity after the collision of the flow to the pier base. The highest flow velocity was calculated at both Re = 40 and Re = 200 for the square pier.
The fluid flow that moves on a flat, stable surface, attaches to it in contact with this surface. In numerical modeling, this is contemplated as a non-slip condition. This phenomenon causes the fluid motion in a close layer to the surface to become slow and generates a boundary layer. Inside the boundary layer, fluid velocity increases from
zero on the solid surface to its full value, which is equivalent to flow velocity outside of this layer. This is clearly indicated in the velocity contours of Fig. 15. The flow velocity contours displayed that in the square pier, flow velocity at Re = 200 is equal to 1.55 m/s and at Re = 40 is equal to 1.247 m/s. On the other hand, sharp corners in the pier base increase flow velocity. This is not the case for round corners in the pier base. This discussion is evident in Fig. 15, too.
(a) (b)
(c)
(b) (a)
(d) (c)
Fig. 15. Flow velocity contours after collision to: a) Square base at Re = 200, b) Square base at Re = 40, c) Rectangular base with semi-circular edge and sharp-nose edge (Re = 200) and d) Circular base at Re =
40 3.4.2. Pressure Contours
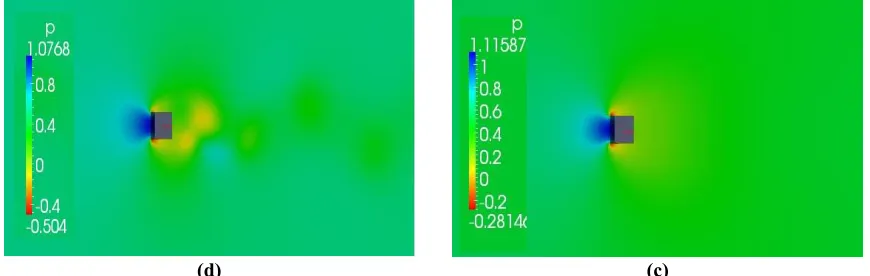
By examining the pressure contours at three different pier cross-sections and Re numbers of 40 and 200, it was found that maximum flow pressure occurred at the square cross-section. Figure 16 persuades that four different forms of pressure contours. Separated flow-layers from the pier base generated individual vortices in the backside
of the pier. These vortices can create very high suctions near the corners. Considering the pressure contours, it can be concluded that maximum pressure is generated in the upstream section and minimum pressure (almost zero) occurred around the pier base. The highest pressure values belonged to the square pier (1.074 Pa at Re = 200 and 1.115 Pa at Re = 40).
(d) (c)
Fig. 16. Pressure contours : a) Rectangular pier at Re = 40, b) Circular pier at Re = 200, c) Square pier at Re = 40 and d) Square pier at Re = 200
3.4.3. Streamlines
Flow lines formed by flow collision with pier bases are depicted in Fig. 17. It could be understood from Figures 14 and 17 that at Re = 40, where the flow regime is laminar, two symmetrical static vortices occurred in the upstream region. As Re number increases, these vortices become larger. At Re = 200, the laminar flow regime is periodic, and the creation of vortices in the downstream region is expected. This flow instability is known as Von Karman instability. The generated vortices in
downstream sections approve this discussion. Formation of these vortices is alternating, and they form on upper and lower sides of piers’ symmetry-axes. The direction of vortex rotation is clockwise above the horizontal line and is counterclockwise below the horizontal line. The intensity of vortex occurrence at the square and circular piers is more than rectangular pier (with a semi-circular edge on one side and a sharp-nose edge on the
other side).
(b) (a)
(d) (c)
4. Conclusions
In this study, numerical modeling of flow around various cross-sections of bridge piers was performed at Reynolds numbers of 40 and 200, by applying OpenFOAM software. GAMBIT software was utilized for mesh generation of the pier-base zone. Drag and lift coefficients, Strouhal number, velocity contours, pressure contours, and streamlines were either calculated or drawn for each pier cross-section type. The following results were obtained from this study:
- The drag coefficient for the square base was more than the circular base, and the rectangular base had the lowest drag coefficient.
- The rectangular base had the lowest lift coefficient, and the lift coefficient of the circular base was more than the square base. - Strouhal number of the circular base was more than the other two bases.
- As Re number is increased, the drag coefficient value is decreased.
- Lower drag and lift forces are exerted on the rectangular pier base (which has a semi-circular edge on one side and a sharp-nose edge on the other side) compared to other pier cross-sections. This indicates the better performance of this type of rectangular pier. - Comparison of the shapes of vortices in the downstream of flow zone showed that sharp-nosed edge and a semi-circular edge on rectangular pier reduced the severity of vortex breakdown and caused the vortices to form further downstream of the pier.
- Since the created vortices around the pier base play a crucial role in river bed erosion, by limiting the formation of these vortexes, the pier performance is improved.
- By inspecting the Strouhal number and lift coefficient of the rectangular pier, it can be
concluded that this cross-section has the best performance with respect to the other two cross-sections.
- Reduction of vortex shedding decreased collision of pulsating forces to the piers. - Given the drag and lift coefficients, the intensity of vortex breakdown, and Strouhal number for square and circular-base piers, the highest forces are exerted to these cross-sections.
REFERENCES
[1] Fredsoe, J., Hansen, E.A. (1987). “Lift forces on pipelines in steady flow.’’ Journal of Waterway, Port, Costal and Ocean Engineering, ASCE, Vol. 113, pp. 139-155.
[2] Park, J., Kwon, K., Choi, H. (1998). “Numerical solutions of flow past a circular cylinder at Reynolds number up to 160.’’ KSME International Journal, Vol. 12, No 6, pp. 1200-1205.
[3] Saha, A.K., Biswas, G., Muralidhar, K. (2003). “Three-dimensional study of flow past a square cylinder at low Reynolds number.’’ International Journal of Heat and Fluid Flow, Vol. 24, pp. 54-66. [4] Zhao, M., Cheng, L., Teng, B., Liang, D.
(2005). “Numerical simulation of viscous flow past two circular cylinders of different diameters.’’ Applied Ocean Research, Vol. 27, pp. 39-55.
[5] Zhang, L.T., Gay, M. (2008). “Imposing rigidity constraints on immersed objects in unsteady fluid flows.’’ Computational Mechanics, Vol. 42, pp. 357-370.
[6] Sami Akoz, M., Salih Kirkgoz, M. (2009). “Numerical and experimental analysis of the flow around a horizontal wall-mounted circular cylinder.’’ Transaction of the Canadian Society for Mechanical Engineering, Vol. 33, pp. 189-215. [7] Lee, T., Kim, Y., Chang, Y., Choi, J. (2009).
method.’’ Journal of Korean Physical Society, Vol. 54, No. 3, pp. 1068-1071. [8] Gera, B., Pavan, K.S., Singh, R.K. (2010).
“CFD analysis of 2D unsteady flow around a square cylinder.’’ International Journal of Applied Engineering Research, Vol. 1, No. 3, pp. 602-610.
[9] Omid Naeini, S.T., Fazli, M. (2010). “Numerical modeling and physical observation of the effect of shape of bridge piers on the imposed dynamic forces.’’ Civil Engineering Infrastructures, Vol. 44, No. 5, pp. 741-751. (In Persian).
[10] Bai, H., Li, J. (2011). “Numerical simulation of flow over a circular cylinder at low Reynolds number.’’ Advanced Materials Research, Vols. 255-260, pp. 942-946.
[11] Keramati Farhoud, R., Amiralaie, S., Jabbari, G.H., Amiralaie, S. (2012). “Numerical study of unsteady laminar flow around a circular cylinder.’’ Journal of Civil Engineering and Urbanism, Vol. 2, Issue 2, pp. 63-67.
[12] Vikram, C.K., Krishne Gowda, Y.T., Ravindra, H.V. (2014). “Analysis by CFD for flow past circular and square cylinder.’’ International Journal of Innovations in Engineering and Technology, Vol. 4, Issue 3, pp. 72-76. [13] The Open Source CFD Toolbox
OpenFOAM. (2010). GNU Free Documentation License.
[14] Sarreshtedari, A., Varedi S.R. (2011). “Fluid flow modeling and heat transfer by OpenFOAM software.” Shahrood University of Technology, Shahrood, Iran. [15] Sumer, B.M., Fredsoe, J. (1997). “Hydrodynamics around cylindrical structures.’’ World Scientific Publication Co., Ltd., Singapore.
[16] Roshko, A. (1961). “Experiments on the flow past a circular cylinder at very high Reynolds number.” Journal of Fluid Mechanics, Vol. 10, pp. 345-356.
[17] Schewe, G. (1983). “On the force fluctuations acting on a circular cylinder in cross flow from subcritical up to
![Fig. 4. Comparison of drag coefficient in this study and Zhang and Gay [5].](https://thumb-us.123doks.com/thumbv2/123dok_us/8957759.1867127/6.612.149.467.434.551/fig-comparison-drag-coefficient-study-zhang-gay.webp)