Dipankar et al. World Journal of Pharmaceutical and Life Sciences
BASIC PHYSICOCHEMICAL ANALYSIS OF WATER SAMPLES COLLECTED FROM
EAST SIKKIM
Rishi Choudhury, Koushal Singh, Utsav Sharma, Puja Newar, Arzoo Newar and Dipankar Nath*
Department of Pharmaceutical Analysis and Quality Assurance, Himalayan Pharmacy Institute, Majhitar, East Sikkim, India.
Article Received on 06/11/2018 Article Revised on 27/11/2018 Article Accepted on 17/12/2018
INTRODUCTION
Water is one of the most important substances we know. It is present almost everywhere. All animals, plants and humans need water to survive. Water has been important for us for thousands of years. Without water there would be no life on earth. Chemically water is composed of hydrogen and oxygen. It exists in gaseous, liquid, and solid states. It is one of the most plentiful and essential of compounds. A tasteless and odorless liquid at room temperature, it has the important ability to dissolve many other substances. Indeed, the versatility of water as a solvent is essential to living organisms. Life is believed to have originated in the aqueous solutions of the world’s oceans, and living organisms depend on aqueous solutions, such as blood and digestive juices, for biological processes.[1]
Water plays an important role in the pharmaceutical industry. It may be used as an excipient, or used for reconstitution of products, during synthesis, during production of finished product, or as a cleaning agent for rinsing vessels, equipment and primary packing materials etc. There are many different grades of water used for pharmaceutical purposes. Several are described in USP monographs that specify uses, acceptable methods of preparation, and quality attributes. These water can be
divided into two general types: bulk waters, which are typically produced on site where they are used; and packaged waters, which are produced, packaged, and sterilized to preserve microbial quality throughout their packaged shelf life. There are several specialized types of packaged waters, differing in their designated applications, packaging limitations, and other quality attributes. Different grades of water quality are required depending on the different pharmaceutical uses. Control of quality of water, in particular, the microbiological quality, is a major concern and the pharmaceutical
industry devotes considerable resource to the
development and maintenance of water purification systems.[2]
As we have seen that water plays an important role in pharmacy, it becomes very important to ensure that water which is used is of optimum quality. We know that due to rapid industrialization and exploding population the demand for water supply has increased enormously. Hence, the availability of fresh water has become a major cause of concern due to increased pollution of rivers by industrial and domestic discharge. This discharge of effluents results in the increase or decrease of various physicochemical parameters, which makes it unfit for human consumption.
Research Article ISSN 2454-2229
wjpls, 2019, Vol. 5, Issue 1, 79-89
World Journal of Pharmaceutical and Life Sciences
WJPLS
www.wjpls.org SJIF Impact Factor: 5.008
*Corresponding Author: Dipankar Nath
Department of Pharmaceutical Analysis and Quality Assurance, Himalayan Pharmacy Institute, Majhitar, East Sikkim, India.
ABSTRACT
Water is one of the most important substance found in nature. It is present almost everywhere. All animals, plants and humans need water to survive. Water has been important for us for thousands of years. Without water there would be no life on earth. Chemically water is composed of hydrogen and oxygen. It exists in gaseous, liquid, and solid states. Water is one of the major solvent used up the pharmaceuticals. Water plays an important role in the pharmaceutical industry. It may be used as an excipient, or used for reconstitution of products, during synthesis, during production of finished product, or as a cleaning agent for rinsing vessels, equipment and primary packing materials. Depending on the quality of water purification steps are decided. Our study was aimed to analyze the basic physicochemical chemical Parameters (qualitative as well as quantitative) of water samples collected from East Sikkim, India. As Sikkim is occupied by number Chemical and pharmaceutical companies. So our aim was to ensure about the safety aspects of water collected from different source by comparing them samples with Packaged drinking water.
Dipankar et al. World Journal of Pharmaceutical and Life Sciences
Sikkim is well known throughout for its rich fauna and flora. About 70% of its total area is filled with forests. Sikkim is also known for its rich source of medicinal plants hence making it a major site of attraction for various researchers and scientists. The environmental and climatic conditions of the state make it best suitable for industrialization, hence attracting a lot of pharma giants. The increase in the number of industries has lead to the increase in dumping of wastes in the streams or rivers which have affected the quality of water to some extent. The eastern region of Sikkim has a large number of industries located in the area. Hence it is important to analyze the water quality and keep a check on it.
Various physical, chemical, biological and
microbiological parameters, which are essential to be checked before it is fit for human consumption as well as for the manufacturing of drugs, as listed as follows:
Physical Parameters
1. Temperature
2. Colour
3. Odour
4. Taste
5. Turbidity
6. Transparency
7. Conductivity
8. Total solid
9. Total dissolved solids 10. Total suspended solids 11. Velocity
Chemical Parameters
1. pH
2. Dissolved Oxygen (DO)
3. Biochemical Oxygen Demand (BOD)
4. Chemical Oxygen Demand (COD)
5. Carbon dioxide
6. Alkalinity
7. Hardness
8. Various metals and nonmetals like calcium,
magnesium, chlorides, sulfates, nitrite, phosphorus, sodium, potassium and nitrates
9. Tannin and lignin
10. Oil and grease
11. Heavy metals like chromium, iron, arsenic, lead, mercury, manganese, cadmium and zinc.
Biological and microbiological analysis
1. Plankton
2. Nekton
3. Neuston
4. Benthos.[3]
Phadatare et al. (2016) stated that water quality is directly related to the physical, chemical, biological and radiological property of water. These properties of water are affected because of the pollution of water due to various human activities. She studied how disposal of pollutant in the water bodies changes the standard
quantity of parameters in water. There are various parameters which can be assess for measurement of quality of water but when consideration of all parameters
may generate complexity towards quality. So,
development of Water Quality Index (WQI) is the quite popular method in water quality assessment.[4] Singh et al. (2015) stated how water quality analysis is one of the most important aspects in surface water studies. water quality is a critical factor for assessing the pollution level. In his study the water samples were collected from 12 different sampling stations for evaluate the water quality status of river Narmada during September 2010. A total 16 water quality minimum and maximum value of air temperature, water temperature, turbidity, pH, electrical conductivity, total dissolved solids, free carbon dioxide, total alkalinity, chloride, total hardne Calcium Hardness dissolved oxygen, nitrate, orthophosphate, biochemical oxygen demand, chemical oxygen demand were noted.[5] Rahmanian et al. (2015), The drinking water quality was investigated by him in suspected parts of Perak state, Malaysia, to ensure the continuous supply of clean and safe drinking water for the public health protection. In this regard, a detailed physical and chemical analysis of drinking water samples was carried out in different residential and commercial areas of the state.[6]
Our study was carried out to assess the basic Physico-chemical Parameters of waters collected from different sources of East Sikkim which is a remote village in the northeastern part of India. More over this particular area is surrounded with good number of pharmaceutical industry too. So our study can help to get some data regarding the quality of water in the surroundings areas which is used up the local people on their day to day life. So we have collected water from two different sources in and around East Sikkim and chosen for our study.
MATERIALS AND METHODS
Sample collection and preservation
Water samples were collected directly from Khanikhola and Teesta and temperatures were recorded. The samples were preserved at Room temperature (approximately 380C) in plastic bottles.
Physicochemical parameters Colour
Water which was collected was found to be turbid because of the presence of various contaminants and microorganisms. The color of the water was checked by Visual method. In this method Specified quantity of water sample was first centrifuged then transferred in a Nessler’s Cylinder and the color was then compared in bright sunlight.[3]
Odour
Dipankar et al. World Journal of Pharmaceutical and Life Sciences
ratio of sample with odor free water until the least perceptible odor can be determined (approx. 100 ml). then different dilution samples are heated (approx. 60oc) over hot plate. The observations are then made from the lower concentration samples to higher concentration samples. As the sensitivity of odor varies from person to person, it is advisable to make observation from at least 5-6 persons.[3]
Temperature
The water samples were collected in a plastic bottle directly from the source and the temperature was measured instantly with the help of a thermometer.[3]
Determination of conductivity
Instrument used: Digital Conductivity meter (Labtech
Instruments).
Conductivity refers to the degree at which a Specific material conducts electricity. The conductivity of the samples was checked by using Conductivity meter.
Procedure
Calibration of Conductivity meter: Calibration of conductivity meter was done by using 0.01 M KCl (0.5232gm in 1L of distilled water which is equal to 1000μS/cm).
Conductivity Sensor was plugged into the data
collection system, and turn on the system. The Conductivity Sensor does need to be calibrated for general studies. Pressed the button for µs/cm range for sample. If it was found that the Conductivity Sensor factory calibration is inadequate, calibration of conductivity Sensor was done using as standard value.
Display was set to show conductivity measurement.
Immersed the end of Conductivity or Salinity probe
into the water to be measured. When the reading stabilizes, conductivity reading was recorded.[7,8,9]
Note: It’s important to immerse the wholes near the end of the sensor. Probes need to be Swirled to ensure any air bubbles are removed from the end of the probe.
Determination of pH
Instrument used: Digital pH meter (Thermo
Instruments) pH is a scale of acidity from 0 to 14. It tells how acidic or alkaline a substance is. More acidic solutions have lower pH. More alkaline solutions have higher pH. The pH of the water samples was determined by Using Digital pH meter.
Calibration of Digital pH meter: pH meter was
calibrated by using buffer solution of pH 4,7 and 9.2. Temperature was adjusted and was maintained at 25oC.
Procedure
Water Samples were stirred vigorously using a clean
stirring rod.
Pour about 40ml ± 5ml sample into the glass beaker
and the beaker was covered by using watch glass.
Let the sample stand for a minimum of one hour to
allow the temperature to stabilize, stirred it
occasionally while waiting. Measured the
temperature of the sample and adjusted the temperature controller of the pH meter to that of the sample temperature.
This adjustment should be done just prior to testing
on meters with an automatic temperature control, followed the manufacturer’s instructions.
Immerse the electrode(s) of the pH meter into the water sample and turn the beaker slightly to obtain good contact between the water and the electrode(s).
The electrode(s) require immersion 30 seconds or longer in the sample before reading to allow the meter to stabilize. If the meter has an auto read systems, it will automatically signal when stabilized.
Read and recorded the pH value to the nearest tenth
of a whole number. If the pH meter reads to the hundredth place, a round off rule will apply as follows If it is greater than 5, round the tenth place digit up one unit. If the hundredth place digit equals 5, round the tenth place digit to the nearest even number.
Electrode was rinsed well with distilled water, dab lightly with tissues to remove any film formed on the electrode(s).[10]
Limit Tests
Limit tests are quantitative or semi quantitative tests to identify and control small quantities of impurity which are likely to be present in the substance. The quantity of impurities in a substance is often small but can cause errors in different circumstances. To avoid these errors, specific limit tests are performed. We performed a few of them which are listed below, Limit test of Chloride, Sulphate, Iron and Heavy metals was performed by using Nessler Cylinder whereas Limit test of Arsenic was performed by using Gutzeit Test.[11]
Limit test for chloride Principle
Dipankar et al. World Journal of Pharmaceutical and Life Sciences
Reaction involved Chemical Requirements
Sodium chloride Nitric acid(dilute) Silver nitrate
Procedure
Table 1: Procedure for limit test for Chloride.
Standard Test
1 ml of 0.05845% w/v solution of NaCl was taken in a
Nessler’s cylinder and 10 ml of HNO3 was added.
Specified Volume of water sample was taken in a
Nessler’s cylinder and 10 ml of HNO3 was added.
1 ml of 0.1 M AgNO3 solution was added to the above
solution and stirred properly and the volume was made up to 50 ml with distilled water, it was allowed to stand for 5 minutes. Turbidity/ opalescence was observed
1 ml of 0.1 M AgNO3 solution was added to the above
solution and stirred properly and the volume was made up to 50 ml with distilled water, it was allowed to stand for 5 minutes. Turbidity/ opalescence was observed
The turbidity Produced by the Standard and Samples were compared.[12]
Limit test for Sulphate Principle
The limit test for sulphate is carried out on the basis of the reaction between barium chloride and soluble sulphates in presence of dilute hydrochloric acid. Then, the comparison of the turbidity produced by a given amount of the substance is done with a standard turbidity obtained from a known amount of sulphate and same volume of dilute hydrochloric acid have been added to both the solutions. The barium chloride test solution in the I.P. has been replaced by Barium Sulphate Reagent which is having barium chloride, Sulphate-free alcohol and a solution of potassium sulphate. Potassium sulphate has been added to increase the sensitivity of the test. The ionic concentrations in the reagent has been so adjusted that the solubility of barium sulphate gets exceeded, and the very small amount of barium sulphate present in the reagent acts as a seeding agent for the precipitation of barium sulphate, if sulphate is present in the substance under test. Alcohol helps to prevent super-saturation and thus produces a more uniform opalescence.
The substance passes the limit test if it produces a turbidity that is less than the standard.
Reaction involved
Chemical Requirements
Barium Chloride
Dilute hydrochloric acid
Sulphate-free alcohol
Potassium sulphate.
Procedure
Preparation of BaSO4 Reagent: 15ml of 0.5M BaCl2, 55ml of distill water and 20ml sulphate free alcohol was mixed and to this 5ml 0.0181% w/v K2SO4 as added. The volume was made up to 100ml with distilled water and mixed.
Table 2: Procedure for limit test for Sulphates.
Standard Test
In a 50 ml Nessler’s cylinder, a mixture of 1 ml of 0.1089% w/v solution of K2SO4+ 2 ml HCl + 5 ml BaSO4 reagent was added and made up the mark with distilled H2O.
In a 50 ml Nessler’s cylinder a mixture of specified quantity of water sample + 2 ml HCl + 5 ml BaSO4 reagent was added and made up the mark with distilled H2O.
Resulting solution was allowed to stand for 5 minutes. Turbidity/ opalescence was observed
Resulting solution was allowed to stand for 5 minutes. Turbidity/ opalescence was observed
The turbidity Produced by the standard and the samples were compared.[12]
Limit test for Iron Principle
The limit test for iron is based on the reaction of iron in an ammonical solution in presence of citric acid, with thioglycollic acid when a pale pink to deep reddish purple colour is formed due to ferrous compounds. The color produced from a special amount of substance from the test is compared by viewing vertically with a standard (ferric ammonium sulphate). If the color from test solution is less dark than the standard, then the sample passes the limit test. Citric acid does not allow
the precipitation of iron by ammonia by forming a complex with it. The color due to ferrous compound gets destroyed by oxidizing agents and alkalis. The state of oxidation of iron has been immaterial as Iron (III) gets reduced to Iron (II) by thioglycollic acid.
Thioglycollic acid, (HS)CH2COOH, is a useful analogue
Dipankar et al. World Journal of Pharmaceutical and Life Sciences
It is a colorless liquid having an unpleasant odor. The thioglycollic acid test for iron has now largely replaced former test which was based on the formation of the highly colored ferric thiocyanate by reaction between ammonium thiocyanate and iron(III) salts. It is believed that the thioglycollic acid test is more sensitive than the ammonium thiocyanate test.
The color produced from a specified amount of the substance is compared with the standard color obtained from a known amount of iron under exactly similar conditions. This test is very sensitive and interference with any other cations is eliminated by making use of 20% citric acid solution, which forms a complex with other metal cations.
Reactions involved
2Fe3+ + 2HSCH2COOH 2Fe2+ + 2H+ + HOOCCH2SSCH2COOH
Chemical requirements
Ferric ammonium sulphate
Citric acid (Iron-free)
Thioglycollic acid
Ammonia
Procedure
Preparation of standard solution of Iron: It was
prepared by adding 0.273 g of ferric ammonium sulphate [NH4Fe(SO4)2.12H2O] to 1.5 ml of HCl and adding sufficient water to produce 1000 ml. Each ml of solution contains 0.02 mg of iron.
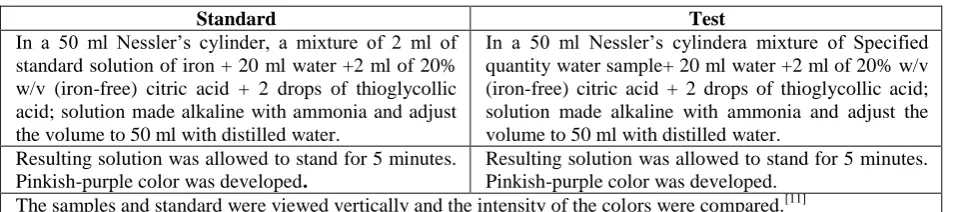
Table 3: Procedure for limit test for iron.
Standard Test
In a 50 ml Nessler’s cylinder, a mixture of 2 ml of standard solution of iron + 20 ml water +2 ml of 20% w/v (iron-free) citric acid + 2 drops of thioglycollic acid; solution made alkaline with ammonia and adjust the volume to 50 ml with distilled water.
In a 50 ml Nessler’s cylindera mixture of Specified quantity water sample+ 20 ml water +2 ml of 20% w/v (iron-free) citric acid + 2 drops of thioglycollic acid; solution made alkaline with ammonia and adjust the volume to 50 ml with distilled water.
Resulting solution was allowed to stand for 5 minutes. Pinkish-purple color was developed.
Resulting solution was allowed to stand for 5 minutes. Pinkish-purple color was developed.
The samples and standard were viewed vertically and the intensity of the colors were compared.[11]
Limit test for heavy metals Principle
The limit test for heavy metals is designed to determine the content of metallic impurities that are colored by hydrogen sulphide or sodium sulphide under the condition of the test. The heavy metals (metallic impurities) may be iron, copper, lead, nickel, cobalt, bismuth, antimony, etc. The method is based upon the reaction of the heavy metal ion with hydrogen sulphide leading to the formation of heavy metal sulphides. The metal sulphides remain distributed in a colloidal state and give rise, to a brownish coloration. The color produced in the test solution is compared to that of standard solution containing a definite amount of lead.
Reactions involved
Lead nitrate
Nitric acid
Acetic acid
Ammonia solution
Dilute hydrochloric acid
Ferrous sulphide
Procedure
Preparation of Standard Lead solution: In a 250ml of
volumetric flask, 0.4 gm of lead nitrate was taken in distilled water and a 2 ml of nitric acid was added on to it and finally volume was adjusted up to the mark with distilled water.
Preparation of Hydrogen Sulphide solution: Weigh
Dipankar et al. World Journal of Pharmaceutical and Life Sciences
Table 4: Procedure for limit test for heavy metal.
Standard Test
In a 50 ml Nessler’s cylinder, a mixture of 2 ml of standard lead solution+25 ml Distilled water was added. The pH was adjusted between 3 - 4 by adding acetic acid or ammonia solution.
In a 50 ml Nessler’s cylinder, a mixture of specified amount of water sample+25 ml Distilled water was added. The pH was adjusted between 3 - 4 by adding acetic acid or ammonia solution
To the above solution, 10 ml of freshly prepared hydrogen sulphide solution was added. Mixed well and made up the volume to 50 ml with distilled water.
To the above solution, 10 ml of freshly prepared hydrogen sulphide solution was added. Mixed well and made up the volume tom 50 ml with distilled water. The intensity of coloration of standard and samples were compared.[11]
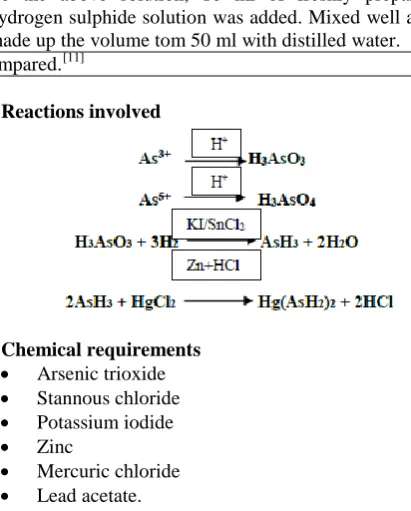
Limit test for arsenic Principle
Arsenic is a well-known undesirable and harmful impurity which is present in most substances. Many qualitative and quantitative tests for arsenic are known. However, the pharmacopoeias method is based on the Gutzeit test, using the Gutzeit apparatus.
The principle is based on Gutzeit test wherein, all arsenic present is duly converted into arsine gas (AsH3) by subjecting it to reduction with zinc and hydrochloric acid. The arsenious present gets converted to arsine gas easily with the help of reducing agents. For arsenic present in the sample, it reacts with hydrochloric acid to give arsenic acid, which gets reduced, by reducing agents, to arsine gas. When this gas is passed over mercuric chloride paper, it produces a stain, which ranges in colour from yellow to brown, the intensity and length of which are proportional to the amount of arsenic present. B.P. suggests the use of mercuric chloride paper instead of mercuric bromide paper. The Gutzeit apparatus is prepared for standard and the samples. A standard stain prepared from a definite quantity of arsenic, is used for comparison. The stain produced by the test is compared to the stain produces by the standard. If the stain produced by the sample is lesser than that of the standard, then the sample passes the limit test.
Reactions involved
Chemical requirements
Arsenic trioxide
Stannous chloride
Potassium iodide
Zinc
Mercuric chloride
Lead acetate.
Procedure
Preparation of Stannated Hydrochloric Acid: It was
prepared from solution of stannous chloride by adding an equal volume of hydrochloric acid, boiling down to the original volume and filter through a fine-grained filter paper.
Standard Arsenic Solution: 0.33gm of AsO3(arsenic
trioxide) was dissolved in 5ml of 2M NaOH and dilute to 250ml with distilled water. 1ml of above solution was then taken in a 100ml volumetric flask with distilled water.
Table 5: Procedure for limit test for arsenic.
Standard Test
A known amount dilute arsenic standard solution was kept in the wide open glass bottle of the apparatus.
Specified amount of water sample was kept in wide open glass bottle of the apparatus.
To this, 10 ml of stannated HCl, 5ml of 1M KI.and10gm of granulated zinc was added.
To this, 10 ml of stannated HCl, 5ml of 1M KI and10gm of granulated zinc was added.
Above solution was kept aside for 40 minutes and then the mercuric chloride paper was removed slowly from between the bungs to see the intensity of the stain.
Above solution was kept aside for 40 minutes and then the mercuric chloride paper was removed slowly from between the bungs to see the intensity of the stain. The intensity of the stain Produced by the standard was compared with the test samples.[11]
Determination of acidity of water Principle
Acidity in water sample is due to the presence of carbon dioxide, mineral acid and hydrolyzed salts. Acidity in water not only makes it unsuitable for the growth of
aquatic plants fish and other useful microorganisms but also for domestic consumption and irrigation.
Dipankar et al. World Journal of Pharmaceutical and Life Sciences
indicator(pH4.5). Acidity thus determined is called the methyl orange acidity. Phenolphthalein acidity also called total acidity is determined by titrating the water samples against standard alkali using phenolphthalein as indicator (pH range 8.3).
Chemical requirements
Standard N/20Sodium hydroxide solution.
Phenolphthalein indicator.
Methyl orange indicator Procedure
In a 250 ml conical flask 100ml of water sample was
taken,1-2 drops of N/10 Na2S2O3was added to destroy any residual chlorine.
1-2 drops of methyl orange indicator to it, If the solution turns yellow then methyl orange acidity is absent.
But if the solution turns pink then it was titrated against N/20Standard NaOH solution until the pink colored solution changes to yellow. Noted the volume of NaOH solution used.
Now few drops of phenolphthalein indicator were added to the yellow colored solution and then titrate with N/20 NaOH solution until the pink color produced persist for few second. Noted the volume of NaOH used in the titration.[13]
Determination of permanent hardness Principle
This determination is based on the precipitation of calcium and magnesium salts in the form of carbonates by the action of excess standard Na2CO3 solution. After the separation of the precipitate the residual unchanged Na2CO3 is titrated with HCL solution in the presence of methyl orange and the volume of Na2CO3 solution taken for precipitation of the calcium and magnesium salts is found by difference. The hardness is easily calculated from the result. After addition of Na2CO3 the solution is evaporated to dryness, when the acid salts Ca(HCO3)2
and Mg(HCO3)2 decompose completely to form
insoluble carbonates. Therefore, this method gives not the total but only the permanent hardness of water.
Chemical requirements
Sodium Carbonate Hydrochloric acid Methyl orange.
Procedure
Pipetted out 100ml of the water into a porcelain dish and from the burette an exactly measured volume (10-25 ml) of approximately 0.1N Na2CO3 solution was added.
Then evaporate the mixture until it dries off
completely.
The dry residue was then treated with 15-20 ml of distilled water free from carbon dioxide to extract residual (excess) Na2CO3.
Filter off the undissolved residue consisting of calcium and magnesium carbonate and wash the residue three to four times with the same water,
collected the filtrate and washings in a conical flask for titration.
At the end of washing, 1-2 drops of methyl orange is
added to the solution and titrate it with hydrochloric acid.
Now determined the relationship between the
equivalent volumes of Na2CO3 and HCl solutions. The simplest way to do this is to measure out with a burette into a flask the same volume of Na2CO3 solution as was used for the determination, and to titrate it (in duplicate or triplicate) with the HCl solution in the presence of 1-2 drops of methyl orange indicator.[14]
Determination of carbonate hardness Principle
A known volume of water is titrated with hydrochloric acid in presence of methyl orange, when the following reaction takes place:
Chemical requirements
Methyl orange
Hydrochloric acid
Procedure
Measured about 100-200 ml of the water in a Conical Flask, 2-3 drops of methyl orange Indicator were added, and titrated with standard 0.1N HCl solution.
Titration was repeated for two to three times and t the average of the concordant results was taken.[14]
Estimation of chloride by mohr’s method Principle
Chlorides are present in varying proportions in all natural waters. Chloride rich natural water through water soluble chloride salts from the surface of soil, through human excrete, through industrial waste and through artificial spray. Chlorides present in reasonable concentration(75-200mg/l) in water are not harmful for human consumption.
The determination of Chlorides involves the use of silver nitrate in the presence of potassium chromate as indicator. Initially white silver chloride is precipitated as indicted by its solubility product.
Dipankar et al. World Journal of Pharmaceutical and Life Sciences
Therefore, it is necessary to perform blank titration. Volume of silver nitrated used in the blank titration is subtracted from the volume of silver nitrate used in titrating the sample.
Chemical requirements
Silver Nitrate
Potassium chromate
Phenolphthalein
Sodium carbonate
Preparation of Standard N/50 Silver Nitrate Solution: Weigh accurately (169.9/50 x 4= 0.8495) 0.85 gm of A.R Silver nitrate and transferred it in a 250 ml volumetric flask, distilled water was added Stopper the flask and shake thoroughly so that silver nitrate completely dissolves. Solution was made up to the mark by adding distilled water.
Preparation of Potassium chromate indicator: Dissolved 5gm of K2CrO4 in about 5ml of distilled water and few drops of silver nitrate solution was until a definite red ppt. forms. Let it stand for 12hrs and filter and finally dilute to 100ml with distilled water.
Preparation of Phenolphthalein indicator: Weigh 0.5gm of phenolphthalein powder and 50ml of Absolute ethanol was added, stir well to dissolve properly and made up the volume to 100ml with distilled water.
Preparation of Standard N/50 Sodium carbonate
Solution: Weigh accurately (53/50=1.060) 1.060gms of
AR grade sodium carbonate and transfer it to a 1 L Volumetric flask. Few ml of distilled water was added, stopper the flask and shake thoroughly so that the alkali completely dissolves. Volume was made up to the mark by adding more distilled water.[15]
Procedure
The given water sample was filtered so as to remove
any suspended material. 50ml of this filtered sample was pipette out in a large porcelain dish and 3-4 drop of phenolphthalein indicator was added to it.
A pink colour was develop, so dil. H2SO4 was added
drop wise until the pink colour just disappeared.
If the pink colour is not obtained on adding
phenolphthalein indicator than add 3-4 drop methyl orange indicator to the red colour solution obtained after adding methyl orange indicator add N/50 Na2CO3 solution until the colour of the solution changes to the orange. However, if the yellow colour solution is obtain on adding methyl orange than do not add Na2CO3 solution.
The resultant solution was transferred in a 250ml conical flask and 1ml of K2CrO4 indicator was added to it.
Slowly standard N/50 AgNO3 solution was added from the burette with constant shaking. A white ppt. of silver chloride was obtained.
The addition process was continued slowly till a red
colour appeared in the flask, which disappeared on shaking. Then, silver nitrate solution was added drop by drop until a permanent reddish brown colour was obtained.
The colour change may be more readily determine by performing the blank titration. The volume of silver nitrate used was noted and the process was repeated again till we got two concordant readings.
RESULTS
Physicochemical parameters Color (visual method)
Table 6: Colour Comparison by visual method.
Sample Inference
Teesta Water Less turbid
Khanikhola Water Turbid
Drinking water Clear
Odour
Table 7: Odour Comparison of collected Water Sample.
Sample Inference
Teesta Water Characteristic
Khanikhola Water Characteristic
Drinking water Characteristic
Table 8: Temperature of collected Water Sample.
Sample Inference
Teesta Water 19oC
Khanikhola Water 25oC
Drinking water 27oC
The temperature of the samples were found to be of the order:
Drinking water > Khanikhola Water > Teesta Water
Determination of conductivity
Table 9: Result for determination of conductivity.
Sample Conductivity(μs/l)
Tessta Water 699.4
Khanikhola Water 598.2
Drinking water 530.1
The Conductivity of the samples were found to be of the order:
Drinking water > Teesta Water> Khanikhola Water
Determination of pH
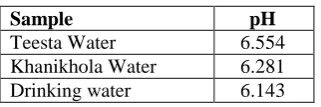
Table 10: Result for determination of pH.
Sample pH
Teesta Water 6.554
Khanikhola Water 6.281
Drinking water 6.143
Dipankar et al. World Journal of Pharmaceutical and Life Sciences
Table 11: Result for limit test for Chloride.
Sample Inference
Standard Turbidity was observed
Teesta Water Turbidity was observed
Khanikhola Water Turbidity was observed
Drinking water Turbidity was observed
The turbidity of the samples were found to be of the order:
Standard > Teesta Water > Khanikhola Water > Drinking water
Conclusion: After Comparing the Turbidity of Samples with that of Standard, it was found that standard was more turbid as compare to the samples. Hence all the samples passes the limit test for Chloride.
Limit test for sulphate
Table 12: Result for limit test of Sulfate.
Sample Inference
Standard Turbidity was observed
Teesta Water Turbidity was observed
Khanikhola Water Turbidity was observed
Drinking water Turbidity was observed
The turbidity of the samples were found to be of the order:
Standard > Teesta Water > Khanikhola Water > Drinking water
Conclusion: After Comparing the Turbidity of Samples with that of Standard, it was found that standard was more turbid as compare to the samples. Hence all the samples passes the limit test for Sulphate.
Limit test for iron
Table 13: Result for limit test for iron.
Sample Inference
Standard Pink colour was observed
Teesta Water Pink colour was observed
Khanikhola Water Pink colour was observed
Drinking water Pink colour was observed
The colour intensity of the samples were found to be of the order:
Standard > Teesta Water > Khanikhola Water > Drinking water
Conclusion: After Comparing the Intensity of the color of Samples with that of Standard, it was found that standard was more Colored as compare to the samples. Hence all the samples passes the limit test for Iron.
Limit test for heavy metals
Table 14: Result for limit test for heavy metals(Pb).
Sample Inference
Standard Greenish-black colour was observed
Teesta Water Greenish-black colour was observed
Khanikhola Water Greenish-black colour was observed
Drinking water Greenish-black colour was observed
The colour intensity of the samples were found to be of the order:
Standard > Teesta Water > Khanikhola Water > Drinking water
Conclusion: After Comparing the Intensity of the color of Samples with that of Standard, it was found that standard was more Colored as compare to the samples. Hence all the samples passes the limit test for Lead.
Limit test for arsenic
Table 15: Result for limit test for arsenic.
Sample Inference
Standard Stain was observed
Teesta Water Stain was observed
Khanikhola Water Stain was observed
Drinking water Water No stain was observed
The intensity of stain of the samples were found to be of the order:
Standard > Teesta Water > Khanikhola Water > Drinking water
Conclusion: After Comparing Colour Intensity of the stain Produced by the Samples with that of Standard on the mercuric chloride paper, it was found that standard produced more Intense stain as compare to the samples. Hence all the samples passes the limit test for Arsenic.
Determination of acidity of the sample
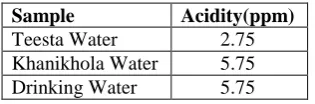
Table 16: Result for determination of acidity of the different water samples.
Sample Acidity(ppm)
Teesta Water 2.75
Khanikhola Water 5.75
Drinking Water 5.75
The order of acidity of the samples were found to be: Drinking water = Khanikhola Water > Teesta Water
Determination of hardness of water sample
Table 17: Result for estimation of carbonate hardness of different water sample.
Sample Carbonate
hardness(mg-eq/litre)
Teesta Water 5.18
Khanikhola Water 6.28
Dipankar et al. World Journal of Pharmaceutical and Life Sciences
The order of Carbonate hardness of the samples were found to be:
Khanikhola Water> Teesta Water> Drinking water
Table 18: Result for estimation of permanent
hardness of different water sample.
Sample Permanent hardness(mg-eq/litre)
Teesta Water 2.56
Khanikhola Water 1.89
Drinking Water 0.9
The order of Permanent hardness of the samples were found to be:
Teesta Water> Khanikhola Water> Drinking water
Estimation of chloride by mohr’s method
Table 19: Result for Chloride estimation by Mohr’s method.
Sample Chloride (ppm)
Teesta Water 78.1
Khanikhola Water 44.02
Drinking Water 29.82
The order of Chloride content of the samples were found to be:
Teesta Water> Khanikhola Water> Drinking water
SUMMARY
Water plays an important role in day to life, it becomes very important to ensure that water which is used is of optimum quality. We know that due to rapid industrialization and exploding population the demand for water supply has increased enormously. Hence, the availability of fresh water has become a major cause of concern due to increased pollution of rivers by industrial and domestic discharge. This discharge of effluents results in the increase or decrease of various physicochemical parameters, which makes it unfit for human consumption.
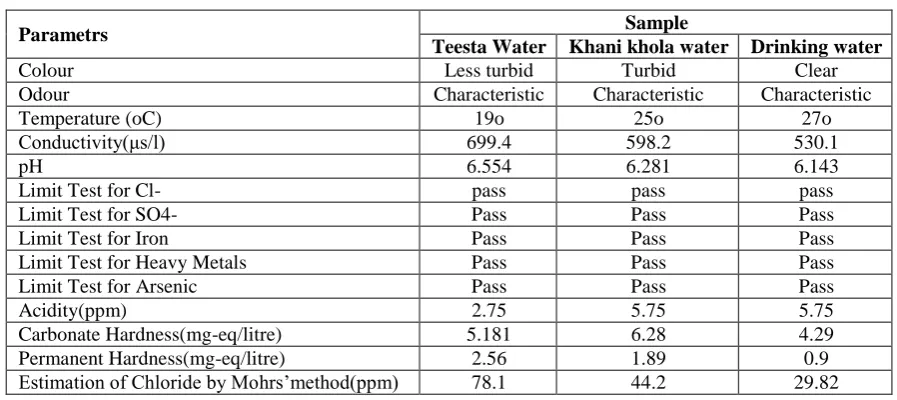
So our study mainly focused on the evaluation of quality parameters of water samples both qualitatively and quantitatively. Results of water analysis are summarized in the table.
Table 20: Summary of Experiments Performed.
Parametrs Sample
Teesta Water Khani khola water Drinking water
Colour Less turbid Turbid Clear
Odour Characteristic Characteristic Characteristic
Temperature (oC) 19o 25o 27o
Conductivity(μs/l) 699.4 598.2 530.1
pH 6.554 6.281 6.143
Limit Test for Cl- pass pass pass
Limit Test for SO4- Pass Pass Pass
Limit Test for Iron Pass Pass Pass
Limit Test for Heavy Metals Pass Pass Pass
Limit Test for Arsenic Pass Pass Pass
Acidity(ppm) 2.75 5.75 5.75
Carbonate Hardness(mg-eq/litre) 5.181 6.28 4.29
Permanent Hardness(mg-eq/litre) 2.56 1.89 0.9
Estimation of Chloride by Mohrs’method(ppm) 78.1 44.2 29.82
CONCLUSION
In Conclusion, we have successfully analyzed various Physicochemical Parameters of water samples Collected from two major water sources of East Sikkim.
Water Samples collected from Khanikhola and Teesta passes the limit tests for Chloride, Sulphate, Iron, Heavy metals and Arsenic. But it was observed that turbity/Colour Intensity/ Stain produced by both the samples were more as compare to normal drinking water. So quantification of Sulphate, Iron, Heavy metals and Arsenic these can give a better idea regarding their concentration in water samples.
PH Study confirmed us that all the water samples are in slight acidic range, can say near about neutral, whereas conductivity of Teesta water was higher as compare to the Khanikhola and Drinking water which gives us an indication that there may be presence of free ions and that was confirmed during Chloride estimation where we found Teesta water have higher concentration of Chloride as compare to Khanikhola and Drinking water.
Dipankar et al. World Journal of Pharmaceutical and Life Sciences
So in future it will be better if we include some microbiological test in our experiment which can finally give us information regarding the usage of these water.
All the results are obtained in the lab condition.
We have done only qualitative analysis so our work can give a basis for the future regarding quantification of impurity and their limit assessment.
REFERENCES
1.
https://www.english- online.at/geography/water/water-cycle-treatment.htm.
2.
https://www.pharmatutor.org/articles/quality-of-water-for-pharmaceutical-use-an-overview.
3. Arun Sethi, Systemic experiments in chemistry,
New Age International (P) Limited, Publishers, 804– 808.
4. Sneha Shankar Phadatare, Prof. Sagar Gawande;
Review Paper on Development of Water Quality Index; International Journal of Engineering and Technical Research, V5(05); 17.
5. Pawan Kumar Singh and Pradeep Shrivastava;
Analysis of water quality of river narmada; International Journal of Current Research, December 2015; 7(12): 24073.
6. N. Rahmanian, Siti Hajar Bt Ali, M. Homayoonfard,
N. J. Ali,2 M. Rehan, Y. Sadef, and A. S. Nizami; Analysis of Physiochemical Parameters to Evaluate the Drinking Water Quality in the State of Perak, Malaysia; Journal of Chemistry, 2015; 3: 1-2.
7. Healthy Water, Healthy People Testing Kit Manual,
Bozeman, Montana: The Watercourse, International Project WET, 2002.
8. National Secondary Drinking Water Regulations.
Current Drinking Water Standards, Environmental Protection Agency, 2006.
9. Quality Criteria for Water(Red Book), Washington, D.C. U.S. Environmental Protection Agency, 1976. 10. Test method for the determination of pH value of
water or soil by pH meter. Geotechnical test method gtm, 24 August 2015; 3.
11. Chatwal G.R., Pharmaceutical Chemistry –
Inorganic, Himalaya Publishing House, Mumbai, 2015; 47– 64.
12. Miniyar P.B., Ilango K., A Practical Book of
Pharmaceutical Inorganic Chemistry,
NiraliPrakashan, Delhi, 2-18.
13. Lehner B, Do¨ll P, Development and validation of a
global database of lakes, reservoirs and wetlands. Journal of Hydrology, 2004; 296: 1–22.
14. E. Uvarov, Quantitative Analysis, Mir Publishers Moscow, CBS Publishers and Distributors, Jain Bhawan, Bhola Nath Nagar, Shahdara, Delhi, 300-301.
15. Stover, H. S. and S.L. Seager, Environmental