11
Copyright © 2011-15. Vandana Publications. All Rights Reserved.Volume-5, Issue-1, February-2015
International Journal of Engineering and Management Research
Page Number: 11-16
Opinion towards the Important Perspectives of Balanced Scorecard - A
Study with Special Reference IT & ITEs Employees’ of Coimbatore
District
Shyam Umasankar K K1, Dr. Shani J2 1
Research Scholar, Karpagam University, Coimbatore, INDIA 2
ABSTRACT
Indian IT Services is valued at US $ 50 billion sector, BPM valued at USD 20 billion sector, Engineering crossed US $ 10 billion and Software products, Internet & Mobility are emerging sectors in the country. Today, existing and new companies are expanding their IT services to build India as the hub for analytics, mobility, and social collaboration verticals across the healthcare and medical devices sector.The concept of Balanced Scorecard (BSC) is too much relevant in the present era of emerging intense global competition, where the organizations are facing increasingly knowledgeable, demanding customers and activist shareholders.This article aims to analyse opinion of
IT & ITES employees’ towards the important perspectives of
balanced scorecard (Information Technology Enabled Services) employees’, working in Coimbatore district.
Research Supervisor, Karpagam University, Coimbatore, INDIA
Keywords- BPM,Balance Score Card,.Information
technology, Information Technology Enabled Services
I.
INTRODUCTION
Information Technology/ Information Technology Enterprises (IT/ITES), is an arched type of a knowledge economy. IT firms in India, contributes around SIX per cent to nations GDP and earn around 25per cent of export revenues for the Indian economy. Unlike traditional manufacturing and service firms, these firms are characterized by low capital intensity, low Research & Development (R&D) intensity, high knowledge intensity and high human capital intensity. Thus, managing IT/ITES firm poses a gamut of challenges distinct from the challenges that the traditional Managers faced. Moreover, knowledge intensive services employ technical specialists (for example IT engineers in IT firms). Although these specialists have a technical orientation, they rarely have an orientation towards management of IT/ITES businesses.
Lack of managerial inefficiencies demands timely implantation of Balanced Score Card by the IT & ITES firms.It must be a clearly established fact that the objective of any measurement system should be to motivate all managers and employees to implement successfully the business units’ strategy. Those companies that can translate their strategy into measurement system will be able to execute their strategies more effectively because they communicate their objectives and their target groups in a meaning manner. The communication, makes managers and employees focus on the critical drivers enabling them to align investments, initiatives and actions accomplishing strategic goals. Balanced Score Card is a management concept, which can be interpreted, enacted and implemented in various ways for the successful performance of an organization as balanced score card is based on management by objective (MBO) concept. Employees’ behavioral aspects and positive attitudes toward the balanced scorecard (BSC) are very essential for the successful of implementation BSC.
II.
METHODOLOGY
12
Copyright © 2011-15. Vandana Publications. All Rights Reserved.III. OBJECTIVE AND ANALYSIS
This article will prove helpful to the IT & ITEs company’s employees, experts and research scholars in understandingIT & ITES employees’ opinion towards the important perspectives of balanced scorecard.So the primary objective of the study is as follows:
1. To analyse the IT & ITES employees’ opinion towards the important perspectives of balanced scorecard implemented in the organisation by using KMO test and Factor analysis
IV.
STATISTICAL TOOL USED
Factor analysis technique has been applied to find the underlying dimension (factors) that exists in the 64 variables relating to the IT & ITES employees’ opinion towards the important perspectives considered in the balanced scorecard of their organization In the present study, Kaiser-Meyer-Oklin (KMO) Measure of Sampling Adequacy (MSA) and Bartlett’s test of Sphericity were applied to verify the adequacy or appropriateness of data for factor analysis. In this study, the value of KMO for overall matrix was found to be excellent (0.735) and Bartlett’s test of Sphericity was highly significant (p<0.05). Bartlett’s Sphericity test was effective, as the chi-square value draws significance at five per cent level. The results thus indicated that, the sample taken was appropriate to proceed with a factor analysis procedure. Besides the Bartlett’s Test of Sphericity and the KMO Measure of sampling Adequacy, Communality values of all variables were also observed.
Table 1.1
KMO AND BARTLETT'S TEST
IT & ITES EMPLOYEES’ OPINION TOWARDS THE IMPORTANT PERSPECTIVES OF BALANCED
SCORECARD
Kaiser-Meyer-Olkin Measure of Sampling
Adequacy .735
Bartlett's Test of Sphericity Approx.
Chi-Square 11050.856
DF 2016
Sig .000
Level of Significance: 5 per cent
In order to provide a more parsimonious interpretation of the results, 64-item scale was then Factor analyzed, using the Principal Component method, with Equamax rotation. Factor analysis attempts to identify underlying variables or factors that explain the pattern of correlations within a set of observed variables. Factor analysis is often used in data reduction to identify a small number of factors that explain most of the variance
observed in a much larger number of manifest variables. In the current study, rotation factor analysis is performed to measure the IT & ITES employees’ opinion towards the important perspectives considered in the balanced scorecard of their organization is depicted in Table:1.2 to 1.4.
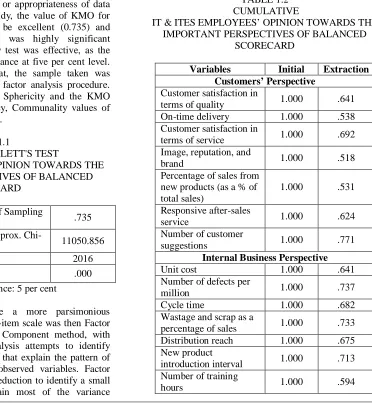
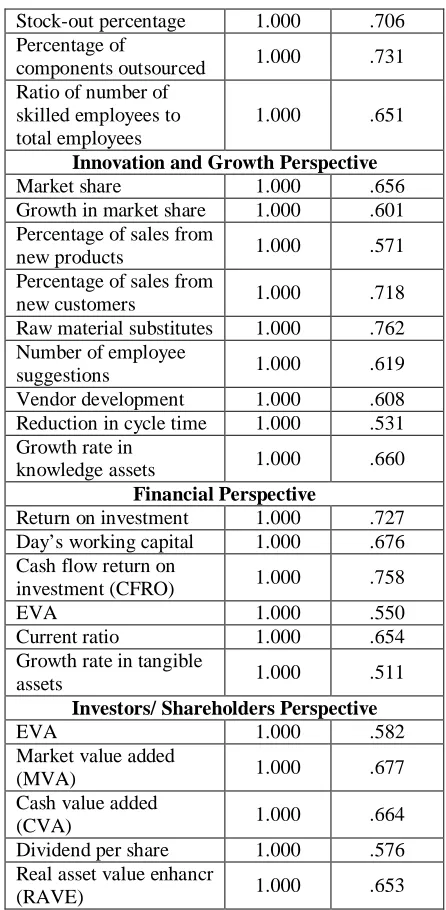
Five factors extracted together account for 69.207 per cent of the total variance (information contained in the original 64 variables). This is pretty good, because the researchers are able to economize on the number of variables (from 64 researchers have reduced them to five underlying factors), while the data lost only about 30.793 per cent of the information content (69.207 per cent is retained by the five factors extracted out of the 64 original variables). Since the idea of factor analysis is to identify the factors that meaningfully summarize the sets of closely related variables, the rotation phase of the factor analysis attempts to transfer initial matrix into one that is easier to interpret. Equamax rotation method is used to extract meaningful factors.
TABLE 1.2 CUMULATIVE
IT & ITES EMPLOYEES’ OPINION TOWARDS THE IMPORTANT PERSPECTIVES OF BALANCED
SCORECARD
Variables Initial Extraction
Customers’ Perspective
Customer satisfaction in
terms of quality 1.000 .641
On-time delivery 1.000 .538
Customer satisfaction in
terms of service 1.000 .692
Image, reputation, and
brand 1.000 .518
Percentage of sales from new products (as a % of total sales)
1.000 .531
Responsive after-sales
service 1.000 .624
Number of customer
suggestions 1.000 .771
Internal Business Perspective
Unit cost 1.000 .641
Number of defects per
million 1.000 .737
Cycle time 1.000 .682
Wastage and scrap as a
percentage of sales 1.000 .733
Distribution reach 1.000 .675
New product
introduction interval 1.000 .713
Number of training
13
Copyright © 2011-15. Vandana Publications. All Rights Reserved.Stock-out percentage 1.000 .706
Percentage of
components outsourced 1.000 .731
Ratio of number of skilled employees to total employees
1.000 .651
Innovation and Growth Perspective
Market share 1.000 .656
Growth in market share 1.000 .601
Percentage of sales from
new products 1.000 .571
Percentage of sales from
new customers 1.000 .718
Raw material substitutes 1.000 .762 Number of employee
suggestions 1.000 .619
Vendor development 1.000 .608
Reduction in cycle time 1.000 .531
Growth rate in
knowledge assets 1.000 .660
Financial Perspective
Return on investment 1.000 .727
Day’s working capital 1.000 .676
Cash flow return on
investment (CFRO) 1.000 .758
EVA 1.000 .550
Current ratio 1.000 .654
Growth rate in tangible
assets 1.000 .511
Investors/ Shareholders Perspective
EVA 1.000 .582
Market value added
(MVA) 1.000 .677
Cash value added
(CVA) 1.000 .664
Dividend per share 1.000 .576
Real asset value enhancr
(RAVE) 1.000 .653
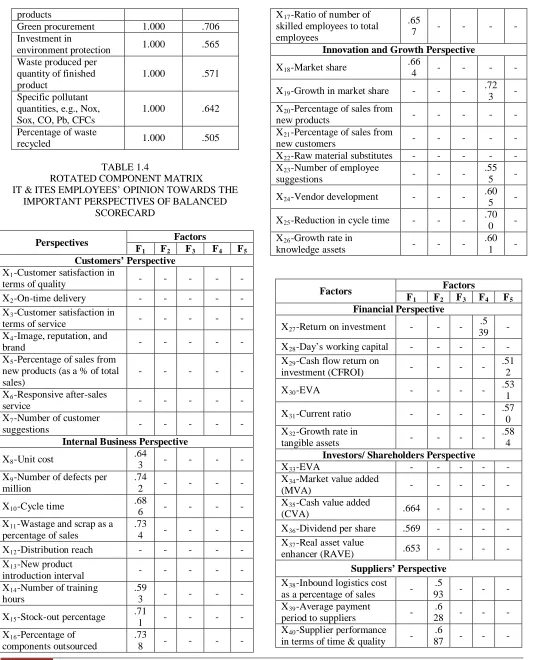
Five factors were identified as being maximum percentage variance accounted. The variable X8, X9, X10, X11, X14, X15, X16, X17, X18, X35, X36 and X37 constitute the factor I and it accounts for 17.381 per cent of the total variance. The variable X38, X39, X40, X43 and X45 constitute the factor II and it accounts for 13.855 per cent of the total variance. The variable X56, X57, X60, X61, X62, X63 and X64 constitute the factor III and it accounts for 12.958 per cent of the total variance. The variable X19, X23, X24, X25, X26 and X27 constitute the factor IV and it accounts for 12.851 per cent of the total variance. The variable X29, X30, X31, X32, X47, X48, X49 and X50 is grouped as factor V and it accounts for 12.161 per cent of the total variance.
TABLE 1.3
IT & ITES EMPLOYEES’ OPINION TOWARDS THE IMPORTANT PERSPECTIVES OF BALANCED
SCORECARD
Variables Initial Extraction
Suppliers’ Perspective
Inbound logistics cost as
a percentage of sales 1.000 .545
Average payment period
to suppliers 1.000 .609
Supplier performance in
terms of time and quality 1.000 .661
Fill rate 1.000 .785
Number of suppliers 1.000 .541
Number of duplicated
functions minimized 1.000 .623
Number of product improvements with supplier partnerships
1.000 .593
Supplier performance in terms of reduction in variance in time and quality
1.000 .535
Inventory carried (in terms of no of days & amount) by supplier
1.000 .791
Employees’ Perspective
Sales per employee 1.000 .559
Employee cost as a
percentage of sales 1.000 .515
Attrition rate 1.000 .525
Value added per
employee 1.000 .515
Competitive Perspective
Market share 1.000 .637
Company cost vis-à-vis
industry average 1.000 .697
New product
development 1.000 .798
Number of brands vis-à-vis total brands in the market
1.000 .593
Availability/development of raw material
substitutes
1.000 .569
Environmental and Social Perspective
Efficiency in material
and energy use 1.000 .566
Water/Air quality
monitoring 1.000 .585
Number of environmental incidents/accidents
1.000 .649
14
Copyright © 2011-15. Vandana Publications. All Rights Reserved.products
Green procurement 1.000 .706
Investment in
environment protection 1.000 .565
Waste produced per quantity of finished product
1.000 .571
Specific pollutant quantities, e.g., Nox, Sox, CO, Pb, CFCs
1.000 .642
Percentage of waste
recycled 1.000 .505
TABLE 1.4
ROTATED COMPONENT MATRIX IT & ITES EMPLOYEES’ OPINION TOWARDS THE
IMPORTANT PERSPECTIVES OF BALANCED SCORECARD
Perspectives Factors
F1 F2 F3 F4 F5
Customers’ Perspective
X1-Customer satisfaction in
terms of quality - - - - -
X2-On-time delivery - - - - -
X3-Customer satisfaction in
terms of service - - - - -
X4-Image, reputation, and
brand - - - - -
X5-Percentage of sales from new products (as a % of total sales)
- - - - -
X6-Responsive after-sales
service - - - - -
X7-Number of customer
suggestions - - - - -
Internal Business Perspective
X8-Unit cost .64
3 - - - -
X9-Number of defects per million
.74
2 - - - -
X10-Cycle time .68
6 - - - -
X11-Wastage and scrap as a percentage of sales
.73
4 - - - -
X12-Distribution reach - - - - -
X13-New product
introduction interval - - - - -
X14-Number of training hours
.59
3 - - - -
X15-Stock-out percentage .71
1 - - - -
X16-Percentage of components outsourced
.73
8 - - - -
X17-Ratio of number of skilled employees to total employees
.65
7 - - - -
Innovation and Growth Perspective
X18-Market share .66
4 - - - -
X19-Growth in market share - - - .72
3 -
X20-Percentage of sales from
new products - - - - -
X21-Percentage of sales from
new customers - - - - -
X22-Raw material substitutes - - - - -
X23-Number of employee
suggestions - - -
.55
5 -
X24-Vendor development - - - .60
5 -
X25-Reduction in cycle time - - - .70
0 -
X26-Growth rate in
knowledge assets - - -
.60
1 -
Factors Factors
F1 F2 F3 F4 F5
Financial Perspective
X27-Return on investment - - - .5
39 -
X28-Day’s working capital - - - - -
X29-Cash flow return on
investment (CFROI) - - - -
.51 2
X30-EVA - - - - .53
1
X31-Current ratio - - - - .57
0 X32-Growth rate in
tangible assets - - - -
.58 4
Investors/ Shareholders Perspective
X33-EVA - - - - -
X34-Market value added
(MVA) - - - - -
X35-Cash value added
(CVA) .664 - - - -
X36-Dividend per share .569 - - - -
X37-Real asset value
enhancer (RAVE) .653 - - - -
Suppliers’ Perspective
X38-Inbound logistics cost as a percentage of sales -
.5
93 - - -
X39-Average payment
period to suppliers -
.6
28 - - -
X40-Supplier performance in terms of time & quality -
.6
15
Copyright © 2011-15. Vandana Publications. All Rights Reserved.X41-Fill rate - - - -
X42-Number of suppliers - - - -
X43-Number of duplicated
functions minimized -
.6
17 - - -
X44-Number of product improvements with supplier partnerships
- - - -
X45-Supplier performance in terms of reduction in variance in time and quality
- .5
57 - - -
X46-Inventory carried (in terms of no of days & amount) by supplier
- - - - -
Employees’ Perspective
X47-Sales per employee - - - - .56
6 X48-Employee cost as a
percentage of sales - - - -
.51 6
X49-Attrition rate - - - - .54
2 X50-Value added per
employee - - - -
.54 4 Factors Factors F F
1 2 F3 F4 F5
Competitive Perspective
X51-Market share - - - - -
X52-Company cost vis-à-vis
industry average - - - - -
X53-New product development - - - - -
X54-Number of brands vis-à-vis
total brands in the market - - - - -
X55-Availability/development of
raw material substitutes - - - - -
Environmental and Social Perspective
X56-Efficiency in material and
energy use - -
.6
43 - -
X57-Water/Air quality monitoring - - .6
47 - -
X58-Number of environmental
incidents/accidents - - - - -
X59-Eco-performance of products - - - - -
X60-Green procurement - - .5
06 - -
X61-Investment in environment
protection - -
.5
82 - -
X62-Waste produced per quantity
of finished product - -
.6
53 - -
X63-Specific pollutant quantities,
e.g., Nox, Sox, CO, Pb, CFCs - - .6
53 - -
X64-Percentage of waste recycled - - .6
09 - -
Eigen value 1 1 . 1 2 4 8. 86 7 8. 29 3 8.2 25 7. 78 3
% of Variance
1 7 . 3 8 1 13 .8 55 12 .9 58 12. 851 12 .1 61 Cumulative 1 7 . 3 8 1 31 .2 36 44 .1 94 57. 046 69 .2 07
Level of Significance: 5 per cent TABLE 1.5
SUMMARY OF ROTATION FACTOR ANALYSIS AND CRONBACH ALPHA
IT & ITES EMPLOYEES’ OPINION TOWARDS THE IMPORTANT PERSPECTIVES OF BALANCED
SCORECARD
Fact ors
Variables included in the factors
Cronbach’s Alpha
F
Unit cost, Number of defects per million, Cycle time, Wastage
and scrap as a percentage of sales, Number of training hours,
Stock-out percentage, Percentage of components outsourced, Ratio of number of
skilled employees to total employees, Market share, Cash
value added (CVA), Dividend per share and Real asset value
enhancer (RAVE).
1 .870
F
Inbound logistics cost as a percentage of sales, Average payment period to suppliers, Supplier performance in terms of
time & quality, Number of duplicated functions minimized
and Supplier performance in terms of reduction in variance in
time and quality.
2 .846
F
Efficiency in material and energy use, Water/Air quality monitoring, Green procurement,
Investment in environment protection, Waste produced per
quantity of finished product, Specific pollutant quantities,
16
Copyright © 2011-15. Vandana Publications. All Rights Reserved.e.g., Nox, Sox, CO, Pb, CFCs and Percentage of waste
recycled.
F
Growth in market share, Number of employee suggestions, Vendor development, Reduction
in cycle time, Growth rate in knowledge assets and Return on
investment.
4 .787
F
Cash flow return on investment (CFROI), EVA, Current ratio, Growth rate in tangible assets, Sales per employee, Employee cost as a percentage of sales, Attrition rate and Value added
per employee.
5 .777
Factor analysis is used to find out the association between IT & ITES workers’ level of awareness towards the functioning of balances Score. The Cronbach’s reliability values (.870, .846, .815, .787 and .777) indicate significant correlation between the IT & ITES employees’ opinion towards the important perspectives, considered in the balanced scorecard of their organization..
V.
CONCLUSION
From the study it is clear that the 64 variables are reduced to five factors namely F1 to F5.
[4] Bindu Nair and DR. AshishPareek (2011), A study of the various performance management systems adopted by select Indian private sector Organizations, Volume No.2, Issue No. 6, ISSN 0976-2183, PP.43-46, June
. for example factor 1 includes Unit cost, Number of defects per million, Cycle time, Wastage and scrap as a percentage of sales, Number of training hours, Stock-out percentage, Percentage of components outsourced, Ratio of number of skilled employees to total employees, Market share, Cash value added (CVA), Dividend per share and Real asset value enhancer (RAVE ) that has the reliability value of 87%. and in the same way remaining factors have been rotated and the t & ites employees’ opinion towards the important perspectives of balanced scorecard has been studied
REFERENCES
[1] Asa Romeo Asa, NavneelShalendra Prasad, Maw MawHtay (2013), Balanced Scorecard: A Paradigm Measure Of Business Strategy and Firm Performance, International Journal of Scientific and Technology Research, Volume .2, IssueNo. 4, ISSN 2277-8616,April. [2] Ayesha Farooq and ZareenHussain (2011), Balanced Scorecard Perspective on Change and Performance: A Study of Selected Indian Companies, Journal of Global Strategic Management, IssueNo.10, PP. 27-38, December. [3] Banker, R.D., H. Chang and M.J. Pizzini, (2004), The Balanced Scorecard: Judgmental effect of performance Measures linked to Strategy, The Accounting Review, PP. 1-23.
[5] Hoque, Z. and James, W (2000),Linking Balanced Scorecard Measures to Size and Market Factors: Impact on Organizational Performance, Journal of Management Accounting Research, Volume No.12,PP. 1-17.
[6] Iqra Abdullah, Iqra Abdullah, TahiraUmair, Yahya Rashid and BasharatNaeem (2013), Developments on Balanced Scorecard: A Historical Review, World Applied Sciences Journal, Volume No.21, Issue No.1, PP.134-141, ISSN 1818-4952