Analysis
Estimates of the Genuine Progress Indicator (GPI) for Oregon from
1960
–
2010 and recommendations for a comprehensive
shareholder's report
Ida Kubiszewski
a,⁎
, Robert Costanza
a, Nicole E. Gorko
b, Michael A. Weisdorf
b, Austin W. Carnes
b,
Cathrine E. Collins
b, Carol Franco
c, Lillian R. Gehres
b, Jenna M. Knobloch
b,
Gayle E. Matson
b, Joan D. Schoepfer
baCrawford School of Public Policy, The Australian National University, Canberra, Australia b
Portland State University, Portland, OR, United States
c
Woods Hole Research Center, Falmouth, MA, United States
a b s t r a c t
a r t i c l e i n f o
Article history:
Received 28 August 2014
Received in revised form 1 August 2015 Accepted 4 August 2015
Available online xxxx
Keywords:
Gross Domestic Product (GDP) Gross State Product (GSP) Genuine Progress Indicator (GPI) Well-being
Gini coefficients Beyond GDP Oregon
The Genuine Progress Indicator (GPI) is a significantly more comprehensive approach to assessing economic progress than conventional measures, such as Gross Domestic Product (GDP). We estimated the GPI for the state of Oregon from 1960–2010. We found that it tracked the Gross State Product (GSP) for the period 1970–2000, but began to diverge andflatten out in 2000. The major reasons for this divergence were increasing inequality, loss of farmland, and decreasing personal consumption expenditures as a fraction of GSP. Oregon GPI/per capita leveled off in 2000, while the US GPI/capita leveled off in 1975. The GPI is not the perfect indicator of economic and social well-being, but it is a better approximation than GDP. As more states and countries begin to recognize the inappropriateness of GDP as a policy goal we can expect to see much more emphasis on and use of alternative indicators like GPI. We recommend extending these indicators to include a comprehensive shareholder's report that reflects all the state's capital assets, including built, human, social, and natural capital. © 2015 Elsevier B.V. All rights reserved.
1. Introduction
A reliable yardstick for evaluating the overall performance of nations, subnational regions, and the planet as a whole, is an essential tool for rational policymaking. The gross domestic product (GDP) has long been one of the most common proxies used to measure economic performance. GDP is an appropriate, though imperfect, metric to use when calculating the market value of goods and services produced within a selected geographic area during a selected interval in time (Leamer, 2009). However, it is frequently and erroneously interpreted as a measure of the social and economic welfare, or well-being, in a country. While upward GDP trends may correlate with perceived well-being for a period, the‘threshold hypothesis’suggests that there may be a point beyond which continued growth in GDP ceases to contribute to improvements in the quality of life within a society (Max-Neef, 1995; Kubiszewski et al., 2013; Costanza et al., 2014). This divergence is thought to occur because GDP was never designed to measure societal well-being and as the components it does not measure become more important, GDP becomes less useful as a proxy. The components of
GDP (consumption expenditures, capital formation, and net exports) do not include goods or services that are not bought and sold in market transactions. It also counts many market transactions as benefits, which are actually better thought of as costs. For example, although spending on security and crime prevention are costs to be minimized as they de-crease human well-being, they inde-crease GDP. Consequently, the wide-spread interpretation of GDP as a measure of economic welfare is quite problematic and produces misleading results around well-being.
A growing number of scholars, as well as policymakers, are aware that GDP growth is inappropriate as an overall national policy goal. Over several decades, economists have identified serious deficiencies in following the policy of endless growth in GDP, and have stressed the importance of using GDP only within the context of its intended, technical purpose. An extensive scientific literature drawing on insights from not only economics but also a wide array of environmental and social sciences has documented many shortcomings of GDP growth as a national policy goal (Kuznets, 1934; Nordhaus and Tobin, 1972; Daly and Cobb, 1989; Costanza et al., 2009; van den Bergh, 2009; Stiglitz et al., 2010).
The State of Oregon's commitment to alternative metrics for evaluat-ing its citizens' quality of life extends back to 1989, when the Oregon ⁎ Corresponding author.
http://dx.doi.org/10.1016/j.ecolecon.2015.08.004 0921-8009/© 2015 Elsevier B.V. All rights reserved.
Contents lists available atScienceDirect
Ecological Economics
Progress Board was created to oversee the collection and reporting of data to measure progress in categories very similar to those included in the GPI. Support for this work waxed and waned with the political tides over the next 20 years until, in 2009, funding for the Oregon Progress Board was eliminated entirely.
In the meantime, other national and sub-national governments are looking for new metrics that incorporate those goods and services that greatly influence the well-being of a population, but operate outside the confines of the market such as volunteerism, housework, inequality, and environmental degradation (Talberth et al., 2007; Wilkinson and Pickett, 2009).
Three different groups of well-being indicators exist (Costanza et al., 2014):
1. Adjustments to economic measures to reflect social and environmen-tal factors (e.g., Genuine Progress Indicator and Inclusive Wealth Index);
2. Subjective measures of well-being drawn from surveys (e.g., World Values Survey and Bhutan's Gross National Happiness);
3. Weighted composite indicators of well-being including housing, life expectancy, leisure time and democratic engagement (e.g., United Nations' Human Development Index and Happy Planet Index).
The Genuine Progress Indicator (GPI) (Cobb et al., 1995; Talberth et al., 2007), was developed as a variant of the Index of Sustainable Economic Welfare (ISEW) originally proposed by Herman Daly and John Cobb (Daly and Cobb, 1989). GPI utilizes Personal Consumption Expenditures (PCE), a major component of GDP, as a starting point, but makes adjustments based on the added values or costs associated with monetized estimates of social and environmental elements unaccounted for in the GDP. For example, various indicators of natural resource degradation are subtracted from the GDP, and the value of household labor is added to it.
The GPI has been calculated at multiple scales, from state to national to global level (Hamilton, 1999; Pulselli et al., 2006; Nourry, 2008; Wen et al., 2008). On the state level, seven states in the United States (Colorado, Hawaii, Maryland, Massachusetts, Ohio, Utah, and Vermont) have calculated their GPI (Costanza et al., 2004; Berik and Gaddis, 2011; Posner and Costanza, 2011; Bagstad and Shammin, 2012; McGuire et al., 2012; Erickson et al., 2013; Stiffler, 2014; Erickson et al., 2015), as have a few provinces in Canada (Anielski, 2001). However, as of 2014, Maryland (Posner and Costanza, 2011; McGuire et al., 2012) and Vermont (Costanza et al., 2004) were the only two states that have offi -cially adopted GPI as a tool in policy analysis and regularly report results (Bagstad et al., 2014). On the national level, the GPI has been estimated for approximately seventeen countries, including Australia, Austria, Belgium, Chile, China, Germany, India, Italy, the Netherlands, New Zealand, Poland, Sweden, Thailand, the United Kingdom, the United States, and Vietnam (Kubiszewski et al., 2013). GPI was also calculated on the global level, using the 17 countries stated above (Kubiszewski et al., 2013).
There are many issues related to using GPI, including subjectivity in distinguishing costs from benefits, subjectivity in which non-market values to include, as well as ongoing debate surrounding the methodol-ogy (Lawn, 2003; Costanza et al., 2009; Bagstad et al., 2014). There are also several key advantages to using the GPI. It is easily compared to the state GDP, and in comparing Oregon to other states and countries that already measure GPI. Additionally many other indicators, especially survey-based indicators like subjective well-being, are expensive to track over time and impossible to analyze before the year they were implemented (McGuire et al., 2012).
2. Methods
The methods employed in this analysis were adopted from the Maryland GPI report (McGuire et al., 2012) to facilitate meaningful comparison. Maryland adopted the framework provided in the national
Genuine Progress Indicator (Talberth et al., 2007), but applied specific adjustments to reflect indicators relevant to a state approach. This re-sulted in 26 indicators among three domains: Economic, Environmen-tal, and Social. The Maryland study provided methodological notes and data sources for each of their 26 indicators, which were duplicated as closely as possible in this analysis for Oregon. Where necessary data did not exist for estimating the Oregon GPI, interpolation and extrapola-tion were employed, or the equaextrapola-tions derived by the Maryland GPI group were used. Interpolation and extrapolation of data reduces the precision of some of the data. However, it allows for the completion and extension of time-series, which allows for better identification of patterns over time, a major use of GPI studies.
The calculation of GPI begins with personal consumption expendi-tures (PCE), a major component of GDP, measured in Indicator 1. Next, because unequal distribution of income has detrimental effects on economic and social welfare (Wilkinson and Pickett, 2009), income inequality in included through the use of the Gini coefficient, which measures the differences between actual distribution and equal distri-bution. By adjusting PCEfigures (Indicator 1) with the income inequal-ity (Indicator 2) we get Indicator 3: Adjusted Personal Consumption Expenditures. Indicator 3, provides the base number from which all remaining indicators of economic activity in the GPI are either added or subtracted, depending on whether they have enhancing or diminishing effects on welfare.Posner and Costanza (2011)summarizes the methodology using the following equation:
GPI¼Cad jþGndþW–D–E−N:
In this equation,“Cadj”represents personal consumption expendi-tures adjusted for income inequality (Indicator 3),“Gnd”represents non-defensive government expenditures (such as Indicator 24: Services of Highways and Streets),“W”represents non-monetized contributions to welfare (such as Indicator 17: Value of Housework), D represents defensive private expenditures (such as Indicator 20: Personal Pollution Abatement), E represents the costs of environmental degradation (such as Indicator 11: Net Wetlands Change), and N represents the deprecia-tion of natural capital stocks (such as Indicator 16: Cost of Nonrenew-able Resource Depletion).
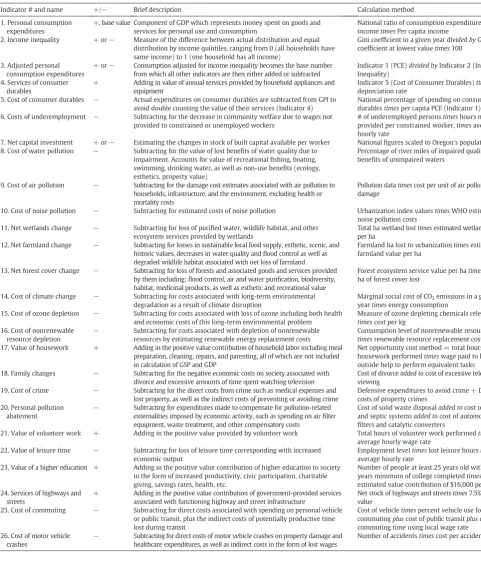
Table 1summarizes methodology used in calculating Oregon's GPI, and is closely adapted from the methodology summary table produced byPosner and Costanza (2011)in their detailed report on methodology andfindings in the Maryland GPI study.
3. Results
3.1. Status of Baseline Measurements
Fig. 1shows the basic results for Oregon GPI compared to Gross State Product (GSP) and Personal Consumption Expenditures (PCE). A spreadsheet and appendix with the full results for each component of the Oregon GPI and a sensitivity analysis is in Supplementary information.
GPI for Oregon was relativelyflat in the 1960–1970 decade, even though GSP and PCE were expanding rapidly. This was due largely to the impact on GPI of the large net loss of farmland that occurred during this period (see sensitivity discussion). From 1970 to around 2000, GPI, GSP, and PCE were highly correlated. The period from 1973–75 and 1979–1982 showed declines in GSP, probably due to the Arab oil embargos and recessions. This caused a smaller decline in PCE in the 1979–1982 recession, due to declines in government spending and net exports relative to declines in PCE. In the period from 2000 to 2010 GPI leveled off, even though GSP and PCE continued to increase. This was due in part to increasing inequality.
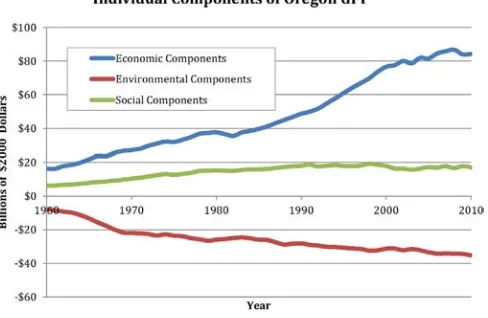
three main categories: economic, social, and environmental.Fig. 2 shows the value of the individual GPI components between 1960 and 2010 that are either added or subtracted, depending on whether they enhance or diminish the effects on welfare. Wefind that although eco-nomic indicators increase significantly, social indicators increase until about 1990 at which point theyflatten out, while environmental indica-tors decrease significantly.
3.2. Comparing Oregon's GPI with Other GPI Studies
Fig. 3shows a comparison of the GPIs per capita of the six states, in-cluding Oregon, Colorado (Stiffler, 2014), Maryland (Posner and Costanza, 2011; McGuire et al., 2012), Ohio (Bagstad and Shammin, 2012), Vermont (Costanza et al., 2004; Erickson et al., 2013), and Utah (Berik and Gaddis, 2011), for which GPI has been calculated. It also Table 1
Summary of methodology used to calculate GPI for Oregon.
Indicator # and name +/− Brief description Calculation method
1. Personal consumption expenditures
+, base value Component of GDP which represents money spent on goods and services for personal use and consumption
National ratio of consumption expenditure to incometimesPer capita income
2. Income inequality + or− Measure of the difference between actual distribution and equal distribution by income quintiles, ranging from 0 (all households have same income) to 1 (one household has all income)
Gini coefficient in a given yeardivided byGini coefficient at lowest valuetimes100
3. Adjusted personal consumption expenditures
+ or− Consumption adjusted for income inequality becomes the base number from which all other indicators are then either added or subtracted
Indicator 1 (PCE)divided byIndicator 2 (Income Inequality)
4. Services of consumer durables
+ Adding in value of annual services provided by household appliances and equipment
Indicator 5 (Cost of Consumer Durables)times
depreciation rate 5. Cost of consumer durables − Actual expenditures on consumer durables are subtracted from GPI to
avoid double counting the value of their services (Indicator 4)
National percentage of spending on consumer durablestimesper capita PCE (Indicator 1) 6. Costs of underemployment − Subtracting for the decrease in community welfare due to wages not
provided to constrained or unemployed workers
# of underemployed personstimeshours not provided per constrained worker,timesaverage hourly rate
7. Net capital investment + or− Estimating the changes in stock of built capital available per worker Nationalfigures scaled to Oregon's population 8. Cost of water pollution − Subtracting for the value of lost benefits of water quality due to
impairment. Accounts for value of recreationalfishing, boating, swimming, drinking water, as well as non-use benefits (ecology, esthetics, property value)
Percentage of river miles of impaired qualitytimes
benefits of unimpaired waters
9. Cost of air pollution − Subtracting for the damage cost estimates associated with air pollution to households, infrastructure, and the environment, excluding health or mortality costs
Pollution datatimescost per unit of air pollution damage
10. Cost of noise pollution − Subtracting for estimated costs of noise pollution Urbanization index valuestimesWHO estimate of noise pollution costs
11. Net wetlands change − Subtracting for loss of purified water, wildlife habitat, and other ecosystem services provided by wetlands
Total ha wetland losttimesestimated wetland value per ha
12. Net farmland change − Subtracting for losses in sustainable local food supply, esthetic, scenic, and historic values, decreases in water quality andflood control as well as degraded wildlife habitat associated with net loss of farmland
Farmland ha lost to urbanizationtimesestimated farmland value per ha
13. Net forest cover change − Subtracting for loss of forests and associated goods and services provided by them including:flood control, air and water purification, biodiversity, habitat, medicinal products, as well as esthetic and recreational value
Forest ecosystem service value per hatimesarea of ha of forest cover lost
14. Cost of climate change − Subtracting for costs associated with long-term environmental degradation as a result of climate disruption
Marginal social cost of CO2emissions in a given yeartimesenergy consumption
15. Cost of ozone depletion − Subtracting for costs associated with loss of ozone including both health and economic costs of this long-term environmental problem
Measure of ozone depleting chemicals released
timescost per kg 16. Cost of nonrenewable
resource depletion
− Subtracting for costs associated with depletion of nonrenewable resources by estimating renewable energy replacement costs
Consumption level of nonrenewable resources
timesrenewable resource replacement cost 17. Value of housework + Adding in the positive value contribution of household labor including meal
preparation, cleaning, repairs, and parenting, all of which are not included in calculation of GSP and GDP
Net opportunity cost method = total hours of housework performedtimeswage paid to hire outside help to perform equivalent tasks 18. Family changes − Subtracting for the negative economic costs on society associated with
divorce and excessive amounts of time spent watching television
Cost of divorceadded tocost of excessive television viewing
19. Cost of crime − Subtracting for the direct costs from crime such as medical expenses and lost property, as well as the indirect costs of preventing or avoiding crime
Defensive expenditures to avoid crime + Direct costs of property crimes
20. Personal pollution abatement
− Subtracting for expenditures made to compensate for pollution-related externalities imposed by economic activity, such as spending on airfilter equipment, waste treatment, and other compensatory costs
Cost of solid waste disposaladded tocost of sewage and septic systemsadded tocost of automotive air filters and catalytic converters
21. Value of volunteer work + Adding in the positive value provided by volunteer work Total hours of volunteer work performedtimes
average hourly wage rate 22. Value of leisure time − Subtracting for loss of leisure time corresponding with increased
economic output
Employment leveltimeslost leisure hourstimes
average hourly rate 23. Value of a higher education + Adding in the positive value contribution of higher education to society
in the form of increased productivity, civic participation, charitable giving, savings rates, health, etc.
Number of people at least 25 years old with four years minimum of college completedtimes
estimated value contribution of $16,000 per year 24. Services of highways and
streets
+ Adding in the positive value contribution of government-provided services associated with functioning highway and street infrastructure
Net stock of highways and streetstimes7.5% annual value
25. Cost of commuting − Subtracting for direct costs associated with spending on personal vehicle or public transit, plus the indirect costs of potentially productive time lost during transit
Cost of vehicletimespercent vehicle use for commutingpluscost of public transitpluscost of commuting time using local wage rate 26. Cost of motor vehicle
crashes
− Subtracting for direct costs of motor vehicle crashes on property damage and healthcare expenditures, as well as indirect costs in the form of lost wages
shows the GPI per capita for the United States as a whole.1Although GPI
estimates for these states use slightly different methods (see Table 1 in Bagstad et al. (2014)for a detailed description) these differences are not significant and do not change the pattern of the results or our conclu-sions.Fig. 3shows that Maryland and Utah have the highest GPI/capita of the six states, of around $29,000 in 2005. The other three states, (Oregon, Ohio, Vermont) have a GPI/capita of about $18,000. The US, as a whole, has a GPI/capita of just under $14,000 in 2005.
4. Discussion
Policy-makers and the general public would benefit from better tools for measuring the well-being of people and the health of the envi-ronment and natural capital. This does not mean abolishing GDP as a measure of economic activity, but rather limiting its application to the function for which it was intended. A healthy system needs to be designed in terms of human well-being outcomes, so that initiatives to reduce greenhouse gases (GHGs), abate poverty, conserve resources, or improve child health are not seen as conflicting with economic ‘progress.’For the general public, this redefinition could be achieved via a social marketing campaign—where citizens receive important in-formation from a variety of media over a focused time period with the objective of changing public perception or behavior. For legislators and policymakers, raising awareness and elucidating how various policy initiatives would affect GPI would be a critical step.
4.1. Acknowledging the Limitations of GPI
There have been several critiques of GPI (Harris, 2007; Brennan, 2008; Neumayer, 2010; Brennan, 2013) based on valuation methods, substitutability issues, choice of items to include and exclude, and the theoretical basis of the index. These critiques are discussed in more de-tail inKubiszewski et al. (2013). The key points are summarized below.
• Valuation: Certain environmental elements of GPI (e.g., cost of land degradation, lost wetlands, and long-term environmental damage) are calculated using the cumulative costs. This is done because the in-clusion of long-term loss of natural capital is critical in generating eco-nomic welfare great than what can be provided by natural capital alone (Lawn, 2005).
• Substitutability: GPI assumes substitutability in the short run, but does not confuse substitutability of current welfare benefits with the sub-stitutability of the capital that yields the welfare benefits in the
long-term. In this sense GPI is a hybrid of weak and strong sustainabil-ity assumptions. It assumes weak sustainabilsustainabil-ity in the short term (capital substitutability) but strong sustainability in the long term. In addition, GPI was never designed to be a strict measure of sustainabil-ity and needs to be supplemented by other indicators of scale, like planetary boundaries or ecological footprint.
• Choice of items to include: Any aggregate indicator requires subjective judgments about what to include or exclude. This applies equally to GDP. The elements of GPI have changed slightly over time as more re-search is done around well-being (Daly and Cobb, 1989; Kubiszewski et al., 2013; Bagstad et al., 2014). These inclusions, or their weights, may also vary between different societies, creating differences between the results. One of the reasons we decided to follow the Maryland version of GPI as closely as possible was to minimize the differences caused by these choices and allow better comparability. • Theoretical basis: GPI's theoretical basis is at least as strong as GDP, if
not stronger (Lawn, 2003). It merely tries to separate costs from ben-efits, something any accounting framework at any scale should strive for. The implementation of that theoretical basis is being improved on by the global GPI 2.0 effort (Bagstad et al., 2014).
4.2. GPI 2.0
Over the past few years, as a growing number of GPI studies have been performed globally, a divergence in methodologies has occurred. This lack of standardization is due to variations in data availability, vary-ing needs to ensure policy relevance in specific regions, and identifi ca-tion of new issues such as treatment of nonrenewable resources, government spending, and others. To address these variations, an inter-national effort has recently been initiated to update the current meth-odology of the GPI with the most up-to-date science. The goal of such an update is to ensure that GPI 2.0 has greater comparability between studies and an increased policy relevance (Bagstad et al., 2014).
4.3. Efforts in Use of Alternative Measures
Oregon's commitment to measuring its citizens' quality of life extends back to 1989, when the Oregon Progress Board was created to oversee the collection and reporting of physical data to measure progress in categories very similar to those included in the GPI.
In the meantime, other states have turned to the GPI as a tool to assist state government in identifying public policy priorities and in the application of outcomes-based budgeting. Maryland, thefirst state to adopt GPI as an official indicator and the one that has progressed fur-thest in its use, has formalized GPI calculation and reporting. Vermont, in 2013, became thefirst state to establish a system for GPI data 1
Although the state of Hawaii has also calculated its GPI, we were, at the time of this writing, unable tofind the data.
Fig. 1.Comparison of Oregon's personal consumption expenditures, gross state product, and genuine progress indicator for the years of 1960–2008.
collection by legislative mandate. Other state level organizations have also calculated GPI: the Colorado Fiscal Institute, the Utah Population and Environment Coalition, and the Hawaii Department of Health.
4.4. An Oregon Shareholder's Report
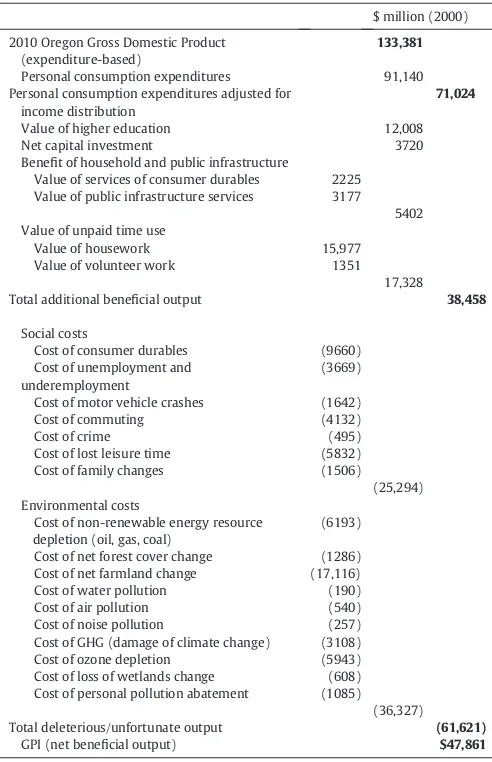
As demonstrated in previous sections, the GPI moves one step beyond Oregon's earlier benchmark categories, suggesting a“full cost”accounting system. GPI assigns monetary value toflows of natural, human, social, and built capital and their degradation or enhancement in the course of economic activity. The GPI adjusts personal consumption expenditures to account for the effect of income inequality, adding the value of Oregonians' time spent at socially enhancing unpaid work such as volunteering, and deducting“unfortunate”expenditures for social ills such as crime, and the depreciation value of natural resources. The result can be expressed as a GPI net income statement, as shown inTable 2.
The GPI Net Income Statement offers a substantially more complete accounting of Oregonians' economic activity and its impact on quality-of-life than conventional GDP-based measures of progress. But net in-come is only one part of anyfinancial report. As the shareholders and stewards of the state's natural and other resources, Oregonians would be best informed by seeing full cost accounting applied to the remaining components of a shareholders' report: a balance sheet and cashflow statement. Just as an income statement does not tell shareholders about a company's net assets or shareholder wealth, GPI does not tell us about either the quantity or quality of Oregon's stocks of natural, human, social, and built capital. Neither does it reveal anything about the state's accumulated liabilities, such as the cost of infrastructure maintenance, stores of toxic waste, or health problems caused by loss of leisure time. It is the balance sheet that signals whether an organiza-tion is either creating wealth for its shareholders by making wise investments, or endangering its future by accumulating liabilities and degrading or depreciating its capital assets.
As an example, one of the Oregon GPI indicators, Net Forest Cover Change, assumes an underlying value for the functions performed by a healthy forest ecosystem. In addition to producing marketable products such as timber, forests provide a range of valuable services, such as stor-age andfiltration of water, oxygen production, soil formation, nutrient cycling, wildlife habitat, and human recreation—to name a few that typically go unnoticed and unvalued. Unsustainable timber harvesting actually increases GDP, without accounting at all for the reduced asset value on the public balance sheet from lost forest cover. GPI is an
improvement in that it accounts for the lost forest cover, subtracting it as an“unfortunate”cost of economic activity. Similar to what Utah did Fig. 3.A comparison of the 5 states for which GPI has been calculated, including the GPI for the United States as a whole.
Table 2
Oregon GPI net income statement for 2010.
$ million (2000)
2010 Oregon Gross Domestic Product (expenditure-based)
133,381
Personal consumption expenditures 91,140 Personal consumption expenditures adjusted for
income distribution
71,024
Value of higher education 12,008
Net capital investment 3720
Benefit of household and public infrastructure
Value of services of consumer durables 2225 Value of public infrastructure services 3177
5402 Value of unpaid time use
Value of housework 15,977
Value of volunteer work 1351 17,328 Total additional beneficial output 38,458
Social costs
Cost of consumer durables (9660) Cost of unemployment and
underemployment
(3669)
Cost of motor vehicle crashes (1642)
Cost of commuting (4132)
Cost of crime (495)
Cost of lost leisure time (5832) Cost of family changes (1506)
(25,294) Environmental costs
Cost of non-renewable energy resource depletion (oil, gas, coal)
(6193)
Cost of net forest cover change (1286) Cost of net farmland change (17,116) Cost of water pollution (190) Cost of air pollution (540) Cost of noise pollution (257) Cost of GHG (damage of climate change) (3108) Cost of ozone depletion (5943) Cost of loss of wetlands change (608) Cost of personal pollution abatement (1085)
(36,327) Total deleterious/unfortunate output (61,621)
in calculating their GPI (Berik and Gaddis, 2011), the Shareholder's Report balance sheet would provide the total stock of forest cover, accounting for each year's net change as an increase or diminution of total asset value. Like any capital asset, that value would be determined by calculating the net present value of theflow of goods it will yield and the services it will perform. State funds spent to protect or restore forest cover would be characterized as investment to the extent that they increase forests' value. Without this full accounting for the stock and value of forest cover, it is difficult to evaluate thefinancial benefits of conserving vs. depleting it.
Constructing an Oregon GPI Balance Sheet will require creating a chart of accounts that includes each of the domains addressed by GPI, and taking inventory of accumulated assets and liabilities as they are found among those domains. Assigning value to multiple domains of capital, many of which are made up of non-market assets that have never been monetized, is a challenging endeavor. However, it is one that some governments and sub-national entities have begun, with pioneering methodologies. The U.K.'s Office of National Statistics re-leased an experimental estimate of its human capital stock, including a detailed methodology for valuing the productive capacity of citizens (Jones and Chiripanhura, 2010). The United Nations' System of Integrat-ed Environmental and Economic Accounts (SEEA) (United Nations, 2014) has been revised to include a framework for valuing the market and non-market goods and services provided by natural capital. The Province of Nova Scotia, Canada, has officially committed to the task of valuing natural, human, and social capital, in addition to built and financial capital, toward the goal of producing“a new form of budget estimates, a new set of accounts, and a new economic paradigm” (Pannozzo and Colman, 2009). Canada has extended its System of National Accounts to value volunteerism and the non-profit sector as an element of its social capital (Haggar-Guenette et al., 2007). Meanwhile, the most developed conceptual framework for expanded
GPI accounting has been described by the Pembina Institute for the Province of Alberta, Canada (Anielski, 2001).
The balance sheet shown inTable 3is a prototype modeled after the Alberta framework. The values, where they appear, are calculations we have performed based on data derived from our work on the GPI Income Statement.
The balance sheet prototype proposed here for GPI accounting in Oregon is an approximation in need of considerable development and refinement. Ultimately the identification of Oregon's assets—public goods, natural endowments, and accumulated commonwealth—should be informed, in part, by how Oregonians conceptualize quality of life.
Acknowledgments
This paper was one of the results of a solutions-focused course at the Portland State University. We would also like to thank former Governor Kitzhaber and former First Lady Cylvia Hayes for attending the course and their interest in the topic. Also special thanks to Sean McGuire and Lew Daly, part of the Maryland GPI Study, for their advice and continued involvement in this project.
Appendix A. Supplementary Data
Supplementary data to this article can be found online athttp://dx. doi.org/10.1016/j.ecolecon.2015.08.004.
References
Anielski, M., 2001.The Alberta GPI Blueprint. Pembina Institute for Appropriate Develop-ment, Drayton Valley, Alberta.
Bagstad, K.J., Berik, G., Gaddis, E.J.B., 2014.Methodological developments in US state-level Genuine Progress Indicators: toward GPI 2.0. Ecol. Indic. 45 (0), 474–485.
Table 3
Oregon GPI balance sheet prototype.
$ millions (2000)
Assets Liabilities
Natural capital Environmental liabilities Renewable resources Ecological footprint
Agricultural land 52,451 Industrial footprint
Forest and wilderness 9263 Toxic waste
Wetlands 8894 GHG and carbon emissions
Water Other…
Air
Other… Total environmental liabilities $–
Non-renewable resources Human liabilities (NPVP of human capital expenses)
Natural gas, minerals Time stress
Mental illness Total natural capital $70,842 Physical illness/disease
Unhealthy lifestyles Other…
Human capital Total human liabilities $–
Healthy, productive workforce
Education and knowledge Social liabilities (NPV of social capital liabilities)
Life expectancy Income–wealth inequality
Optimism Under- and unemployment
Other… Family breakdown
Other…
Total human capital $– Total social liabilities $–
Social capital Built/physical capital
Social institutions and cohesion Infrastructure liabilities
Democracy and political processes Other…
Other… Total infrastructure liabilities $–
Total social capital $–
Total liabilities Built/physical capital
Consumer durables
Household infrastructure, real estate Net worth/owners equity
Public infrastructure Common wealth –
Total built/physical capital $– Common wealth per capita $–
Bagstad, K.J., Shammin, M.R., 2012.Can the Genuine Progress Indicator better inform sus-tainable regional progress?—A case study for Northeast Ohio. Ecol. Indic. 18, 330–341. Berik, G., Gaddis, E., 2011.The Utah Genuine Progress Indicator (GPI), 1990 to 2007: A
Report to the People of Utah. Utah Population and Environment Coalition. Brennan, A.J., 2008.Theoretical foundations of sustainable economic welfare indicators—
ISEW and political economy of the disembedded system. Ecol. Econ. 67 (1), 1–19. Brennan, A.J., 2013.A critique of the perceived solid conceptual foundations of ISEW and
GPI—Irving Fisher's cognisance of human-health capital in‘net psychic income’. Ecol. Econ. 88, 159–166.
Cobb, C., Halstead, T., Rowe, J., 1995.If the GDP is up, why is America down? Atlantic Mon. 276, 59–78.
Costanza, R., Erickson, J., Fligger, K., Adams, A., Adams, C., Altschuler, B., Balter, S., Fisher, B., Hike, J., Kelly, J., Kerr, T., McCauley, M., Montone, K., Rauch, M., Schmiedeskamp, K., Saxton, D., Sparacino, L., Tusinski, W., Williams, L., 2004.Estimates of the Genuine Progress Indicator (GPI) for Vermont, Chittenden County and Burlington, from 1950 to 2000. Ecol. Econ. 51 (1–2), 139–155.
Costanza, R., Hart, M., Posner, S., Talberth, J., 2009.Beyond GDP: The Need for New Measures of Progress. Frederick S. Pardee Center for the Study of the Longer-Range Future, Boston, MA.
Costanza, R., Kubiszewski, I., Giovannini, E., Lovins, H., McGlade, J., Pickett, K.E., Ragnarsdóttir, K.V., Roberts, D., Vogli, R.D., Wilkinson, R., 2014.Time to leave GDP behind. Nature 505 (7483), 283–285.
Daly, H.E., Cobb Jr., J.B., 1989.For the Common Good: Redirecting the Economy Toward Community, the Environment, and a Sustainable Future. Beacon Press, Boston. Erickson, J.D., Zencey, E., Burke, M.J., Carlson, S., Zimmerman, Z., 2013.Vermont Genuine
Progress Indicator, 1960–2011: Findings and Recommendations. Gund Institute for Ecological Economics, Burlington, VT.
Erickson, J.D., Zencey, E., Zimmerman, Z., 2015.The Bay State's Genuine Economy: A Re-port on the Massachusetts Genuine Progress Indicator 1960–2012. Gund Institute for Ecological Economics, University of Vermont, Burlington, Vermont.
Haggar-Guenette, C., Hamdad, M., Laronde-Jones, D., Pan, T., Yu, M., 2007.Satellite Account of Non-profit Institutions and Volunteering. Statistics Canada, Ottawa. Hamilton, C., 1999.The Genuine Progress Indicator methodological developments and
results from Australia. Ecol. Econ. 30 (1), 13–28.
Harris, M., 2007.On income, sustainability and the‘microfoundations’of the Genuine Progress Indicator. Int. J. Environ. Work. Employ. 3 (2), 119–131.
Jones, R., Chiripanhura, B., 2010.Measuring the UK's Human Capital Stock. Office for National Statistics, London, UK.
Kubiszewski, I., Costanza, R., Franco, C., Lawn, P., Talberth, J., Jackson, T., Aylmer, C., 2013. Beyond GDP: measuring and achieving global genuine progress. Ecol. Econ. 93, 57–68. Kuznets, S., 1934.National Income, 1929–1932. US Government Printing Office,
Washington, DC.
Lawn, P.A., 2003.A theoretical foundation to support the Index of Sustainable Economic Welfare (ISEW), Genuine Progress Indicator (GPI), and other related indexes. Ecol. Econ. 44 (1), 105–118.
Lawn, P.A., 2005.An assessment of the valuation methods used to calculate the Index of Sustainable Economic Welfare (ISEW), Genuine Progress Indicator (GPI), and Sustainable Net Benefit Index (SNBI). Environ. Dev. Sustain. 7 (2), 185–208. Leamer, E.E., 2009.Gross domestic product. Macroeconomic Patterns and Storiespp. 19–38. Max-Neef, M., 1995.Economic growth and quality of life: a threshold hypothesis. Ecol.
Econ. 15 (2), 115–118.
McGuire, S., Posner, S., Haake, H., 2012.Measuring prosperity: Maryland's Genuine Progress Indicator. Solutions 3 (2), 50–58.
Neumayer, E., 2010.Weak Versus Strong Sustainability: Exploring the Limits of Two Opposing Paradigms. Edward Elgar, Cheltenham.
Nordhaus, W., Tobin, J., 1972.Is Growth Obsolete? Economic Growth. Columbia University Press, New York.
Nourry, M., 2008.Measuring sustainable development: some empirical evidence for France from eight alternative indicators. Ecol. Econ. 67 (3), 441–456.
Pannozzo, L., Colman, R., 2009.New Policy Directions for Nova Scotia: Using the Genuine Progress Index to Count What Matters. GPI Atlantic, Nova Scotia.
Posner, S.M., Costanza, R., 2011.A summary of ISEW and GPI studies at multiple scales and new estimates for Baltimore City, Baltimore County, and the State of Maryland. Ecol. Econ. 70 (11), 1972–1980.
Pulselli, F.M., Ciampalini, F., Tiezzi, E., Zappia, C., 2006.The Index of Sustainable Economic Welfare (ISEW) for a local authority: a case study in Italy. Ecol. Econ. 60 (1), 271–281. Stiffler, C., 2014.Colorado's Genuine Progress Indicator (GPI): A Comprehensive Metric of
Economic Well-being in Colorado From 1960–2011. Colorado Fiscal Institute. Stiglitz, J.E., Sen, A., Fitoussi, J.P., 2010.Mismeasuring our Lives: Why GDP Doesn't Add Up.
The New Press, New York.
Talberth, J., Cobb, C., Slattery, N., 2007.The Genuine Progress Indicator 2006: A Tool for Sustainable Development. Redefining Progress, Oakland, CA.
United Nations, 2014.System of Environmental–Economic Accounting 2012: Experimen-tal Ecosystem Accounting. United Nations, New York.
van den Bergh, J.C.J.M., 2009.The GDP paradox. J. Econ. Psychol. 30, 117–135. Wen, Z., Yang, Y., Lawn, P.A., 2008.From GDP to GPI: quantifying thirty-five years of
development in China. In: Lawn, P.A., Clarke, M. (Eds.), Sustainable Welfare in the Asia-Pacific: Studies Using the Genuine Progress Indicator. Edward Elgar Publishing, Cheltenham, UK, pp. 228–259.