An Improved Approach for Intrusion Detection
in Network Datasets Using Artificial
Intelligence Techniques
Ms. Krupa Bhavsar
1,
Dr. Jigar Patel
21Assistant Professor, DCS, Ganpat University 2
Associate Professor, KIRC - MCA Dept., Kalol
ABSTRACT
The communication has shifted from the wired to wireless way of communication. This change makes us more prone to data leak. So to stop anything like data leak to happen in our system we need an intrusion detection device (IDS). IDS can be network based or they can be host based. Every result provided by IDS is not authentic so to minimize the probability of the false intrusion detection we need some techniques. In this paper we will discuss and compare Naïve Bayes, KNN and Firefly techniques.
INTRODUCTION
Intrusion detection system is a software application or a hardware device checks the system for any malicious activity. There are multiple types of IDS available. IDS can external as well as internal intrusions whereas firewall detects only the external intrusion.
Following are the limitations of IDS:
a. DNS message fails because of the noise and the bad packets and a high false alarm rate can be triggered by the local packets.
b. The false alarm rates are higher than the real attack. Sometimes the real attacks are so low that the real attacks are missed by the IDS.
c. A update information should be present if the signatures and versions are constantly changing, otherwise false alarm can be generated due to old signatures.
d. For signature based IDS, the IDS will take it non-malicious till the signature of the applicant is found malicious. e. If the packet received by the IDS is encrypted then it is termed as save and it can lead to intrusion.
f. One of the most important problem is masking of the address, since the address mentioned could be fake.
Therefore, we need better IDS to minimize the real intrusions. The IDS is divided into two approaches as follows:
12. Anomaly Detection:
The anomaly in this method is detected by the behavior of the user. The user has certain profile with limited access and use. If the IDS detect a different behavior such as breaking of limitation or extended use, it is then referred as intrusion. IDES and NIDES are based on this approach.
2. Misuse Detection:
LITERATURE REVIEW Naïve Bayes
This graphical method is most widely used in the Bayesian networks because it can handle uncertain information. There two components of Bayesian network. They are as follows:
1. Graphical Component
A graphical components consist of a directed acyclic graph. Here the events are represented by the vertices and their relation is represented by the edges.
2. Numerical Components
A numerical component shows conditional probability distribution of different nodes with respect to its parents in the DAG.
A Naïve Bayesian is composed a DAG graph with only one parent, it is a very simple for of the Bayesian network. The unobserved node is represented by the parent node and there are multiple child nodes termed as observed nodes. This is based on the strong assumption of independence among child nodes with their parents. Naïve Bayesian networks helps with this classification problem. Here, parent node is a hidden variable and child nodes shows different attributes of the node object.
Therefore when the system is in training mode, in the presence of set we should only compute the conditional probabilities because each structure set is unique.
The computation can summarized as:
a. The conditional probabilities are to be calculated for the discrete attributes. It is calculated from the frequency of occurrence of each attribute valve pairs with each value of parent node.
b. In the graph, the continuous attributes are assumed to have a normal/Gaussian probability distribution. Therefore the values should be same throughout.
In the Naïve Bayesian IDS, firstly the prior probability for the given intrusion detection dataset i.e. KDD99 cup dataset has to be found out. Then the class conditional probability is taken out for the data set. Now we can find the higher classifier probabilities since we have the prior and the conditional probabilities and on this base we will find detection rate and the false positive intrusion data set.
The prior probability is the number of occurrence in each class dataset. The class conditional is calculated by the frequency of occurrence of each attribute value in the class in dataset D.
Procedure: Decision Tree Input: Dataset D
Output: DA, FP For Attack Data Do
Take the Class CL From D. For each attribute value
Remove the noise from the dataset.
Calculate the prior probability P(Cj) for each class Cj in dataset.
End For
For each attribute value
End For End Do Do
Multiply the prior probability and class conditional probability. End Do
Do
Consider the class with the highest classifier probability. End Do
Repeat steps 2to4 until all attribute at their highest probability.
(K- Nearest Neighbor)
This is another false alarm technique which is based on the learning by the analog. The given test tuple is compared with the training tuples and they are found out to be the same, the system is trained by using these.
Each tuple represents a point in the n-dimensional space since training tuples have n attributes. In this way the dimensional space stores all the training tuples. When an unknown tuple is passed in the dimensional space, the KNN classifier searches the tuples similar to the input tuple through their dimensional space pattern. Therefore these similar k-number of tuples are called as k-nearest neighbors of the unknown tuple.
The Euclidean distance between the two tuples i.e. X1=(x11, x12,…, x1n) and X2=(x21, x22,…, x2n) can be found out by the following equation:
The distance between the new sample and all the previous sample are computed by the k-NN algorithm.
It helps to select the k sample with the smallest distance value and to sort the distance in the increasing order.
The largest clusters out of all the k-selected samples adds the new sample.
The KNN algorithm has considerable better performance. Therefore the computational cost can be reduced. The saples or the tuples can get eliminated automatically because it has a intelligent system. But this removal does not result in to less number of tests or the smaller decision area.
Firefly
This is a hybrid algorithm and it is very durable in finding the problems with optimization. The flashing lights of the fireflies inspire this n nature algorithm. This algorithm is based on the real life characteristics of the real fireflies. The algorithm have three rules, they are as follows:
a. All the fire flies are the same and they follow the most attractive and the brighter one.
b. The degree of attractiveness is directly proportional to its brightness which decreases as the distance increases.
c. The firefly will move randomly if there is no brighter or more attractive firefly than this one.
To find the efficient optimal solution, consider the flashing light is associated with the fitness function, this is in relation with the optimization technique. In fireflies to find the solution, we have to use the attractiveness, oveent and distance. They can be defined as follows:
i. Attractiveness
Where, r is the gap between two fireflies.β is the attractiveness when the distance r = 0.
Γ is the absorption coefficient which controls the intensity of the light.
ii. Distance
The distance between two fireflies can be defined as a Cartesian. It is i and j at positions xi and xj.
Where xi,k, is the Kth component of the spatial coordinate and d is the number of dimensions we have, for d=2 , we
have
However, the distance r can be found out by other distance metrics such as the manhattan distance.
iii. Movement
The movement of the firefly I which is attracted to a more attractive firefly j can be traced by the following formula:
Where the first term signifies the current position of the firefly, the second term gives the attractiveness of a firefly to light intensity by the adjacent fireflies and third term gives the random movement of the fireflies when there are no brighter ones. The coefficient α is a parameter of randomization which is determined by the problem of interest.
IMPLEMENTATION
Naïve Bayes
Many machine-learning and data mining methods are based on Naïve Bayes rule. This algorithm creates models having predictive capabilities. Also it gives a new direction of exploring and understanding data. When the data is high and the attributes are independent of each other, then Naïve bayes classifier is used. This algorithm models normal and suspicious network activity. The Naïve bayes classifier is largely based off of bayes theorem,
The probability of an attack can be calculated by calculating the probability of the same attack in some previous data and then multiplying this probability with the frequency of this attack.
A UDP attack is also a denial-of-service attack, it is initiated by sending a large number of UDP packets to random ports on a remote host.
A TCP data flood is also a denial-of-service attack in which an attacker sends TCP data as fast as the air interface will allow.
The generation of normal connections is simulated by daily user behavior.
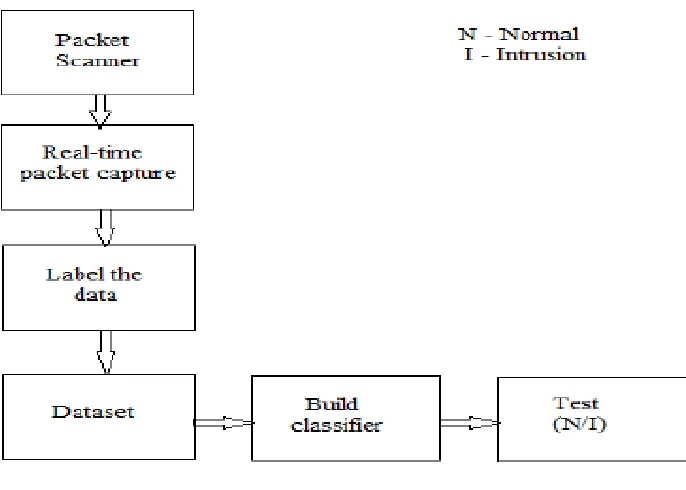
Figure 1 shows the proposed framework of network intrusion detection system. Firstly, the packets are scanned from the network traffic. The real time packets are captured and labeled in order to create training dataset. The classifier model is built on training dataset and finally the Naïve bayes classifier is used on real time data to detect the given packet is NORMAL or INTRUSION.
K-Nearest Neighbor
The k-Nearest Neighbor classifier was applied to the 1998 DARPA data. The 1998 DARPA Intrusion Detection System Evaluation program provides a large sample of computer attacks embedded in normal background traffic. To simulate the network traffic of an Air Force Local Network, the TCPDUMP and BSM audit data were collected on simulation network. It consists of training data of seven weeks and testing data of two weeks. In the midst of normal background data 38 types of network based attacks and several realistic intrusion scenarios were conducted.
A victim solaris machine placed inside the simulation network gives the Basic Security module (BSM) audit data. This data contains information on system call produced which is running on the solaris machine. We record only the names of the system records whereas other information of BSM events such as arguments to the system call, ob path, return value, etc is not used.
The DARPA data is labeled with session numbers. Each session corresponds to TCP/IP connection between two computers. For the solaris machine, about 500 sessions were recorded by the BSM tool.
During the execution of the process the number of occurrence of system calls were recorded. Then the process is transformed into a vector by text weighing techniques.
During offline data analysis, preselection of processes is conducted. The ones with the execve system calls are only chosen. This is an effective way of separating the user level processes and the kernel level processes in the voluminous BSM logs. Other trivial processes such as date, sleep and ps are skipped because they are not relevant to attack. The number of processes after preselection in one simulation day is 2400-4000 approximately.
Fire Fly
In this section, the proposed anomaly detection system is discussed. It is based on the Firefly Harmonic Clustering Algorithm (FHCA). It clusters the Digital Signature of Network Segment (DSNS) data and the network traffic samples. The alarm system generator classifies the intervals.
A. Firefly Harmonic Clustering Algorithm
B. Alarm System Generator
After the centroids are defined, the intervals are classified into normal or anomalous. The steps steps are described in algorithm 4.
The distance between the samples and the centroids generated by FHCA is calculated and parameters Dd and Dt is
derived. The highest value is returned by the operator max.
The percentage of acceptable points to exceed the distances difference inside the analyzed interval is given by the parameter ^. The number of anomaly points increases as we increase ^. The labeled intervals are then generated by the alarm system, which is compared to the generated template.
RESULT:
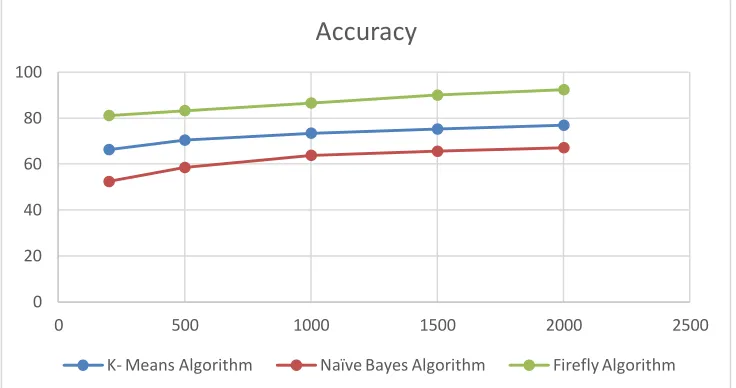
Table 1: Accuracy Of the algorithms No. Of
Inputs
K- Means Algorithm
Naïve Bayes Algorithm
Firefly Algorithm
200 66.287 52.368 81.128
500 70.415 58.485 83.262
1000 73.446 63.789 86.566
1500 75.235 65.552 89.989
2000 76.895 67.123 92.368
Graph 1: Accuracy of the Algorithms
The above graphs shows the accuracy of the algorithms. As shown the accuracy of the firefly is the highest
Table 2: Delay of the algorithm (in ms) No. Of
inputs
K-means Algorithm
Naïve Bayes Algorithm
Firefly Algorithm
200 86.56 55.63 62.54
500 91.12 59.91 63.86
1000 93.26 62.36 68.21
1500 95.56 64.97 69.51
2000 96.23 66.32 71.28
In the above table we can observe that the k-means algorithm has the highest delay amongst the three algorithm implemented. Secondly the Naïve- Bayes is amongst the least delay taking algorithm and lastly the values of firefly algorithm are of mid ranges. The Graph is shown below.
Graph 2: Delay for processing data 0
20 40 60 80 100
0 500 1000 1500 2000 2500
Accuracy
K- Means Algorithm Naïve Bayes Algorithm Firefly Algorithm
0 20 40 60 80 100 120
0 500 1000 1500 2000 2500
Delay Required
The above graphs shows the delay of the algorithms. As shown the delay of the k-means is the highest and Naïve – Bayes has the lowest delay time. The above two tables and graphs shows that Firefly is the best algorithm as it has highest accuracy and medium delay. Whereas the Naïve – Bayes is fast but not accurate and K-means is neither fast nor accurate.
CONCLUSION
As per our problem statement every result provided by IDS is not authentic so to minimize the probability of the false intrusion detection we need some techniques, here we compared three techniques namely k-means, naïve-bayes and firefly. Amongst the three the most efficient to implement is the firefly, as in the firefly technique the accuracy of the IDS are more appropriate that is it has the highest accuracy and the delay or the processing time is neither high nor low. It has a medium processing time. Therefore firefly is the best algorithm to implement amongst them for IDS.
REFERENCES
[1]. “Naive Bayesian Networks in Intrusion Detection Systems” by Nahla Ben Amor, Salem Benferhat and Zied Elouedi. [2]. “Enhanced Naïve Bayes Algorithm for Intrusion Detection in Data Mining” by Shyara Taruna R. and Mrs. Saroj Hiranwal
in IJCSIT
[3]. “Comparison of Classification Methods Based on the Type of Attributes and Sample Size” by Reza Entezari-Maleki, Arash Rezaei, and Behrouz Minaei-Bidgoli
[4]. “Intrusion Detection Using Naïve Bayes For Real Time Data” by Shubhangi S. Gujar and B. M. Patil [5]. “Using K-Nearest Neighbour Classifier for intusion detection” by Yihun Liao, V. Rao Vemuri