DOI: 10.7324/JAPS.2018.8708 ISSN 2231-3354
© 2018 Angeliny Tamiarana Lima Tabosa et al. This is an open access article distributed under the terms of the Creative Commons Attribution License -NonCom-mercial-ShareAlikeUnported License (http://creativecommons.org/licenses/by-nc-sa/3.0/).
*Corresponding Author
Mauro Aparecido de Sousa Xavier, Universidade Estadual de Montes Claros – Unimontes, Campus Darcy Ribeiro – Avenida Rui Braga s/n. Pós-Graduação em Biotecnologia – Prédio 7 – Sala 201, Montes Claros – MG, CEP: 39401-089. Brazil.
E-mail: mauro.xavier @ unimontes.br
Reliability of Analytical Methods for Recombinant Human Insulin
Quantification in the Bulk Crystals and in-Process Control
Angeliny Tamiarana Lima Tabosa1, Heloísa Ribeiro Tunes de Sousa2, Mauro Aparecido de Sousa Xavier1*,
Elio Gomes Fernandes2, Alessandra Rejane Ericsson de Oliveira Xavier1, Luciano Vilela2, Janete Maria da Silva Alves1
1Post Graduation in Biotechnology – State University of Montes Claros (Unimontes), Campus of Darcy Ribeiro, Montes Claros – MG, 39401-089, Brazil. 2Biomm S/A - Avenida Regent, 705, Nova Lima – MG, 34018-080, Brazil.
ARTICLE INFO ABSTRACT
Article history: Received on: 20/03/2018 Accepted on: 16/06/2018 Available online: 30/07/2018
The aim of this study was to demonstrate the reliability of the protein determination methods used in the process of recombinant human insulin development before its scale up. The total protein content was measured by Bradford,
molar extinction coefficient, and dry weight methods. The standards were analyzed using Mono-Q, Aquapore RP300, and Kromasil columns to calculate the concentrations of the proteins using the theoretical extinction coefficient and peak area. The following highly purified standards were used: batches B4-258 and QS009-010 of the sulfonated fusion
protein; batches B4-267, B4-268, RALF-018, HGUT-042, HGUT-043, and HGUT-045 of the renatured fusion protein; the United States Pharmacopeia reference; and batch B4-253 of bulk insulin crystals. The results were analyzed using ANOVA or Student’s t-test at 95% significance. The Bradford method showed up to 60% variation for all evaluated
standards, while the remaining two methods were consistent with each other. The chromatographic parameters were used to validate the analytical methods, and all results met the current guidelines of Brazilian regulatory agencies. The
use of quality parameters and the statistical evaluation of the data demonstrated that analytical methods used in the in-process control are suitable for the intended purpose, which certifies the reliability of the generated data.
Key words:
Scale up, Bradford, molar
extinction coefficient, dry
weight, chromatograph.
INTRODUCTION
The hormone insulin has been prescribed in the treatment of diabetes mellitus since it was discovered in 1922 (Karamitsos, 2011), and it became one of the most important products in the biopharmaceutical industry. With the discovery of and the advances in the technology of recombinant DNA in the 1970s,
insulin was the first product that was developed and produced
by recombinant DNA technology and approved by the Food and Drug Administration (FDA), allowing great advances in medicine as well as in the biopharmaceutical industry (Astolfi-Filho et al., 2004; Baeshen et al., 2014; Hwang et al., 2016; Polez et al., 2016;
Mikiewicz et al., 2017).
Biomm S/A is a biopharmaceutical company holding the patent (Astolfi-Filho et al., 2004) for an advanced technology platform for the production of recombinant human insulin crystals and other E. coli-derived products, issued in Brazil and in several countries in Europe, North America, and Asia (Ferrer et al., 2004). The technology for producing recombinant human insulin crystals
can be used on an industrial scale, with quality standards that meet the requirements of the World Health Organization (WHO) and
FDA.
During the manufacturing of biological products, great amounts of data are recorded to assess all factors involved in the manufacturing process, including the Process Analytical Technology (PAT) initiatives. In the development phase of a biopharmaceutical process, it is essential to check each stage
and characterize the intermediate and final products, and this is possible only with appropriate and defined analytical methods
(Valentini et al., 2007) and the corresponding standards. However,
of biopharmaceuticals produced by recombinant DNA technology (O’Keefe, 2000).
According to Moretto and Shib (2000), the quality of
analytical data is a key factor in the success of a biopharmaceutical product development program, and the development and validation
of analytical methods have a direct impact on the quality of the
obtained data. To ensure the functionality of the method and
the reliability of the generated data, an assessment of quality
parameters must be made through appropriate statistical analysis,
thus defining the acceptance criteria for each method (Moretto and Shib, 2000; Colomé et al., 2017).
Therefore, strict control of analytical methods used in
different stages of the process is necessary to evaluate whether
the data are reliable, conclusive, and concrete, to ensure the statistical process control, and to ensure that the intermediate and
final products are in accordance with the defined specifications
(International Conference On Harmonization - ICH, 1996; Colomé
et al., 2017). Hence, the objective of this study was to determine
whether the methods used for insulin quantification are reliable
and whether they can be used for in-process control and analysis of insulin bulk crystals during commercial-scale production.
MATERIALS AND METHODS
Insulin production process
This study was developed at Biomm S/A, Brazil. The recombinant human insulin was obtained by a fermentation process using Escherichia coli K12 strain N4830-1 (Astolfi-Filho
et al., 2004). Briefly, the proinsulin fusion protein was produced
intracellularly as insoluble aggregates, i.e., inclusion bodies (IBs), and released by homogenization in a high-pressure homogenizer. The homogenate was centrifuged, and the IBs were solubilized
by addition of 8 M urea, sodium sulfite, and sodium tetrathionate. The solubilized and sulfonated fusion protein (SFP) was purified
by chromatography, folded, and the renatured fusion protein (RFP) was separated from the non-folded protein aggregates by
precipitation, followed by a tangential filtration step. The RFP was
converted into insulin by an enzymatic process using trypsin and carboxypeptidase B. The recombinant human insulin (rHI) was
purified by ion exchange chromatography and high-performance liquid chromatography (HPLC) and finally crystallized to obtain recombinant human insulin crystals (rHI-C). The highly purified
internal standard samples used in the experiments were: batches
B4-258 (aqueous solution) and QS009/010 (lyophilized) of the SFP; batches B4-267 and B4-268 (aqueous solution) and batches
RALF-018, HGUT-042, HGUT-043, and HGUT-045 (lyophilized) of RFP; batch 1F270 of the USP reference standard (26.6 insulin units/mg); and batch B4-253 of the bulk insulin crystal.
Analytical methodology for determination of total protein Three different methods were used for total protein
determination: (1) Bradford method, using Coomassie Brilliant Blue G-250 and measurement at a wavelength of 595 nm (Bradford, 1976); (2) determination of the molar extinction coefficient and
ultraviolet absorption of proteins (Stoscheck, 1990; Pace et al., 1995) and (3) determination of dry weight (Nozaki, 1986). The internal standards SFP, RFP, and rHI-C and the USP reference standard (sHI) were characterized by chromatographic analyses
(Moussa et al., 2010).
For the Bradford method, bovine serum albumin (BSA) was used as a standard, and it was diluted in 5 M guanidine chloride. The total protein content was calculated using a reference curve with standard concentrations of BSA of 0.1–0.3 mg/mL.
The theoretical extinction coefficient (ε) values for the
SFP and RFP, using their amino acid composition, were obtained using the ProtParam tool at the ExPasy bioinformatics search portal (www.expasy.org/ProtoParam/). The experimental extinction
coefficients were calculated from the absorbance of RFP, batch B4-267, diluted in three different diluents (0.2 M acetic acid, 8 M
urea, or acetonitrile) at 280 nm (A280 nm). The sHI and rHI-C were diluted in 0.2 M acetic acid, and their absorbance was measured at 276 nm (A276 nm) to obtain the experimental extinction coefficients.
The total protein concentration of each sample and reference was calculated from the value of absorbance according to the
Lambert-Beer law (Eq. 1). The total protein content in sHI and rHI-C was calculated using the experimental extinction coefficient of 1.068
at 276 nm (Correia et al., 2012). All absorbances were measured using the Ultrospec 2100 UV-Visible spectrophotometer (GE Healthcare, Uppsala, Sweden)
c = A/(d × ε), (Eq. 1)
where c = total protein (g/L), A = absorbance value, ε0.1% =
extinc-tion coefficient (mg−1 cm−1), and d = optical path (cm).
The highly purified and lyophilized RFP standards were used for total protein quantification by the dry weight method, as
described by Nozaki (Nozaki, 1986). Briefly, the samples were
weighed in triplicate and oven dried at 80°C for a period of
12–14 h and the moisture content was calculated as the difference
between the weights before and after drying.
The protein quantification of the SFP or RFP was performed using the theoretical extinction coefficient and the
integrated peak areas obtained by the UNICORN Manager 5.31
software according to the equation:
c = (A)/(d × 1000 × ε), (Eq. 2)
where c = concentration (mg/mL), A = area (mAU × mL) × peak volume for SFP or area (mAU × mL) for RFP, d = optical path
(cm), and ε0.1% = theoretical extinction coefficient (mg−1cm−1).
Once the internal standards (SFP, RFP, and rHI-C) were well-characterized, a curve was plotted using chromatogram peak
areas against the amounts of specific proteins or total proteins (calculated from the theoretical extinction coefficient), and the
conversion factor (the curve slope) was used to calculate the
specific protein concentrations in the samples.
Sulfonated fusion protein chromatography
The SFP was analyzed using a chromatographic ion
exchange column (Mono-Q 5/50 GL Tricorn®; GE Healthcare).
The gradient, the flowrate of 1 mL/min, and the A280 nm of the
eluted protein were controlled by the AKTA Purifier system (GE Healthcare). The column was previously equilibrated with 20 mM
Renatured fusion protein chromatography
The RFP was analyzed using a Brownlee Aquapore
RP-300 (7 µm, C8, 4.6 × 250 mm) chromatographic reversed-phase column (PerkinElmer, Waltham, MA, USA). The gradient,
the flowrate of 1 mL/min, and the A214 nm of the eluted protein were controlled by the AKTA Basic system with an auto-sampler. The
column was previously equilibrated with 0.2 M sodium sulfate buffer, pH 2.3, and elution was carried out on an acetonitrile
gradient (0.2 M sodium sulfate and 50% acetonitrile, pH 2.3) of 20–36%. The peak integration and data evaluation were performed using the UNICORN Manager 5.31 software.
Human insulin chromatography
rHI was analyzed using a Kromasil 100-3 (3.5 µm, C4, 4.6 × 150 mm) reversed-phase column (AkzoNobel, Bohus,
Sweden). The gradient, the flowrate of 1 mL/min, and the A220 nm
of the eluted protein were controlled by the AKTA Basic system
with an auto-sampler. The column was previously equilibrated with 0.05 M sodium phosphate buffer, 0.01 M sodium perchlorate,
and 30% acetonitrile, pH 2.5, and elution was carried out in an acetonitrile gradient (0.05 M monosodium phosphate, 0.1 M sodium perchlorate, and 50% acetonitrile, pH 2.5) of 35.2–38.6%.
The peak integration and data evaluation were performed using the UNICORN Manager 5.31 software.
Evaluation of analytical methods
The linearity and the working range of each analytical
method were obtained by analyzing at least five different
concentrations of each sample. The repeatability was assessed in triplicate using the minimum, medium, and maximum concentrations from the previously established working range. The intermediate precision was evaluated by analyzing the samples in triplicate after four days of storage at 5 ± 3°C. The sHI, containing 26.6 insulin units/mg, which corresponds to 0.0347 mg of insulin per unit, was used for human insulin analyses.
Statistical analyses
Statistical analyses were performed using the Minitab software, version 16. The comparison between the protein
quantification methods (Bradford, molar extinction coefficient,
and dry weight) was made using ANOVA and Student’s t-test for comparing 2 methods. The repeatability and intermediate precision analyses were evaluated for the variable peak area (mAU × mL) using ANOVA. All statistical analyses considered 95% as the level
of significance.
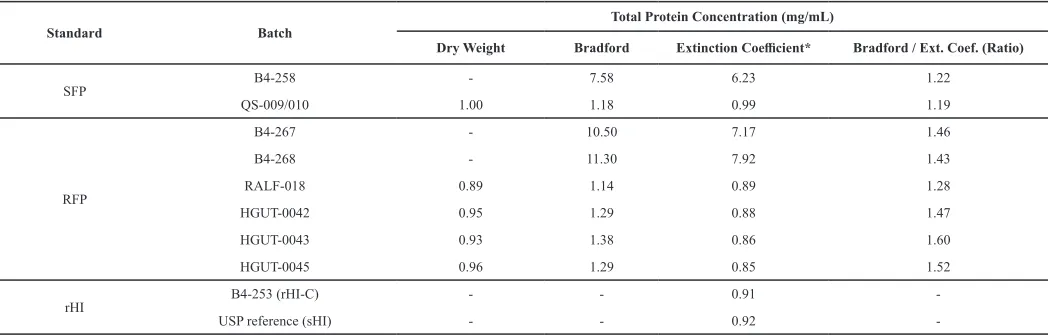
Table 1: Total protein determination (in mg/mL) of SFP, RFP, sHI, and rHI-C reference samples by dry weight, Bradford, and extinction coefficient methods.
Standard Batch Total Protein Concentration (mg/mL)
Dry Weight Bradford Extinction Coefficient* Bradford / Ext. Coef. (Ratio)
SFP B4-258 - 7.58 6.23 1.22
QS-009/010 1.00 1.18 0.99 1.19
RFP
B4-267 - 10.50 7.17 1.46
B4-268 - 11.30 7.92 1.43
RALF-018 0.89 1.14 0.89 1.28
HGUT-0042 0.95 1.29 0.88 1.47
HGUT-0043 0.93 1.38 0.86 1.60
HGUT-0045 0.96 1.29 0.85 1.52
rHI B4-253 (rHI-C) - - 0.91
-USP reference (sHI) - - 0.92
-*Theoretical extinction coefficient value obtained using the ProtParam tool.
RESULTS AND DISCUSSION Total protein quantification
The theoretical extinction coefficients for the SFP and
RFP, calculated by amino acid composition and assuming all cysteine residues form cysteines in the RFP, were 0.528 and 0.589 mg−1cm−1, respectively. The total protein content was calculated
using the theoretical extinction coefficient. The values obtained
by the Bradford method and dry weight are shown in Table 1.
According to the different methods of total protein determination,
the Bradford method tended to overestimate the total protein amount in the sample, while the results obtained by the dry weight
and extinction coefficient methods were comparable (Table 1); this comparability was observed by Nozaki as well (Nozaki, 1986).
A simpler way to determine protein concentration is to use ultraviolet spectrophotometry (Gill and Von Hippel, 1989).
Generally, this technique generates a relative error of 1–3% and its usage is restricted to highly purified proteins with a known extinction coefficient. Other total protein determination methods, such as dry weight determination and colorimetric techniques
(Bradford, 1976), have some restrictions, e.g., the large amount
of protein required in the case of dry weight determination and
the high degree of error associated with the Bradford method (Stoscheck, 1990; Zaia et al., 1998; Simonian and Smith, 2001).
Once a protein is isolated and purified, the extinction coefficient can be calculated and used to quantify the total protein content in the sample with sufficient precision (Pace et al., 1995).
Since the Bradford method is not considered suitable for low molecular weight proteins (Goren and Li, 1986), the total protein content of reference insulin, which has a molecular weight
of 5796 Da, was calculated using the extinction coefficient of
Fig. 1: Analysis of RFP, batch B4-267. Experimental extinction coefficient calculated from the dry weight of total protein diluted in 0.2 M acetic acid (A) and correlation
of absorbance at 280 nm between denatured (8 M urea) and native (0.2 M acetic acid) insulin (B).
The experimental extinction coefficients of 0.557
(Figure 1A) and 0.562 were obtained for the RFP batches B4-267 and B4-268, respectively, based on the dry weight of total protein diluted in 0.2 M acetic acid. Those values were 5.4% and 4.5% lower than the theoretical value (0.589), respectively, indicating that the theoretical value could be used for the calculation of
total protein in SFP and RFP samples. There is a difference of
approximately 4% in the absorbance at 280 nm between the denatured and the native protein (Figure 1B); nonetheless, for total
protein calculations, the proteins were considered to have an equal extinction coefficient (0.557). The RFP batch B4-268 showed
absorbance values of 0.624, 0.553, and 0.572 when solubilized in acetonitrile, 6 M Guanidine-HCl, and 8 M urea, respectively.
The total protein values obtained using dry weight
determination from the lyophilized standards were sufficiently close to those obtained using the theoretical extinction coefficient
(Table 1), which validates the protein quantification method that
uses peak area from analytical chromatography (Figures 2 and 3)
and the theoretical extinction coefficient (Table 1).
Characterization of the sulfonated fusion protein standard
The peak areas of the sulfonated fusion protein standard
(mAU × mL), batch B4-258, obtained in the Mono-Q anion
exchange chromatography, showed linearity in the range of
0.1–2.0 g/L of total protein, with a coefficient of determination
(r2) of 0.999 (Figure 2). The peak height (mAU) was linear at
concentrations up to 1.0 g/L, with a coefficient of determination
(r2) of 0.997 (Figure 2). Thus, the working range was defined as
0.1–1.0 g/L of total protein, corresponding to a concentration of SFP of 0.062–0.818 mg/mL (Figure 2). The purity obtained by overlapping the chromatograms in the linear range and after eluent baseline subtraction in 28 analyses was 89.3 ± 1.4%. The amount of SFP was then calculated from the integrated peak areas (mAU
× mL) and the obtained theoretical extinction coefficient (0.528
mg−1cm−1) using Eq. 2, yielding an average purity of 91.1% (Figure 2), which is very close to the experimentally obtained value of 89.3 ± 1.4%. A conversion factor of 374 was then obtained from the curve area of SFP (mAU × mL) when compared to the curve for a total protein of SFP (Figure 2). In addition, the total protein
value of SFP was calculated using equation 2 (5.72 mg/mL), using
the conversion factor of 5.61 mg/mL, resulting in less than 2% error between the two.
In the evaluation of repeatability, the SFP areas showed a relative standard deviation of less than 10% in the range of 0.2– 0.8 g/L, and the retention volume variation was less than 1% for all the concentrations tested (Table 2).
Table 2: Evaluation of the Mono-Q anion exchange chromatography analytical
method on SFP batch B4-258, carried out in triplicate.
Analysis SFP Concentration (mg/mL)
0.062 0.135 0.273 0.485 0.630 0.818
Area (mAU × mL)
Mean 2.30 5.01 10.01 17.94 23.30 31.71 SD 0.19 0.29 0.34 0.40 0.57 1.76
RSD (%) 8.3 5.8 3.4 2.2 2.4 5.6
Retention volume (mL)
Mean 12.72 12.71 12.70 12.61 12.57 12.56 SD 0.01 0.00 0.02 0.01 0.01 0.04 RSD (%) 0.08 0.00 0.16 0.08 0.08 0.32
SD, standard deviation; RSD, relative standard deviation.
Characterization of the renatured fusion protein standard
The peak area (mAU × mL) and peak height (mAU) in the chromatogram obtained by the analysis of RFP at 214 nm are linear up to the total protein concentration of RFP of
approximately 0.06 g/L, with a coefficient of determination (r2) of
0.988. The overlapping chromatograms obtained in the analyses of the RFP standard, batch B4-268, in the linear range of the method
performed on the Aquapore RP-300 reversed-phase column
indicated the purity of 92.0 ± 0.8%. The calculated purity of the RFP standard, batch B4-268, was 84.7% by measurement at 280 nm (Figure 3C), and a conversion factor of 17028, with a coefficient
of determination (r2) of 0.99, was obtained by plotting the curve
of the measured signal (peak area) against the concentration of RFP (Figure 3D). In addition, the total protein value of RFP was
calculated using equation 2 (7.27 mg/mL) and a conversion factor
of 6.66 mg/mL, resulting in less than 10% error between the two. In this case, it is suggested to calculate the amount of RFP from the conversion factor obtained from measuring absorbance at 214
nm instead of using the equation, which uses absorbance at 280
nm. In addition, the signals obtained at 280 nm were lower than those obtained at 214 nm (Figure 3B and 3D).
range of RFP concentration of 0.15–0.5 g/L, and the retention volume variation was less than 1% for all concentrations evaluated (Table 3).
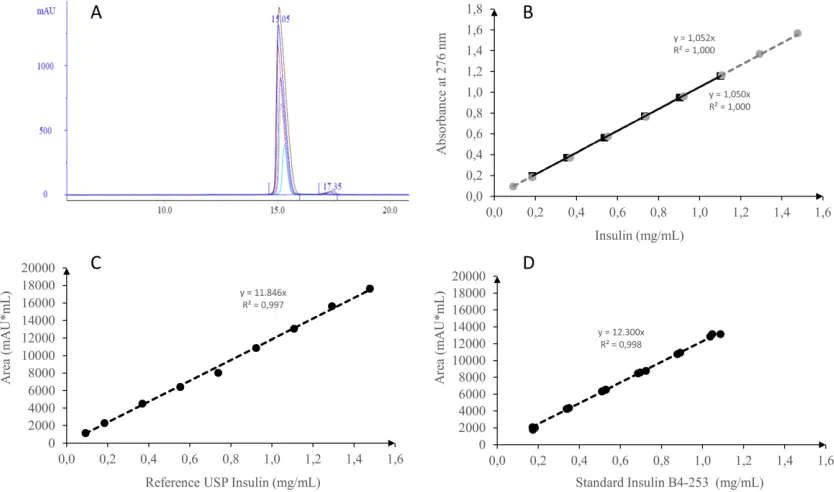
Analysis of reference standard and recombinant human insulin
The total protein content of rHI-C, batch B4-253,
and of sHI were 0.92 and 0.91 mg/mL, respectively (Table 1). The concentration of related proteins was calculated using the
experimental extinction coefficient of 1.0675 mg−1cm−1 at 276 nm,
as described previously (Correia et al., 2012). The experimental
extinction coefficients obtained at 276 nm in this study were 1.052
and 1.050 for the sHI and the rHI-C batch B4-253, respectively (Figure 4B).
Fig. 2: Analysis of SFP standard, batch B4-258. (A) Overlapping of anion exchange chromatograph analyses (Mono-Q columns) using SFP concentrations of 0.062– 0.818 mg/mL, after eluent baseline subtraction. (B) linearity of the anion exchange chromatograph, using peak area (circles) and peak height (squares). (C) Calculation
of purity using SFP values from the anion exchange chromatograph and (D) of the SFP conversion factor using peak area (mAU × mL).
Table 3: Evaluation of the Aquapore anion exchange chromatography analytical method on RFP batch B4-268, carried out in triplicate.
Analysis RFP Concentration (mg/mL)
0.16 0.21 0.26 0.32 0.36 0.43 0.51
Area (mAU × mL)
Mean 149.60 200.96 214.28 276.50 318.59 373.77 452.80
SD 0.44 1.06 0.62 4.71 2.02 1.57 6.91
RSD (%) 0.29 0.53 0.29 1.70 0.63 0.42 1.53
Retention volume (mL)
Mean 13.64 13.72 13.68 13.66 13.62 13.59 13.69
SD 0.06 0.06 0.03 0.05 0.05 0.03 0.08
RSD (%) 0.44 0.44 0.22 0.37 0.37 0.22 0.58
SD, standard deviation; RSD, relative standard deviation.
The overlapping chromatograms obtained in the analysis of sHI on the Kromasil reversed-phase column indicated that the purity of sHI was 99.0 ± 0.1% in the linear range of the method. Furthermore, purity of 98.8% was obtained for the internal standard, batch B4-253. We noticed the variation in the retention volume and the insulin concentration during the reversed-phase analysis on the Kromasil column. The chromatogram peak area measured at 220 nm wavelength was linear up to a concentration of insulin of approximately 1.2 mg/mL. The measured signal (peak area) compared to the
concentration of insulin had a coefficient of determination
value (r2) of 0.997 and a slope of 11846, corresponding to the
conversion factor for USP reference insulin (Figure 4C) of 12300 (r2 = 0.998; Figure 4D).
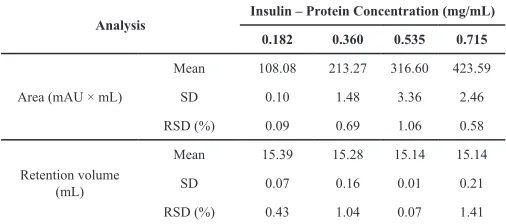
In the evaluation of the method’s repeatability, the areas on the chromatogram showed a relative standard deviation of below 2% in the range of insulin concentration of 0.18–0.72 g/L (Table 4).
Analytical curves were constructed for each method after the characterization of standards, i.e., of SFP, RFP, rHI-C, and sHI, for total protein content and purity. ANVISA (Brasil, 2003a) and International Conference on Harmonization (International Conference On Harmonization - ICH, 1996) guidelines recommend that the linearity of the curve be determined by analysis of at least
5 different concentrations. All coefficients obtained fit the data for
linear regression (r2 ≥ 0.95), and they were in accordance with the
recommendations issued by regulatory agencies (Brasil, 2003b;
Fig. 3: Analysis of RFP standard, batch B4-268. (A) Overlapping of chromatographs of Aquapore RP-300 column analyses using RFP concentrations of 0.1–0.6 mg/ mL, after eluent baseline subtraction. (B) Linearity of the method, using chromatograph peak area (squares) or peak height (circles). (C) Calculation of purity using RFP
values from the chromatograph and (D) of the RFP conversion factor using peak area (mAU × mL).
Fig. 4: Analysis of the insulin standard, batch B4-253, or of USP reference insulin. (A) Overlapping of chromatographs of insulin standard, batch B4-253, on Kromasil
column analyses using insulin concentrations of 0.1–1.2 mg/mL, after eluent baseline subtraction. (B) The experimental extinction coefficient was 1.052 for the USP reference insulin (circles) and 1.050 for batch B4-253 (squares). (C) Calculation of the conversion factor for the USP reference insulin using peak area (mAU × mL)
and (D) of the conversion factor for the insulin standard, batch B4-253, using peak area (mAU × mL).
A different approach was used to calculate the amount of the specific protein and characterize each standard used in
the analytical methods. The amount of protein and the purity of standards was calculated from the peak areas obtained from the
analytical chromatograms and the theoretical extinction coefficient
using Beer’s law equation. This approach can be used to directly quantify any sample; however, it has the disadvantage of detecting
lower signal at the wavelength of 280 nm, at which the theoretical
extinction coefficients are calculated, when compared to the values
the analytical methods for testing RFP and insulin. The areas and heights of the corresponding peaks must be within the linearity range, i.e., the detector and the column must not be saturated. The loss of proportionality in the peak height means volume alteration with concentration due to column saturation (Apostol et al., 2012).
In that case, the value to be used in the equation must be corrected
by multiplying the peak area (area × mL) by the corresponding peak volume (mL). This situation occurred in our analysis of SFP
on the Mono-Q column (Figure 1). In the analysis of RFP, the peak areas and heights were linear and the peak volume constant for all RFP concentrations used (Figure 2); therefore, the peak area given in the chromatogram can be used to directly calculate the protein concentration, without correction by peak volume.
Table 4: Evaluation of the Kromasil chromatography analytical method on rHI-C batch B4-253, carried out in triplicate.
Analysis Insulin – Protein Concentration (mg/mL)
0.182 0.360 0.535 0.715
Area (mAU × mL)
Mean 108.08 213.27 316.60 423.59
SD 0.10 1.48 3.36 2.46
RSD (%) 0.09 0.69 1.06 0.58
Retention volume (mL)
Mean 15.39 15.28 15.14 15.14
SD 0.07 0.16 0.01 0.21
RSD (%) 0.43 1.04 0.07 1.41
SD, standard deviation; RSD, relative standard deviation.
The purity calculated for the SFP standard, batch B4-258,
using the peak area and the extinction coefficient, was 91.1%, with a difference of approximately 2% from the one obtained from the
elution chromatogram. For the RFP standard, batch B4-268, the
calculated purity was 84.7%, with a difference of approximately
8% from the one obtained from the elution chromatogram. Hence,
the results using different methods are sufficiently similar, which ensures data accuracy. Besides this, the peak areas were verified by
calculating the triangle area, i.e., by multiplying the left half of the triangle area by 2, to correct for peak tailing (results not shown). In the case of both SFP and RFP, it was established that the correct area value was taken for the calculations. For the analysis and
quantification of insulin, a very pure commercial standard, with a defined insulin concentration, was used (Tables 1 and 4).
The evaluation of analytical methods showed the
similarity between the values obtained by different methods in the established working range. The linearity had a coefficient of
determination (r2) higher than 0.98 in all data, and repeatability
showed an error of less than 2% in the average values. Finally, the intermediate precision demonstrated an error of less than 5% in the medium values in the working range, which is in accordance with the Brazilian regulatory guidelines (Brasil, 2003a).
CONCLUSION
It can be concluded that the analytical methods used in the process of producing recombinant human insulin are suitable for their intended purpose, ensuring the reliability of data and the
application of the methods in different steps of the production
process, such as for in-process control, i.e., of SFP and RFP,
and for analysis of the final product, i.e., of bulk human insulin
crystals.
FUNDING
This study was supported by Biomm AS.
CONFLICTS OF INTEREST
The authors declare no conflict of interest. REFERENCES
Apostol I, Kelner D, Jiang XG, Huang G, Wypych J, Zhang X, Gastwirt J, Chen K, Fodor S, Hapuarachchi S, Meriage D, Ye F, Poppe L, Szpanowski W. Uncertainty estimates of purity measurements based on current information: toward a “live validation” of purity methods. Pharm Res, 2012; 29:3404-19.
Astolfi-Filho S, Lima BD, Thiemann JE, de Sousa HRT, Vilela
L. Vector for expression of heterologous protein and methods for extracting recombinant protein and for purifying isolated recombinant insulin. US Pat, 2004; number patent is US 6,699,692 B2.
Baeshen NA, Baeshen MN, Sheikh A, Bora RS, Ahmed MMM, Ramadan HAI, Saini KS, Redwan EM. Cell factories for insulin production. Microb Cell Fact, 2014; 13:141.
Bradford MM. A rapid and sensitive method for the quantitation of microgram quantities of protein utilizing the principle of protein-dye
binding. Anal Biochem, 1976; 72:248-54.
Brasil, Ministério da Saúde. Agência Nacional de Vigilância Sanitária. Resolução RE no 899 - Guia para validação de métodos analíticos e bioanalíticos. DOU - Diário Of da União, 2003a; 1-12.
Brasil, Ministério da Saúde. Agência Nacional de Vigilanica Sanitária. RDC no 210 - Regulamento Técnico das Boas Práticas para a Fabricação de Medicamentos. DOU - Diário Of da União, 2003b; 1-124.
Brasil, Instituto Nacional de Metrologia, Normantização e
Qualidade Industrial - INMETRO. DOQ-CGCRE-008 - Orientação sobre Validação de Métodos de Ensaios Químicos. 2007; 1-24.
Colomé LM, Freitas GM, Bastiani JDM, Pereira TCB, Bajerski L, Bender EA, Haas SE. Validation of analytical method by HPLC for determination of dapsone in polymeric nanocapsules based on crude rice brain oil. J Appl Pharm Sci, 2017; 7:230-233.
Correia M, Neves-Petersen MT, Jeppesen PB, Gregersen S, Petersen SB. UV-light exposure of insulin: pharmaceutical implications upon covalent insulin dityrosine dimerization and disulphide bond photolysis. PLoS One, 2012; 7:e50733.
Ferrer M, Thorsteinsdóttir H, Quach U, Singer PA, Daar AS. The scientific muscle of Brazil’s health biotechnology. Nat Biotechnol, 2004;
22:DC8-12.
Gill SC, Von Hippel PH. Calculation of protein extinction
coefficients from amino acid sequence data. Anal Biochem, 1989;
182:319-26.
Goren MP, Li JTL. The Coomassie Brilliant Blue Method Underestimates Tubular Proteinuria. Clin Chem, 1986; 32:386-388.
Hwang HG, Kim KJ, Lee SH, Kim CK, Min CK, Yun JM, Lee SU, Son YJ. Recombinant glargine insulin production process using
Escherichia coli. J Microbiol Biotechnol, 2016; 26:1781-1789.
International Conference On Harmonization - ICH. Q2B -
Validation of Analytical Procedures: Methodology. 1996.
Karamitsos DT. The story of insulin discovery. Diabetes Res Clin Pract, 2011; 93: S2-S8.
Mikiewicz D, Bierczyńska-Krzysik A, Sobolewska A. Soluble
insulin analogs combining rapid-and long-acting hypoglycemic properties–
From an efficient E. coli expression system to a pharmaceutical formulation. PLoS One, 2017; 12(3):1-19.
Moretto LD, Shib M. The Validation Era. Pharm Technol, 2000; 4:44-48.
Moussa BA, Farouk F, Azzazy HME. A Validated RP-HPLC Method for the Determination of Recombinant Human Insulin in Bulk and Pharmaceutical Dosage Form. E-Journal Chem, 2010; 7:973-4945.
Biophys, 1986; 249:437-46.
O’Keefe DO. Analysis of protein impurities in pharmaceuticals derived from recombinant DNA. Sep Sci Technol, 2000; 2:23-70.
Pace CN, Vajdos F, Fee L, Grimsley G, Gray T. How to measure
and predict the molar absorption coefficient of a protein. Protein Sci, 1995;
4:2411-23.
Polez S, Origi D, Zahariev S, Guarnaccia C, Tisminetzky
SG, Skoko N, Baralle M. A simplified and efficient process for insulin
production in Pichia pastoris. PLoS One, 2016; 11:1-15.
Simonian MH, Smith JA. Spectrophotometric and Colorimetric Determination of Protein Concentration. Current Protocols in Toxicology
Stoscheck CM. Quantification of Protein. Methods Enzymol,
1990; 182:51-68.
Valentini SR, Sommer WA, Matioli G. Validação de métodos
analíticos. Arq Mudi, 2007; 11:26-31.
Zaia DAM, Zaia CTBV, Lichtig J. Determinação de proteínas totais via espectrofometria: Vantagens e desvantagens dos métodos
existentes. Quim Nova, 1998; 21:787-793.
How to cite this article:
Tabosa ATL, de Sousa HRT, Xavier MADS, Fernandes EG, Xavier AREDO, Vilela L, Alves JMDS. Reliability of Analytical Methods for Recombinant Human Insulin Quantification in the Bulk Crystals and in-Process Control. J App Pharm Sci, 2018; 8(07): 043-050.