Estimation of Number of Simultaneously Supported
Interactive VoIP and Video Sessions in LTE-Advanced
Marko Porjazoski, Borislav Popovski
Abstract – LTE-Advanced has engaged several techniques in order to enhance system performance enhancements compared to LTE. In this paper we evaluate LTE-Advanced capacity in the means of a number of simultaneously supported interactive VoIP and video sessions. Some new features that enable the capacity enhancements that are provided in LTE-Advanced like spatial multiplexing and Carrier Aggregation are overviewed. In order to calculate the number of supported users, we determine the number of resource elements available for user data transmission in downlink and uplink, taking in account all the resource elements used for redundant information. The maximal number of simultaneously supported interactive VoIP and video sessions is calculated assuming 64-QAM modulation with ¾ code rate for all transmissions. Finally the number of parallel VoIP and video sessions is calculated and compared for different LTE-A scenarios.
Keywords – LTE-Advanced, Spatial Multiplexing, Carrier Aggregation, Capacity, Interactive VoIP, Interactive Video.
I.
I
NTRODUCTION3GPP Release 10, system known as LTE-Advanced (LTE-A) enhances the capabilities of LTE (Long Term Evolution), in order to satisfy the International Telecommunication Union’s requirements for IMT-Advanced[1]. In [2] a list of LTE-A requirements can be found. In order to meet the listed requirements, which are related to the system performance, LTE-A introduces new features in physical layer, including enhanced multi-antenna support (MIMO), to increase the data rate, Carrier Aggregation (CA), to provide wider bandwidth and support of heterogeneous networks, to improve the capacity and coverage [3].
In this paper the focus is on improvements that are
achieved using MIMO and CA by analyzing
simultaneously supported VoIP and video sessions. One of the new technique that is used in LTE-A to improve performances is spatial multiplexing [1]. In spatial multiplexing the transmitter and receiver both use multiple antennas to establish multiple parallel streams, so as to increase the data rate or the number of supported users nearly by the number of antennas used. The transmitted data streams can be directed to one set of users, introducing the Single User MIMO (SU-MIMO), used to increase the data rate of just one set of users, or they can be directed to multiple different users leading to Multi User MIMO (MU-MIMO) scenario, which allows increasing the overall capacity[4].
CA enables bandwidth extension up to 100MHz, which is the maximum carrier aggregation of five 20 MHz Component Carriers (CC). However, this is not very common, due to the operator’s limited bandwidth [5].
Usually mobile systems performances are evaluated by computer simulations. It is rare to find in literature an analytical method for calculation of number of supported users in mobile networks. So in our work we are trying to establish a framework for calculation of number of simultaneous sessions support in LTE-Advanced network.
The paper is organized as follows. In Section II we provide an overview of LTE and LTE-A radio frame in downlink and uplink, in order to introduce the resource grid and estimate the number of resource elements which are available for user data transmission. We use these results in Section III to evaluate and compare the maximum number of simultaneous VoIP sessions and simultaneous video sessions when using 64QAM with ¾ code rate, for different scenarios of MIMO and CA use. In Section IV we propose a method for estimating the number of parallel simultaneously supported VoIP and video users for previously discussed scenarios. Finally, Section V concludes the paper.
II.
LTE-A
DVANCEDR
ADIOF
RAMERelease 10 features are designed to be backward - compatible with Release 8, so the physical layer radio frame remains the same as the one used in LTE Release 8. In order to perceive the enhancements gained using multi-antenna techniques and CA, we will give an overview of the radio frame in LTE downlink (DL) and uplink (UL).
LTE physical layer in DL is based on Orthogonal Frequency Division Multiple Access (OFDMA), while in UL it is based on Single Carrier Frequency Division Multiple Access (SC-FDMA) [6]. LTE supports both Frequency Division Duplex (FDD) and Time Division Duplex (TDD) schemes, which results in different frame structures in time domain [7].
In this paper we will use the FDD scheme. Both OFDMA and SC-FDMA techniques are based on fixed frame-based transmission. In time domain, the radio frames are 10ms long
(
T
frame=
10
ms
)
, and are divided into 10 frames each with 1ms duration. Each sub-frame is composed of two time-slots with 0.5ms duration. The resource allocation is organized in resource blocks (RB), which is the minimum amount of resources that can be assigned to a user. Users are multiplexed in time and frequency by allocating different RBs. Each RB is a two dimensional structure containing resource elements (RE). In our work we will use the most common configuration of RB, as follows. In time domain the RB corresponds to one time slot with 0.5ms duration and contains 7 symbols. In frequency domain the RB is divided into 12 subcarriers,each with 15kHz spacing. This leads to
resource element (RE) is defined as one symbol (0.5ms/7) in time domain and 1 subcarrier (15kHz) in frequency domain [8]. Fig. 1 illustrates the structure of the resource grid of LTE.
LTE supports different frequency bands: 1.4, 3, 5, 10, 15 and 20MHz. Depending on the frequency band used, the number of RB varies from 6 RB per time-slot (for 1.4 MHz) to 100 RB per time-slot (for 20MHz).
The radio interface capacity is used both for user data transmission and for redundant information such as transmission of control, synchronization and broadcasting signals.
Fig. 1. Resource grid structure [7]
All the channels used for transmission of the required information are mapped onto the structure of REs. The mapping scheme is different in DL and UL.
A.
Resources Allocation in DL
An illustration of DL configuration for 20MHz FDD with 15kHz is given in [7].
Considering the structure of the RE mapping scheme, we can derive a general equation for calculating the
number of REs used for data transmission
(
N
DATARE)
in downlink as:RE PBCH RE
SYNC RE
REF RE
PDCCH RE
TOTAL RE
DATA
N
N
N
N
N
N
=
−
−
−
−
(1)where
N
TOTALRE is the total number of REs in one radio frame,N
PDCCHRE is the number of REs for transmission of Physical Downlink Control Channel (PDCCH),N
REFREand
N
SYNCRE are the numbers of REs used for reference and synchronization signals transmission respectivelyand
N
PBCHRE is the number of REs used for transmission of Physical Broadcast Channel.The number of resource elements occupied by synchronization signals and PBCH does not depend on the channel bandwidth (number of RBs), it is always constant. The synchronization signals are transmitted with 5ms period, on six central RBs and occupy the first two symbols in one RB. PBCH is transmitted with 10ms period, on six central RBs and occupy four symbols in one RB.
The number of REs occupied by PDCCH and reference signals depends on the used bandwidth. PDCCH signals are transmitted with 1ms period, on all RBs and occupy
Fig. 2. RE mapping for the cell-specific reference signals, normal cyclic prefix
The mapping of the reference signals, which are used for antenna ports, depends on the number of antenna ports used by the base station and the antenna port number.
Fig. 2 shows the resource allocation configuration for one, two and four antenna ports. In case of spatial multiplexing, while one antenna is transmitting a reference signal, all others stay silent, in the manner required for spatial multiplexing [1]. That means that the use of spatial multiplexing downsizes resources for data transmission, even though not all the resources reserved for redundant information have to be used.
B.
Resources Allocation in UL
An illustration of UL configuration for 20MHz FDD with 15kHz is given in [7].
Analog to (1), we can derive an equation for calculating the number of RE used for data transmission in UL:
RE REF RE
PUCCH RE
TOTAL RE
DATA
N
N
N
N
=
−
−
(2)
where
N
TOTALRE is the total number of REs in one radio frame,N
PUCCHRE is the number of REs for transmission of Physical Uplink Control Channel (PUCCH) andN
REFRE are the numbers of REs used for Demodulation and Sounding Reference Signals transmission respectively.The number of resource elements occupied by PUUCH and Demodulation Reference Signal for PUCCH does not depend on channel bandwidth (number of RBs), it always remains the unchanged. PUCCH and Demodulation Reference Signals for PUCCH are transmitted with 2ms period, on the first and the last RBs and occupy one RB.
The number of REs occupied by Demodulation Reference Signals for PUSCH and Sounding Reference Signals depends on the bandwidth used. Demodulation Reference Signals for PUSCH are transmitted with 0.5ms period, on all RBs and occupy two symbols in one RB. Sounding Reference Signals are transmitted with 1ms period, on all RBs and occupy one symbol in one RB.
III.
V
OIP
ANDV
IDEOT
RANSMISSIONO
VERLTE-A
We define LTE-A voice and video capacity as number of simultaneous voice and video calls carried by LTE-A. In [9] the procedure for determining this capacity is given. We will use 64 QAM modulation
(
N
bits/symbol=
6
)
and ¾ code rate (CR).Having obtained the average number of RE per RB for
data in both DL and UL -
N
REdata/RB(Table I), we can calculate the average number of bits carried by one RB.The total number of resource blocks available during
one voice/video packet generation period,
period video voice RB
N
/ _ is calculated as:frame RB frame
video voice period
video voice
RB
N
T
T
N
/ _ / /*
=
(4) Finally, the total number of voice/video calls served by LTE-A can be calculated as:
packet video voice RB
period video voice RB video
voice
N
N
N
/ __ /
/
=
(5) where
N
voice/videois the number of voice or video userssimultaneously served by LTE.
Table I. Effective resources available for user data transmission per radio frame
Channel band-
width [MHz] 1.4 3 5 10 15 20
# RB per slot 6 15 25 50 75 100
Total # of RB
per frame 120 300 500 1000 1500 2000
Total # of RE
per Frame 10080 25200 42000 84000 126000 168000
Number of RE for Data in DL
7716 20136 33936 68436 102936 137436
Average # of RE per RB for Data in DL
64.3 67.12 67.872 68.436 68.624 68.718
Number of RE for Data in UL
6600 18480 31680 64680 97680 130680
Average # of RE per RB for Data in UL
55 61.6 63.36 64.68 65.12 65.34
If we consider using MIMO and CA, the number of resources available for data changes, therefore the number of simultaneous users increases.
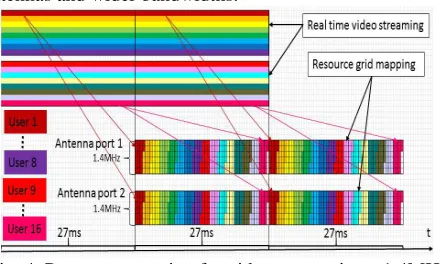
Fig. 3. Resource mapping for video connections, 1.4MHz channel bandwidth, no MIMO
CA requires more complicated signaling. However, there are no differences in the number of reserved resources, in regard to resource allocation. That means that the use of CA multiplies the available resources by the number of CC used. The bandwidths of the CCs do not have to be equal, it is possible to use CCs with different bandwidths and the resources of the additional CCs are just added to the primary CC.
Taking into account that VoIP and video are real time services, spatial multiplexing can only influence by increasing the number of supported users.
In order to keep the simplicity, we will demonstrate the way SU-MIMO and MU-MIMO increase the number of simultaneously supported users, using 2x21.4MHz. Analog to that, this will apply to systems with more antennas and wider bandwidths.
Fig. 4. Resource mapping for video connections, 1.4MHz channel bandwidth, SU-MIMO
Fig. 3. shows a case where no MIMO is used, which means that the transmitter uses one antenna and one antenna is used by the receiver. Using(5), we can calculate that 8 simultaneous 27ms video streams (from 8 users) can be supported by 2.7 radio frames. Each user’s information is colored differently.
Fig. 5. Resource mapping for video connections, 1.4MHz channel bandwidth, MU-MIMO
Anyway, as previously stated, video and VoIP calls are real-time services, so the resources that remain available cannot be used for increasing the data rate, but for supporting more simultaneous users. In conclusion, SU-MIMO multiplies the number of supported users by the number of antennas used, or if there are enough available resources there can be supported a few more users.
Fig. 5 shows the case of 2x2 MU-MIMO. Since the receiver has only one antenna, the data is being transmitted through two antennas to two different users (receivers). In conclusion, use of MU-MIMO multiplies the number of users exactly by the number of antennas used.
The connections we are considering are VoIP and video calls, therefore the communication is symmetrical.
Table II. Maximum number of supported users for 20MHz channel bandwidth
Channel bandwidth 20MHz VoIP DL Video DL VoIP UL Video UL No MIMO, no CA 666 150 666 145 No MIMO, CA 2CC 1333 300 1333 291 2x2 MIMO, no CA 1332 284 1332 284 2x2 MIMO, CA 2CC 2666 568 2666 582 4x4 MIMO, no CA 2000 540 2664 580 4x4 MIMO, CA 2CC 4000 1080 5332 1164
Table II presents the maximum number of VoIP or video connections for 20MHz channel bandwidth, for different scenarios. As shown in Table II, the number of connections in downlink and uplink is different for different scenarios, so we will use the lower number of connections as a constriction.
0 1000 2000 3000 4000 5000 6000 N u m b e r o f su p o rt e d V o IP a n d V id e o s e ss io n s VoIP DL Video DL VoIP UL Video UL
Just for illustration and visual comparison, number of supported interactive VoIP and video session in LTE-A in downlink direction, presented in Table II are depicted in Fig. 6. Even it is intuitively expected that increase of carrier aggregation an MIMO order will doubles the system capacity, due to additional resources occupied by reference signals MIMO shows slightly smaller improvement then CA.
In Fig. 4 and Fig. 5 it is presented that not all of the available resources are used because the number of available resource block is not enough to meet the requited one for packet transmission of one video connection. This led us to the idea to use these available resources for voice packages, since the number of resources blocks required for a voice connection is lower.
IV.
S
IMULTANEOUSV
OIP
ANDV
IDEOT
RANSMISSIONO
VERLTE-A
In order to maximize the utilization of the resources, considering that the VoIP packets are smaller than video packets, we can easily combine them in the video resource scheme using appropriate scheduling. In this paper we will combine both services on the basis of the video radio frame. Fig. 7 shows the proposed scheduling scheme for combining video and VoIP calls. In order to keep the simplicity we use 1.4MHz bandwidth in this case, there is no use of MIMO, nor CA.
Fig. 7. Proposed scheduling scheme for combining video and VoIP calls
An equation which will apply to all the possible cases using MIMO and CA can be derived. We propose the following equation for calculating the number of VoIP users that can be supported parallel to arbitrary number of video users: −
= voice packet RB video RB total RB voice N P N N N _ ) ( (6) where antenna slot RB video total
RB
T
N
N
N
=
*
2
*
*
(7)
is the total number of RBs (
N
RBslot is the number of RBsis the number of RBs used for all the video packets
(
N
video is the number of simultaneous video calls whichcan vary from 0 to the maximum number of video users
and
N
RBvideo_packet is the number of RBs for video packet transmission) and
T
videoT
voice
P
=
(9)is the period for transmitting voice packets over the video resource grid.
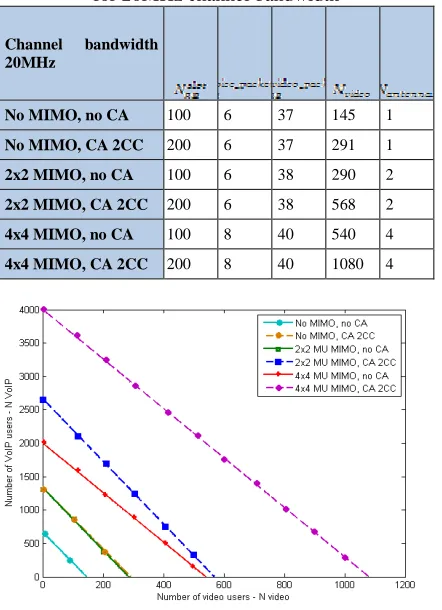
Using the values from Table III in (6), we generated Fig.8 which shows the number of combined video and VoIP connections, for 20MHz basic channel bandwidth. There are six different scenarios presented. As expected, the number of supported users increases adding more antennas or component carriers.
Table III. Values for calculating NVoIPdepending on Nvideo
for 20MHz channel bandwidth
Channel bandwidth 20MHz
No MIMO, no CA 100 6 37 145 1
No MIMO, CA 2CC 200 6 37 291 1
2x2 MIMO, no CA 100 6 38 290 2
2x2 MIMO, CA 2CC 200 6 38 568 2
4x4 MIMO, no CA 100 8 40 540 4
4x4 MIMO, CA 2CC 200 8 40 1080 4
Fig. 8. Number of supported video and VoIP users for different LTA-Advanced configurations
We can notice that the case of “no MIMO, CA 2CC” and the one of “2x2 MU MIMO, no CA” almost overlap. The case of “2x2 MU MIMO, CA 2CC” and “4x4 MIMO, no CA” are comparable, but in the case of “2x2 MU MIMO, CA 2CC” more users can be supported. It depends on the network designer which scenario they will use.
V.
C
ONCLUSIONCapacity of LTE-Advanced is significantly increases due to usage of CA and spatial multiplexing techniques on physical layer. In such a way available resources are
increased, their utilization is maximized, and in consequence the number of supported users or data rate is increased.
In this paper, we estimated the number of simultaneous interactive VoIP and video sessions that can be supported by one LTE-Advanced cell. We overviewed the video and voice data mapping onto LTE-Advanced resource grid.
Taking into account VoIP and video calls, LTE-Advanced increases the number of supported users. It can be concluded that CA multiplies the number of supported users nearly by the number of component carriers used and MIMO multiplies the number of supported users by the number of antennas used.
In order to maximize the utilization of the resources, we proposed a method for calculating the number of parallel video and VoIP simultaneous connections and compared the results for different LTE-A scenarios.
R
EFERENCES[1] C. Cox, An introduction to LTE LTE, LTE-Advanced,
SAE and 4G Mobile Communications, Wiley, 2012
[2] 3GPP TS 36.913, Requirements for further advancement
for Evolved Universal Terrestrial Radio Access (E-UTRA) – (LTE-Advanced), v9.0.0, December 2009.
[3] A. Ghosh, R. Ratasuk, Essentials of LTE – LTE-A, Cambridge University Press, 2011.
[4] Joao de Quantaniliha Melerio de Araujo Martines, ( 2016, August 10), Impact of MIMO and Carrier Aggregation in LTE-Advanced, thesis to obtain the Master of Science Degree in Electronical and Computer Engineering, [Online]. Available: http://grow.inov.pt/wp-content/uploads/2014/10/Tese-final-Jo--o-Martins.pdf. [5] M. Iwamura, “Carrier Aggregation Framework in 3GPP
LTE-Advanced,” in IEEE Communication magazine, August 2010, pp. 60-67.
[6] A. Ghosh, R. Ratasuk, B. Mondal, N. Mangalvedhe and T. Thomas “LTE-Advanced: Next-Generation Wireless Broadband Technology,” IEEE Wireless Communications, June 2010, pp. 10-22,
[7] F. Rezaei, M. Hempel, H. Sharif, “LTE PHY Performance Analysis under 3GPP Standards Parameters,” 2011 IEEE 16th International Workshop on CAMAD, 2011, pp. 102-106.
[8] A. Z. Yonis, M. F. L. Abdullah, (2012, June), “Peak-Throughput of LTE – Release 10 for Up/Down Link Physical Layer,” International journal of information and
network security, Vol. 1, No. 2, pp.88-96, Available:
http://iaesjournal.com/online/index.php/IJINS/article/vie w/452/227.
[9] Cisco Systems, Inc., Document ID: 7934, (2016, February), “Voice Over IP − Per Call Bandwidth Consumption,” February 2006, Available: http://www.cisco.com/c/en/us/support/docs/voice/voice-quality/7934-bwidth-consume.html.
[10] Alex MacAulay, Boris Felts, Yuval Fisher, “IP Streaming of MPEG-4:Native RTP vs MPEG-2 Transport Stream,”
White Paper, October 2005, Available:
A
UTHORS'
P
ROFILESMarko Porjazoski received B.Sc., M.Sc. and Ph.D. degrees in electrical engineering from Ss. Cyril and Methodius University, Skopje, Republic of Macedonia in 2000, 2006 and 2012 respectively. His research interests include radio resource management in wireless networks, heterogeneous wireless networks and internet technologies.
Currently he works as Assistant Professor at the Faculty of electrical engineering and information technologies, Ss. Cyril and Methodius University in Skopje, Republic of Macedonia.
Dr. Porjazoski is a member of IEEE and IEEE communication society since 2005 and member of Macedonian society of engineers in Electronic, Telecommunications, Automation and Informatics (ETAI).
![Fig. 1. Resource grid structure [7]](https://thumb-us.123doks.com/thumbv2/123dok_us/8786173.1764107/2.595.90.265.225.349/fig-resource-grid-structure.webp)