This is an open access journal, and articles are distributed under the terms of the Creative Commons Attribution-Non Commercial-ShareAlike 4.0 License, which allows others to remix, tweak, and build upon the work non-commercially, as long as appropriate credit is given and the new creations are licensed under the identical terms.
© 2019 Journal of Advanced Pharmacy Education & Research | Published by SPER Publication
1
The use of box-counting method in the interpretation of Visual
Analogue Scale scores
Thamer Ahmad A.K. Altaim
1*, A.A. LeRoux
21Physiotherapy Department, College of Applied Medical Sciences in Qurayyat, Jouf University, Post code: 77454, Saudi Arabia. 2Longhand Data Limited, Wellburn, York,
YO60 7EP, United Kingdom.
Correspondence: Thamer Ahmad Abdul Kareem Altaim. Physiotherapy Department, College of Applied Medical Sciences in Qurayyat, Jouf University, Post code: 77454, Saudi Arabia. Email: [email protected].
ABSTRACT
Clinicians in their clinical practices face great amounts of difficulties interpreting scores obtained from the pain outcome measures. In spite of long-standing critiques of visual analogue scales (VAS) for pain, no alternative method of measurement has been proposed, and researchers and clinicians have had no alternative to continue using this scale. This study proposed a method which would provide valid measurements on a VAS, one of the most commonly used outcome measures with a particular reference to the 10-cm version of VAS for pain. The method was the box-counting method. The integration of this new method in the interpretations of a patient’s sensation of pain would not only enable clinicians interpret measurements, but also it would help in planning or delivering treatments. The proposed method provided the certainty of the accuracy of a clinical interpretation of a score on the scale.
Keywords: Pain outcome measure, visual analogue scale, box-counting method.
Introduction
A patient who selects a number on a visual analogue scale provides a clinician with a measurement of a sensation of pain, which the clinician is expected to use in planning or delivering treatments [1-4]. This requires the clinician to interpret the
measurement [5, 6]. Interpretation is difficult, if not impossible,
when the scale does not provide an absolute reference standard for the measurement of the sensation [7]. Interpretation is
impossible when the scale is based on the assumption that a sensation has a psychologically valid physical measurement [8].
This is the assumption on which the 10-cm Visual Analogue Scale for Pain is based.
Despite long-standing critiques of visual analogue scales [1, 9-12]
and the visual analogue scale for pain in particular [1, 9], no
alternative method of measurement has been proposed, and researchers and clinicians have had no alternative to continue
using the 10-cm Visual Analogue Scale for Pain. Problems in doing so arise from the uncertainty of the accuracy of a clinical interpretation of a score on the scale. It is not difficult to show a score on a VAS which is not a valid measurement, and it is logically impossible to obtain an accurate clinical interpretation of a quantitative measurement. This paper proposed a method which would provide valid measurements on a visual analogue scale (VAS) with the particular reference to the 10-cm VAS for pain. The method was the box-counting method.
The use of a VAS has been based on two assumptions [8]:
1. The perceived intensity of the effect of the clinical deficit - the response- and the severity of the clinical deficit producing the effect - the stimulus- which have been the same; and
2. The relationship between the physical measurements of the intensity of a response and the severity of the stimulus has been linear.
Fechner’s Law [13, 14] and Stevens’ Law [15] also assume the
response and the stimulus as the same, but define the power laws to describe the form of the relationship between the physical measurements of the response and the stimulus. Fechner’s power law was derived from the studies of just noticeable differences
between the physical measurements of a response to changes in the physical measurements of the stimulus. Steven’s power law was derived from the studies [15-18], over a range of stimuli, of Access this article online
Website: www.japer.in E-ISSN: 2249-3379
How to cite this article: Thamer Ahmad Abdul Kareem Altaim, A.A. LeRoux. The use of box-counting method in the interpretation of Visual Analogue Scale scores. J Adv Pharm Edu Res 2019; 9(2):1-6.
2 Journal of Advanced Pharmacy Education & Research | Apr-Jun 2019 | Vol 9 | Issue2
changes in the physical measurements of a response as the physical measurements of a stimulus changed.
When the response is a sensation, the perceived intensity of the
response does not have a physical measurement and cannot have a psychologically invalid physical measurement [13]. A sensation
exists in the undefined space. Space has dimensions: a space of one dimension is a line; a space of two dimensions is a plane; and a space of three dimensions is a volume; and so on. Suppose a sensation is a response to a stimulus. Then the response
exists in an undefined space of a dimension between 1 and 2. Alternatively, the relationship occupies a part of an undefined plane. For convenience, suppose the shape of the undefined plane is a square box of unknown size, and let number 1 denote the length of a side of the box. Also suppose the extent to which the relationship occupies the box is determined by the intensity of the response. Further, suppose the square box of an unknown size consists of n × n = n2 small square boxes each of
the same unknown size. Then, the number of small boxes on a side of the large box is n, and the length of the side of one of the n small boxes is 1 ÷ n. Let n = 10. Then the length of the side of one of the n small boxes is 1 ÷ 10 = 0.1. As there is no unit of measure, the distance covered by this length is unknown, making the length of 0.1 the label for a qualitative entity.
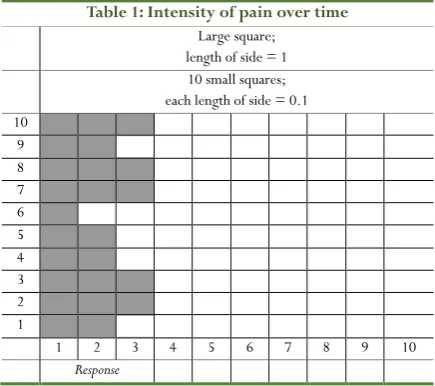
Table 1: Intensity of pain over time
Large square; length of side = 1 10 small squares; each length of side = 0.1 10 9 8 7 6 5 4 3 2 1
1 2 3 4 5 6 7 8 9 10
Response
The arrangement of the boxes has been shown in Table 1 where the shaded part of the large box denotes the portion of the plane occupied by the intensity of the response. The number of boxes in the shaded part varies, as the intensity of the response varies. The dimension of the shaded part is a number between 1 and 2. There is a power law relationship between the number of small boxes in the shaded part (the box-count), and the number of small boxes in the large box. The relationship is not a relationship between the area of the shaded part and the area of the large box. These areas cannot be known, as there is no unit of measure. The power law relationship converts the box-count of the shaded part into a measure of the intensity of a
response or sensation. A valid measure of the response is provided by the Box-counting Method of Measurement [19].
The Box-counting Method of Measurement
The method uses the geometric space occupied by the response
to find the dimension of the response [19]. A dimension does not
have a unit of measure, and the size of the measure is specific to the number of boxes on the scale for the dependent variable. The method takes no account of the nature of the relationship as the dimension is descriptive, not explanatory.
A valid measurement over n boxes for the intensity of the effect of a clinical deficit (the response) is given by the following equation:
Response−n = log N ÷ log n, where
n = the number of the boxes on the measuring scale for the dependent variable;
m = the number of boxes in a measurement on the measuring scale of the dependent variable scale; and
N = n × m = the box-count
The outcome is a measurement in the range of 1.0 to 2.0. For convenience, the formula is adjusted to give an outcome in the range of 0.0 to 100.0. The adjusted formula is
Intensity −n = [(log N ÷ log n) − 1] × 100
The relative intensity of the effect of a clinical deficit has a value in the range of 0.0% to 100.0%, inclusive.
The method has been used to provide standardized measurements on the 10-cm VAS for Pain [20] by replacing a
score consisting of a distance measured in millimetres with an intensity consisting of a space measured as a square box without physical size.
The Box-counting Method and the VAS for
Pain
A measurement on the 10-cm VAS for pain is a physical manifestation of the intensity of the pain experienced by a patient. The physical manifestation of the intensity of pain is quantified by a measurement consisting of the linear distance from the origin on a scale with a length of 100-mm. The scale is anchored by no pain (pain score of 0-mm) and pain as bad as it could be or the worst imaginable pain (pain score of 100-mm). The quantified response is a score in a range of scores from 0-mm to 100-mm, inclusive. A quantitative response has been interpreted qualitatively as follows [21]:
1. 0-mm to 4-mm for no pain; 2. 5-mm to 44-mm for mild pain
3. 45-mm to 74-mm for moderate pain; and 4. 75-mm to 100-mm for severe pain
Normative values have not been available.
Journal of Advanced Pharmacy Education & Research | Apr-Jun 2019 | Vol 9 | Issue2 3
these 100 square boxes of the unknown size. Further, suppose the 100 square boxes of unknown size are the boxes on the side of a square box with the side length of 1. Then each of the 100 square boxes has the side length of 1 ÷ 100 = 0.01. This is not a quantity as there is no unit of measurement; it is a label. Suppose a patient marks the scale-line at 2.3-cm on a 10-cm VAS for Pain, and let the smallest unit of measure on the VAS, a millimetre, denotes a square box with the side length of 0.01. Also let m = the distance from the origin to the patient’s mark on the scale-line. Then m = 23-mm = 23 square boxes, and the box count is N = 23 × 100 = 2,300. The 2,300 square boxes denote a valid measurement of the intensity of the pain denoted by the patient’s mark.
A valid measurement over 100 boxes for the intensity of a client’s pain is given by the following measurement:
Intensity−100= [(log 2,300 ÷ log 100) − 1] × 100 = [(3.3617 ÷ 2.0000) − 1] × 100 = [1.6809 − 1] × 100 = 68.09.
The measurement 68.09 supports valid comparisons with the other 100 box measurements, but not with measurements based on different numbers of boxes. For example, a 100 box-count intensity of 60 is twice the intensity of a 100 box-box-count intensity of 30. However, a box-count intensity of 60 is not twice the intensity of a 50 box-count intensity of 30, or of a 200 box-count intensity of 30. The reason is that the accuracy of a measurement is determined by the number of boxes covering the measuring scale, and it increases as the number of boxes covering the measuring scale increases.
A Standardised VAS for Pain
1. Box-counting measurements of the intensity for every millimetre of the 10-cm VAS for Pain have been given in Table The measurements are rounded to the nearest whole number for convenience. The table shows that the standardized 10-cm VAS for Pain is
• sensitive to change in lower levels of the perception of the intensity of pain; and
• insensitive to change in higher levels of the perception of the intensity of pain
This means that:
• a relative small change in lower levels of the perception of the intensity of pain is accompanied by a relatively large change in the intensity of pain; and
• a relative large change in higher levels of perception of the intensity of pain is accompanied by a relatively small change in the intensity of pain
For example, a change on the VAS scale from 10-mm to 5-mm (5-mm change) denotes a change in the intensity from 50 to 35 (30% improvement), whereas a change on the VAS from 10-cm to 8-cm (20-mm change) denotes a change in intensity from 100 to 95 (5% improvement).
The Standardized 10-cm VAS for Pain is simple to use: 1) Let the patient mark the scale-line, as usual 2) Read the mark, for example, 1.5-cm
3) Go to Part (a) of Table 1, and read the intensity measurement, for example, 59.
4) Go to Part (b) of Table 1, and interpret the intensity measurement, for example, ‘mild pain’
As with the reading on the VAS scale, the clinical significance of the intensity measurement is unknown. The latter is a standardized measurement that will facilitate defining the clinical significance of the intensity of pain measurements.
Discussion
The purpose of this study was to establish a method that enables the interpretations of VAS of pain scores into meaningful clinical changes, which in turn helps clinicians in day to day clinical practices taking clinical decisions with a greater level of confidence. Many studies pointed out that scores obtained from VAS were not easily interpreted by clinicians and patients [1-3, 9, 10, 22].
The box-counting method used in this study enabled the interchangeability of the VAS scores into meaningful clinical changes in patients’ perceptions of their pain. The method also facilitated the interpretation of an intensity of pain measurement on a 10-cm VAS for pain. This problem was mentioned in many previous studies. For example, Lund et al.
[23] indicated the it is not possible to interchange the assessments
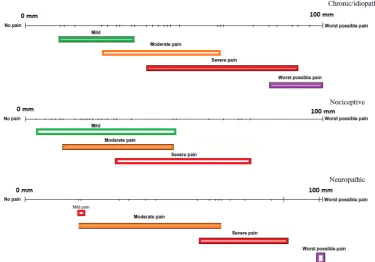
between VAS and Verbal Rating Scale (VRS). Figure 1 shows that this problem is due to the overlap of pain records between the two measures of pain. This problem can be solved using the box-counting method used in this research.
4 Journal of Advanced Pharmacy Education & Research | Apr-Jun 2019 | Vol 9 | Issue2
Figure 1:Overlap of pain records between VAS and VRS
The findings of the study conducted by Lund et al. [23] implied
that the records of self-assessed pain intensity on the VAS and the VRS, self-reported by the same participants, were not interchangeable, perhaps lacking an appropriate method of interpretation, and that the pain intensity assessments on the VAS did not have linear properties. This agreed with the findings of the study done by Svensson in assessing the utilization of pain rating scales that were designed to evaluate the subjective variables.
Conclusion
The current study provided the theoretical bases upon which healthcare providers can easily interpret scores obtained from VAS with a greater level of certainty. More research is needed to explore the usability of this new method in day-to-day clinical practice.
References
1. Wewers M, Lowe N. A critical review of visual analogue scales in the measurement of clinical phenomena. Res Nurs Health. 1990;13(4):227-236. 2. Briggs M, Closs J. A descriptive study of the use of
visual analogue scales and verbal rating scales for the assessment of postoperative pain in orthopedic patients. J Pain Symptom Manage. 1999;18(6):438-446.
3. Salo D, Eget D, Lavery R, Garner L, Bernstein S, Tandon K. Can patients accurately read a visual analog pain scale? Am J Emerg Med. 2003;21(7):515-519. 4. Hjermstad M, Fayers P, Haugen D, et al. Studies
comparing numerical rating scales, verbal rating scales, and visual analogue scales for assessment of pain
intensity in adults: A systematic literature review. J Pain Symptom Manage. 2011;41(6):1073-1093. 5. Bolton JE, Wilkinson RC. Responsiveness of pain
scales: A comparison of three pain intensity measures in chiropractic patients. J Manipulative Physiol Ther. 1998;21(1):1-7.
6. Sindhu BS, Shechtman O, Tuckey L. Validity,
reliability, and responsiveness of a digital version of the visual analog scale. Journal of hand therapy. 2011;24(4):356-364.
7. Farrar JT, Portenoy RK, Berlin JA, Kinman JL, Strom BL. Defining the clinically important difference in pain outcome measures. Pain. 2000;88(3):287-294.
8. Fechner G, Howes D, Boring E. Elements of
psychophysics. New York: Holt, Rinehart & Winston; 1966.
9. McCormack HM, David JdL, Sheather S. Clinical applications of visual analogue scales: A critical review. Psychol Med. 1988;18(4):1007-1019.
10. Lara-Muñoz C, de Leon SP, Feinstein AR, Puente A, Wells CK. Comparison of three rating scales for measuring subjective phenomena in clinical research: I. use of experimentally controlled auditory stimuli∗∗
part II of this article will be published in the# 2, 2004 issue. Arch Med Res. 2004;35(1):43-48.
11. Downie WW, Leatham PA, Rhind VM, Wright V,
Branco JA, Anderson JA. Studies with pain rating scales. Ann Rheum Dis. 1978;37(4):378-381.
Journal of Advanced Pharmacy Education & Research | Apr-Jun 2019 | Vol 9 | Issue2 5
13. Fechner G. Elements dur psychophysics. Leipzig, Germany: Breitkopf and Hartel. 1860.
14. Thurstone LL. Psychophysical analysis. Am J Psychol. 1927;38(3):368-389.
15. Stevens SS. Psychophysics: Introduction to its perceptual, neural and social prospects. Routledge; 2017.
16. Baird JC. A cognitive theory of psychophysics. II: Fechner's law and stevens' law. Scand J Psychol. 1970;11(1):89-102.
17. Embretson SE, Reise SP. Item response theory for psychologists. Psychology Press; 2000.
18. Luce R, Suppes P. Representational measurement theory. In: Pashler H, Wixted J, eds. Methodology in experimental psychology. 3rd ed. New York: Wiley Online Library; 2002:1-41.
19. Falconer K. Fractals: A very short introduction. OUP Oxford; 2013.
20. Hawker GA, Mian S, Kendzerska T, French M.
Measures of adult pain: Visual analog scale for pain (vas
pain), numeric rating scale for pain (nrs pain), mcgill pain questionnaire (mpq), short‐form mcgill pain questionnaire (sf‐mpq), chronic pain grade scale (cpgs), short form‐36 bodily pain scale (sf‐36 bps), and measure of intermittent and constant osteoarthritis pain (icoap). Arthritis care & research. 2011;63(S11):S240-S252.
21. Jensen MP, Chen C, Brugger AM. Interpretation of visual analog scale ratings and change scores: A reanalysis of two clinical trials of postoperative pain. The Journal of Pain. 2003;4(7):407-414.
22. Svensson E. Concordance between ratings using different scales for the same variable. Stat Med. 2000;19(24):3483-3496.
6 Journal of Advanced Pharmacy Education & Research | Apr-Jun 2019 | Vol 9 | Issue2
Appendix 1:
(a) Intensity of pain by position of mark on 10-cm Visual Analogue Scale for Pain
Part I: 1 to 25 mm Part II: 26 to 50 mm Part III: 51 to 75 mm Part IV: 76 to 100 mm Position of
mark (mm) Intensity of pain
Position of
mark (mm) Intensity of pain
Position of
mark (mm) Intensity of pain
Position of
mark (mm) Intensity of pain
1 0 26 71 51 85 76 94
2 15 27 72 52 86 77 94
3 24 28 72 53 86 78 95
4 30 29 73 54 87 79 95
5 35 30 74 55 87 80 95
6 39 31 75 56 87 81 95
7 42 32 75 57 88 82 96
8 45 33 76 58 88 83 96
9 48 34 77 59 89 84 96
10 50 35 77 60 89 85 96
11 52 36 78 61 89 86 97
12 54 37 78 62 90 87 97
13 56 38 79 63 90 88 97
14 57 39 80 64 90 89 98
15 59 40 80 65 91 90 98
16 60 41 81 66 91 91 98
17 62 42 81 67 91 92 98
18 63 43 82 68 92 93 98
19 64 44 82 69 92 94 99
20 65 45 83 70 92 95 99
21 66 46 83 71 93 96 99
22 67 47 84 72 93 97 99
23 68 48 84 73 93 98 100
24 69 49 85 74 93 99 100
25 70 50 85 75 94 100 100
(b) Interpretation of an intensity of pain measurement on a 10-cm VAS for Pain
No pain Mild pain Moderate pain Severe pain