Annales Geophysicae, 23, 2579–2588, 2005 SRef-ID: 1432-0576/ag/2005-23-2579 © European Geosciences Union 2005
Annales
Geophysicae
A statistical study of intense electric fields at 4–7
R
E
geocentric
distance using Cluster
T. Johansson1, T. Karlsson1, G. Marklund1, S. Figueiredo1, P.-A. Lindqvist1, and S. Buchert2
1Division of Plasma Physics, Alfv´en Laboratory, Royal Institute of Technology, SE-100 44 Stockholm, Sweden 2Swedish Institute of Space Physics, Box 537, SE-751 21 Uppsala, Sweden
Received: 8 April 2005 – Revised: 20 June 2005 – Accepted: 27 June 2005 – Published: 14 October 2005
Abstract. Intense high-latitude electric fields (>150 mV/m mapped to ionospheric altitude) at 4–7RE geocentric dis-tance have been investigated in a statistical study, using data from the Cluster satellites. The orbit of the Cluster satellites limits the data collection at these altitudes to high latitudes, including the poleward part of the auroral oval. The occur-rence and distribution of the selected events have been used to characterize the intense electric fields and to investigate their dependance on parameters such as MLT, CGLat, alti-tude, and alsoKp. Peaks in the local time distribution are found in the evening to morning sectors but also in the noon sector, corresponding to cusp events. The electric field inten-sities decrease with increasing latitude in the region inves-tigated (above 60 CGLat). A dependence on geomagnetic activity is indicated since the probability of finding an event increases up toKp=5–6. The scales sizes are in the range up to 10 km (mapped to ionospheric altitude) with a maxi-mum around 4–5 km, consistent with earlier findings at lower altitudes and Cluster event studies. The magnitudes of the electric fields are inversely proportional to the scale sizes. The type of electric field structure (convergent or divergent) is consistent with the FAC direction for a subset of events with electric field intensities in the range 500–1000 mV/m and with clear bipolar signatures. The FAC directions are also consistent with the Region 1 and NBZ current systems, the latter of which prevail only during northward IMF con-ditions. For scale sizes less than 2 km the majority of the events were divergent electric field structures. Both converg-ing and divergconverg-ing electric fields were found throughout the investigated altitude range (4–7REgeocentric distance).
Keywords. Magnetospheric physics (Electric fields;
Auro-ral phenomena; Magnetosphere-ionosphere interactions)
1 Introduction
Converging electric fields associated with negative U-shaped potential structures, accelerating electrons downwards in the upward field-aligned current (FAC) region, have been
Correspondence to: T. Johansson
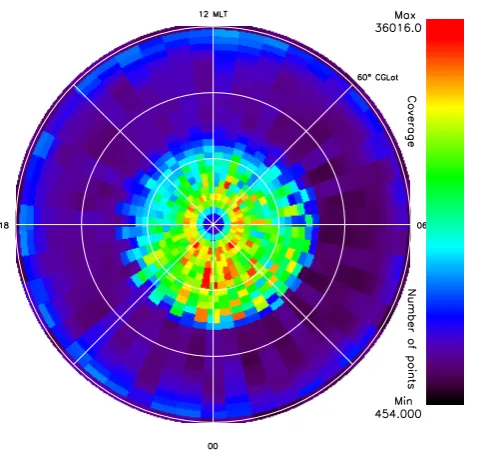
Fig. 1. A polar plot of the coverage of the Cluster satellites when they are within 7RE. The coverage is roughly limited to latitudes
greater than 75◦CGLat.
[image:2.595.314.538.67.405.2]intense diverging and converging electric fields have been observed by Cluster at high altitudes. Marklund et al. (2001) reported on the first Cluster observations in the return current region of the growth and decay of a diverging electric field structure at 4.3REgeocentric distance. Vaivads et al. (2003) concluded from magnetic conjugate observations by Cluster and DMSP in the upward current region that the U-shaped, quasi-stationary potential structure reached Cluster at 4.7RE geocentric distance. Figueiredo et al. (2005) reported on two Cluster converging electric field events. One of those events was in conjunction with observations by the ground-based South Pole All Sky-Imager, showing that the intense electric field variations were observed when Cluster crossed above an auroral arc structure at a geocentric distance of ap-proximately 4.6RE. Cluster observations of intense electric fields with monopolar signatures (indicating S-shaped poten-tial structures) in the return current region at 5.0RE geocen-tric distance were reported by Johansson et al. (2004). In that study, the temporal and spatial variations were described and investigated. The quasi-static electric fields were concluded to dominate the upward electron acceleration, since the most intense electric field variations were quasi-static, while re-gions of temporal variations (downward travelling Alfv´en waves) were less intense (Karlsson et al., 2004). Marklund et al. (2004) discussed the properties of four events of intense electric fields at Cluster altitudes, the results supporting the existence of quasi-static positive U-shaped and S-shaped po-tential structures in the return current region. To summarize, Cluster observations, published to date include both converg-ing and divergconverg-ing electric fields, but also monopolar elec-tric field structures, indicating that the perpendicular elecelec-tric
Fig. 2. The number of events versus electric field intensities are plotted in a histogram with bins of 100 mV/m.
field structures directly associated with particle acceleration map out to high altitudes. These event studies have provided much insight into the temporal and spatial variations of the electric field structures. Support has been found that quasi-static electric field acceleration plays a major role in the ac-celeration of auroral particles and that the process is more or less always accompanied by Alfv´en waves. Further, Keiling et al. (2001) have reported on Polar electric field observa-tions in the primary current region that are consistent with both Alfv´en wave activity and quasi-static structures. Most of their events, of which a large fraction were interpreted to be Alfv´enic, occurred in the poleward part of the plasma sheet boundary layer (PSBL). As shown by Johansson et al. (2004) intense quasi-static electric field structures were also found in that region.
T. Johansson et al.: Study of intense electric fields at 4–7REgeocentric distance 2581
2 Method
This statistical study used EFW electric field data (Gus-tavsson et al., 1997) from all four Cluster satellites from a 33-month period (1 January 2001, to 28 September, 2003). The data set was examined by searching for electric field peaks, using the duskward and sunward components of at least 150 mV/m, and then mapping to the ionospheric alti-tude using the dipole magnetic field approximation (Weimer and Gurnett, 1993). Further, the peaks should be observed when Cluster was located within 7RE geocentric distance, to avoid a more complicated mapping. For each part of the orbit where the satellites were approaching or receding from the north or south pole, the most intense peak meeting the se-lection criteria was recorded and used in the database (such an entry is called an event), where also MLT (Magnetic Local Time), CGLat (Corrected Geomagnetic Latitude), geocentric distance, L-value and scale size were recorded. The scale sizes were found by first determining the full-width half-maximum of the intense electric field events, giving a tem-poral scale which, together with the spacecraft velocity, give a spatial scale. For reference, the scale sizes were mapped to the ionosphere. No distinction has been made between events found by the different satellites. In order to obtain a good understanding of the occurrence of these events, the coverage of the Cluster satellites was also recorded. This is important since the orbit of the Cluster satellites gives the highest coverage at high latitudes. TheKp-index has been used to investigate the relation of the intense electric fields to the geomagnetic activity. As will be discussed later, FACs were also calculated for some of the events. This was done by assuming current sheets and using the magnetic field mea-sured by the FGM instrument (Balogh et al., 1997) from each single satellite, to which a polynomial function was fitted in a large-time window and inspected manually, after which the background magnetic field was subtracted.
3 Observations
The occurrence, distribution and relation of the selected in-tense electric fields to MLT, CGLat, geocentric distance, scale size andKp will be presented in this section. A sub-set of events, with intensities in the range 500–1000 mV/m (mapped to ionospheric altitude), were further examined to identify whether the electric field structure was divergent or convergent and to determine the direction of the associated FAC.
[image:3.595.310.536.64.382.2]Due to the orbits of the four Cluster satellites, the coverage is much better at high latitudes and there is also a close cou-pling between altitude and latitude, which has to be kept in mind when interpreting the statistical results. Figure 1 shows the total number of measurement points recorded by Clus-ter (at geocentric distances less than 7RE) in each bin (1◦in CGLat and 0.5 h in MLT) during the investigated period. The plot clearly illustrates that a majority of the possible recorded points are confined to high latitudes where the coverage is
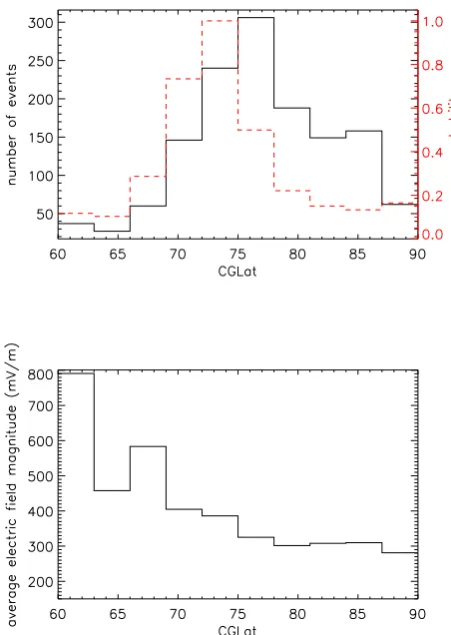
Fig. 3. The number of events versus CGLat in a histogram with bins of three degrees (black line) and the probability of finding an event (dashed red line) are plotted in panel 1. Panel 2 displays the average electric fields in each bin. Each bin is three degrees wide.
high and that the most equatorward of those points corre-sponds to the poleward part of the auroral oval. The average geocentric distance when the Cluster satellites were at geo-centric distances below 7REhas been calculated and it was found that the altitudes, on average, are higher at higher lati-tudes.
A total number of 1373 events have been found. Very few events have mapped intensities exceeding 800 mV/m, and the majority of the events are found in the range 250–350 mV/m. This can be seen in the histogram in Fig. 2, showing the num-ber of events for bins of electric field intensity.
3.1 Location
Fig. 4. Similar plot as in Fig. 3 but this time the geocentric distance is plotted on the x-axis. Each bin is 0.5REwide.
a given CGLat. The bottom panel in Fig. 3 displays the av-erage electric field for each bin. The maximum number of events are found at 75◦CGLat but when the coverage of the Cluster satellites is taken into account, one can seen that the probability of finding an event shifts to lower latitudes (72– 75◦CGLat). The average electric fields drops rapidly with increasing latitude, which also corresponds to the increasing altitude in this data set. It is expected that the intense electric fields are mostly associated with auroral acceleration struc-tures and intense FACs (primary and return current) on auro-ral field lines, which correspond to the lower latitude range of this study, and this is consistent with the results seen in Fig. 3.
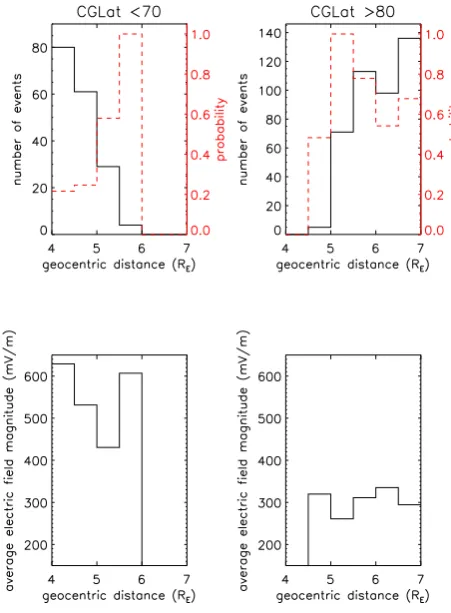
Figure 4 displays the dependence on geocentric distance. A surprising decrease in the number of events is found at high altitudes, above 5.5RE geocentric distance. These high alti-tudes correspond to high latialti-tudes. The probability decreases in the same range and a decrease of the average electric field with increasing geocentric distance is also observed. The de-crease is, however, supposedly more due to a latitude effect than to an altitude effect. The fewer and less intense elec-tric field events found at higher altitudes corresponds to very high latitudes, due to the co-dependence between altitude and latitude, far from the main auroral oval and auroral activity.
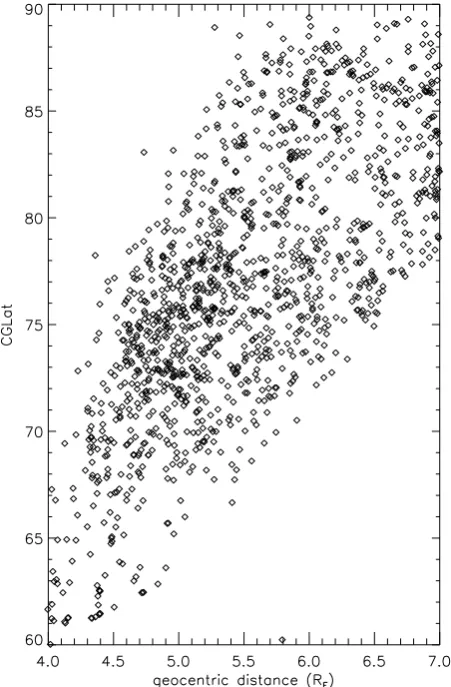
Fig. 5. CGLat versus geocentric distance, displaying the fact that the higher the altitude at which the event is found, the higher the latitude. Each diamond represent an event.
[image:4.595.314.540.67.411.2]T. Johansson et al.: Study of intense electric fields at 4–7REgeocentric distance 2583
Fig. 6. Similar plot as in Fig. 3 but this time only for events at a CGLat below 70◦(left column) and events at CGLat above 80◦ (right column). Each bin is 0.5REwide.
distribution plot for all events show a beginning decrease at 5RE and the high-latitude events also display a decrease starting at 5RE. So, this indicates that the observed peaks in event probability seen in the altitude and latitude distribu-tions are both due to a latitudinal effect.
The upper panel of Fig. 7 displays the number of events versus MLT, each bin corresponding to a 2-h interval. Two peaks in the MLT-distribution are seen, one peak in the noon sector (of which a majority probably is cusp events) and one peak in the night sector. An asymmetry between the morn-ing and afternoon sectors can be observed, with an abso-lute minimum at 04:00–06:00 MLT. The higher probabil-ity of finding an event around 15:00 MLT might be con-nected to the hot spot, a region of enhanced electron ac-celeration events (Newell et al., 1996). The probability of finding events follows the total number of events (there is a good coverage for all local times). As seen in the sec-ond panel, the average electric field is lower at noon and higher for the evening events. When separating low-latitude events from high-latitude events, it was found that none of the events in the 12:00–16:00 MLT bin occurred at latitudes below 70◦CGLat (not shown here).
[image:5.595.313.536.67.394.2]The seasonal dependence of the MLT distribution has also been investigated (not shown here). Spring and fall (defined as the three months centered at spring and vernal equinox,
Fig. 7. Similar plot as in Fig. 3 but this time the MLT is plotted on the x-axis. Each bin is two hours wide.
respectively) have the same characteristics as the overall pic-ture. The events occurring at winter times have two pro-nounced peaks in the MLT distribution, one in the morn-ing sector (02:00–08:00 MLT) and one in the evenmorn-ing sec-tor (16:00–20:00 MLT), and there is a clear minimum at noon. The summer events have coarsely the same MLT distribution but the highest number of events are found at 14:00–16:00 MLT. The average electric field shows the same trend for winter and summer, somewhat higher in the after-noon/evening sector.
3.2 Scale size
Fig. 8. The two first panels are similar to the panels in Fig. 3 but this time the scale size is plotted on the x-axis. Each bin is 1 km wide. The third panel displays an approximative potential calculated from the average electric field intensity and scale size in each bin.
[image:6.595.53.278.65.395.2]scale size value corresponds well with earlier observations of intense electric fields, as well as with the size of auroral arcs (Borovsky, 1993). The number of events fall rapidly with in-creasing scale size and relatively few events are found with scale sizes larger than 10 km. The middle panel shows that the average electric field is increasing with decreasing scale size below 10 km and is relatively constant above 10 km. That the electric field magnitudes are inversely proportional to the scale sizes were also observed by Karlsson and Mark-lund (1996). Since there are very few events at larger scale sizes, the average values for those scale sizes are not reliable. The bottom panel shows that for the smaller scale sizes there is a small increase in potential with increasing scale size up to 18 km, from 0.5 kV to 2.0 kV. Similar values of the po-tentials have been found in Cluster event studies (Marklund et al., 2004) and at lower altitudes in Freja studies (Karls-son and Marklund, 1996). The trend also continues in the upper, unreliable range of scale sizes, where the increase is larger. The scale sizes of high-latitude events (>80◦CGLat) and low-latitude events (<70◦CGLat) have also been com-pared but the results were unclear and no distinct difference in scale size was found.
Fig. 9. The first panel displays the number of events versus CGLat for two groups of events, divided by theKpvalue. The dashed blue
linen isKp≤3 and the red line isKp>3. Each bin is 3 degrees wide. The second panel displays the number of events (black line) and the probability of finding an event (dashed red line) versusKp. The green (blue) line is the number of events for events found above 80◦(below 70◦) CGLat. Each bin represents one unit inKp.
3.3 Geomagnetic conditions
TheKp-index has been used to investigate the effect of the geomagnetic activity on the distribution and occurrence of the intense electric field events. The first panel of Fig. 9 dis-plays the CGLat distribution for two groups of events, one withKp≤3 (dashed blue line) and one withKp>3 (solid red line). The low activity events have a peak in number of events at 75–78◦CGLat, while the high activity events have a peak at somewhat lower latitudes (72–75◦CGLat). So, the CGLat distribution is shifted to lower latitudes at more active pe-riods, reflecting the movement of the auroral oval towards lower latitudes during more active periods. The high activ-ity events correspond to higher average electric fields at most latitudes (the difference is greater at lower latitudes) and for most local times (the difference is greater in the morning and evening sectors, not shown here), decreasing with increasing latitude from 900 mV/m to 250 mV/m.
T. Johansson et al.: Study of intense electric fields at 4–7REgeocentric distance 2585
Table 1. Summary of the events.
FAC Electric field structure Number of events
Up Converging 17
Down Diverging 25
Up Diverging 1
Down Converging 2
Unclear Converging or diverging 9
black and dashed red lines) versusKp. The green (blue) line is the number of events found above 80◦(below 70◦) CGLat. It can be seen that most events occur in periods of medium geomagnetic activity (Kp=1–4) and that few events are found for very active (Kp>4) or very quiet conditions (Kp<1). However, the probability of finding an event in-creases with increasingKp-value, although the limited num-ber of events for the highestKp values make the calculated probability unreliable. Since a vast majority of the events are found forKp≤4, the probability is reliable in that range and there the probability of finding an event is increasing with increasing Kp. The maximum average electric field mag-nitudes are found in the range Kp=4–6 at approximately 500 mV/m. The high-latitude events (>80◦CGLat) have a peak in the number of events betweenKp=1 and 3 but the peak for the low-latitude events (<70◦CGLat) is atKp=4. The difference is again an effect of the auroral activity vary-ing in latitude due to the geomagnetic activity. The average electric field magnitudes are again found to be the highest for low-latitude events, the peak is atKp=5 while the aver-age electric field magnitudes of the high-latitude events are fairly constant for allKp-values.
3.4 Convergent/divergent electric fields and associated FACs for a selected number of events
[image:7.595.57.279.87.166.2]Those events with electric field intensities in the range 500– 1000 mV/m were inspected manually. If an event was found to have a clear bipolar signature, it was selected for further investigation. The potential structure of the event was deter-mined by calculating the perpendicular potential, by integra-tion of the measured electric field along the satellite orbit. A positive (negative) peak in the potential indicates a diverging (converging) electric field that accelerates electrons upwards (downwards), which should be associated with downward (upward) FACs. Magnetic field measurements were used to calculate the FAC in each of these events to check the consis-tency between the electric field structure and the FAC direc-tion. The result is summarized in Table 1. For some of the events it was not possible to clearly determine the FAC direc-tion, they are labelled “unclear” in Table 1. The electric field type is for most of the events consistent with the FAC direc-tion. However, for three events an inconsistency is found be-tween the FAC and the potential structure. These events are the subject of a further, on-going investigation. However, a
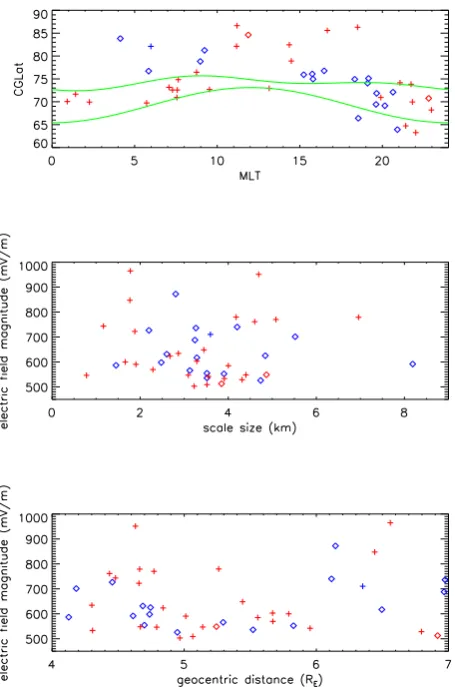
Fig. 10. The upper panel is a scatter plot of CGLat versus MLT with a statistical auroral oval indicated by the green lines. Converging (diverging) electric field structures are plotted with a diamond (+). Downward (upward) FACs are plotted in red (blue). The middle panel is a scatter plot of the electric field intensity versus scale size, while the bottom panel is a scatter plot of the electric field intensity versus geocentric distance.
fairly good number of events of both diverging and converg-ing structures, with consistent FAC directions, are found.
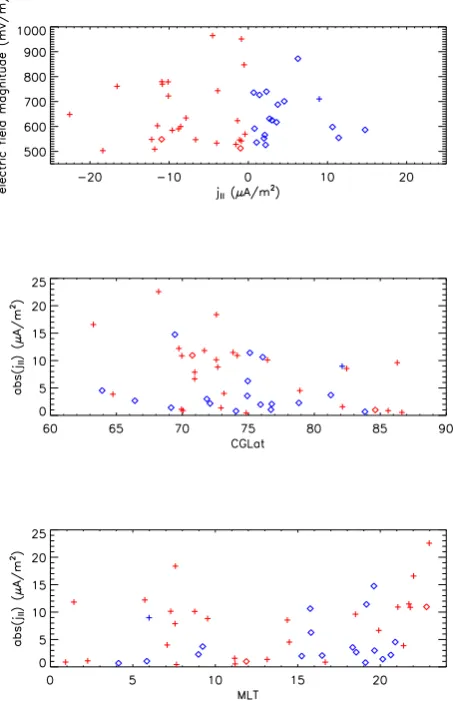
Fig. 11. The upper panel displays the electric field intensity versus the FAC magnitudes while the other two panels display the FAC magnitudes versus the electric field intensity and MLT, respectively, all in the form of scatter plots. The plotting symbols and colors are as in Fig. 10.
[image:8.595.53.280.64.415.2]downward FAC, on the other hand, occur within the statis-tical auroral oval in the morning sector but at higher lati-tudes in the noon/afternoon sectors. There are also events of downward FAC at lower latitudes in the evening sector. The general trend is that the small-scale FACs have direc-tions which are consistent with the large scale Region 1 cur-rents and, at higher latitudes, with the NBZ-current system (Iijima and Shibaji, 1987) prevailing during northward IMF conditions. In the middle panel of Fig. 10 the magnitudes of the electric field events are plotted versus their scale sizes. All events are small scale but the events below 2 km are dom-inated by downward FAC diverging electric field structures. Most events are observed to have scale sizes in the range 3– 4 km, somewhat smaller than the 4–5 km range seen in Fig. 8, obtained from all events. The bottom panel in Fig. 10 dis-plays the magnitude of the electric field events versus alti-tude. No clear difference between diverging and converging electric fields can be seen in the altitude distribution, but both types are found throughout the altitude range covered in this study (4–7REgeocentric distance).
Figure 11 displays the electric field intensity versus the FAC magnitudes in the upper panel, while the other two pan-els display the FAC magnitudes versus the electric field in-tensity and MLT, respectively. It is seen in the middle and lower panels of Fig. 10, and also in the upper panel of Fig. 11, that a majority of the most intense events (>750 mV/m) are diverging electric field structures associated with downward FACs. The FACs with the largest magnitudes (>7µA/m2, mapped to the ionosphere) are mostly downward FACs. However, no correlation between electric field intensity and FAC magnitude can be observed for these events. The high-est magnitudes of the FAC are found at latitudes correspond-ing to the auroral oval and in the morncorrespond-ing and evencorrespond-ing sec-tors, together with a few events of high FAC magnitude close to 15:00 MLT, as seen in the two last panels of Fig. 11.
In the subset of events it is clear that diverging electric fields at low latitudes are likely to occur in the evening and morning sectors (first panel of Fig. 10 and bottom panel of Fig. 11). The diverging electric fields at high latitudes are found in the afternoon sector. This is, for the low-latitude events, consistent with earlier Freja studies (Karlsson and Marklund, 1996; Marklund et al., 1997).
4 Discussion and conclusions
We have presented results of a statistical investigation of intense electric fields (>150 mV/m) observed by Cluster at geocentric distances of 4–7RE and a latitudinal coverage corresponding to very high latitudes from the poleward part of the auroral oval and the entire polar cap.
Due to the orbit of the Cluster satellites, there is a co-dependance between latitude and altitude. This makes the interpretation of the electric field latitude and altitude distri-butions more complicated. To resolve this ambiguity, high and low latitude events were separated into two groups. For each of the two groups the number of events, the probability of finding an event and the average electric field were plotted versus the geocentric distance. The observed peak in the alti-tude distribution could then be explained as due to latitudinal variations.
T. Johansson et al.: Study of intense electric fields at 4–7REgeocentric distance 2587 2003; Marklund et al., 2004) show that both diverging and
converging electric field structures do extend to Cluster alti-tudes. Figueiredo et al. (2005) found a Cluster converging electric field event at a geocentric distance of approximately 4.6RE, conjugated with an auroral arc structure observed by the ground-based South Pole All-Sky Imager. Janhunen et al. (1999) discarded some events since they were either consid-ered to have too small potentials (1–2 kV) or that were too small they were not consistent with U-shaped potential struc-tures. In the Cluster observations, perpendicular potentials inferred from electric field measurements in the range 2–3 kV have been shown to be consistent with the characteristic en-ergies of electron beams (e.g. Marklund et al. (2004)). Fur-ther, monopolar electric fields, indicating S-shaped potential structures, have been observed by Cluster (Johansson et al., 2004). For the larger set of events in this study where the types of electric field structures have not been determined, it is reasonable to believe that there are both diverging and con-verging electric fields corresponding to U-shaped potentials structures, as well as S-shaped potential structures.
The direction of the FACs associated with the subset of intense electric field events are found to occur consistently with those of the large-scale Region 1 and NBZ current sys-tems. It is not obvious why the small-scale current systems should match the large-scale current systems but the fact that they do, supports the picture of the large current system being roughly the sum of the small-scale current systems.
The average electric field magnitudes are found to be smaller at higher latitudes, implying that the high-latitude auroral events are typically less intense than those at lower latitudes in the auroral oval. The probability of finding an intense electric field event also decreases above 75◦CGLat.
The events found at noon are all observed above 70◦CGLat,
i.e. these events are likely to occur in the cusp region (Mark-lund et al., 1990; Palmroth et al., 2001). The conclusion is that the observed intense electric fields are most likely to be found within the auroral oval, although there are also obser-vations of events at higher latitude in the polar cap.
Borovsky (1993) give the scale sizes of the most fine-structured auroral arc elements as approximately 100 m, while the scale sizes of auroral arcs are one order of mag-nitude larger and the region of diffuse glow around auroral arcs are some hundreds of km. In a statistical study of intense electric fields observed by Freja (Karlsson and Marklund, 1996) the typical scale size were found to be less than 5 km. In this study the scale sizes of the electric field structures are mostly less than 10 km (mapped values), with the number of events peaking in the range 4–5 km, consistent with what has been observed in Cluster event studies of intense con-verging/diverging electric field structures associated with the auroral current system (for example, Marklund et al. (2004)). Theoretical predictions give scale sizes in approximately the same range (Borovsky, 1993). The events having the small-est scale sizes were associated with the highsmall-est average elec-tric fields, as found by Karlsson and Marklund (1996). It is also found in this study that diverging electric field structures (in the subset of events) are associated with smaller scale
sizes than converging electric field structures.
The MLT distribution is found to have peaks in the late evening to early morning sectors (consistent with Karlsson and Marklund, 1996) and in the noon sector, where the sec-ond peak correspsec-onds to high-latitude cusp events. The day-side events observed by Karlsson and Marklund (1996) were found at more geomagnetic active periods but no dependency on geomagnetic activity was found for the midnight and early morning events. In this study the occurrence of events was found to increase with increasingKp value, i.e. for greater geomagnetic activity. This discrepancy in the midnight and morning sectors might be explained by the geomagnetic ac-tivity having a greater effect at higher altitudes and latitudes. The activity dependence is also seen as variations in the lati-tude distribution, consistent with the equatorward movement of the auroral oval during more active periods. Low activity events have a peak in number of events at higher latitudes compared with the high activity events.
Keiling et al. (2001) have used Polar data to study the dis-tributions of the electric fields in the auroral oval. A majority of their events were found in the nightside auroral oval but a concentration of events was also found around 15:00 MLT, which they contribute to the hot spot (a region of increased low-latitude acceleration activity (Newell et al., 1996)). The MLT distribution found in this study is consistent with the nightside peak found by Keiling et al. (2001). A peak in MLT distribution is not seen around 15:00 MLT. However, since this study also cover high latitudes, including a peak of cusp events at noon, an afternoon peak in the MLT distribu-tion might not be revealed. More events are tough found in the afternoon sector as compared to the late morning sector. Further, Keiling et al. (2001) found that all their most intense events occurred at periods of geomagnetic disturbances. The events found in this study occur mostly in periods of medium geomagnetic activity, with an increasing probability up to at least Kp=4. Keiling et al. (2001) also reported that they found most of their intense events in the plasma sheet bound-ary layer (PSBL), and with a smaller part occurring in the central plasma sheet (CPS). The location of the events of this study relative to the PSBL or CPS has not been determined from particle data. This is the subject of an on-going inves-tigation which also looks at the relation of the kind of elec-tric field structure (monopolar or bipolar) to different density gradients.
Acknowledgements. This work was supported by the Swedish Na-tional Space Board and the Royal Institute of Technology. One of the authors, S. Figueiredo, acknowledges the support of the Fundac¸˜ao para a Ciˆencia e a Tecnologia (FCT) under the grant SFRH/BD/6211/2001. We want to thank D. J. McComas of South-west Research Institute and N. Ness of Bartol Research Institute and CDAWeb for providing ACE solar wind data.
Topical Editor T. Pulkkinen thanks A. Aikio and A. Keiling for their help in evaluating this paper.
References
Balogh, A., Dunlop, M., Cowley, S., Southwood, D., Thomlinsson, J., Glassmeier, K., Musmann, G., L¨uhr, H., Buchert, S., Acu˜na, M., Fairfield, D., Slavin, J., Riedel, W., Schwingenschuh, K., and Kievelson, M.: The Cluster magnetic investigation, Space Sci. Rev., 79/1–2, 65–91, 1997.
Borovsky, J.: Auroral arc thickness as predicted by various theories, J. Geophys. Res., 98, 6101–6138, 1993.
Figueiredo, S., Marklund, G. T., Karlsson, T., et al.: Temporal and spatial evolution of discrete auroral arcs as seen by Cluster, Ann. Geophys., accepted, 2005.
Gustavsson, G., Bostr¨om, R., Holback, B., Holmgren, G., Lund-gren, A., Stasiewicz, K., ˚Ahl´en, L., Mozer, F., Pankow, D., Har-vey, P., Berg, P., Ulrich, R., Pedersen, A., Schmidt, R., Butler, A., Fransen, A., Klinge, D., Thomsen, M., F¨althammar, C.-G., Lindqvist, P.-A., Christenson, S., Holtet, J., Lybekk, B., Stein, T., Tanskanen, P., Lappalainen, K., and Wygant, J.: The Electric Field and Wave Experiment for the Cluster mission, Space Sci. Rev., 79/1–2, 137–156, 1997.
Iijima, T. and Shibaji, T.: Global characteristics of northward IMF-associated (NBZ) field-aligned currents, J. Geophys. Res., 92, 2408–2424, 1987.
Janhunen, P. and Olsson, A.: New model for auroral acceleration: O-shaped potential structure cooperating with waves, Ann. Geo-phys., 18, 596–607, 2000,
SRef-ID: 1432-0576/ag/2000-18-596.
Janhunen, P., Olsson, A., Mozer, F., and Laakso, H.: How does the U-shaped potential close above the acceleration region? A study using Polar data, Ann. Geophys., 17, 1276–1283, 1999, SRef-ID: 1432-0576/ag/1999-17-1276.
Janhunen, P., Olsson, A., and Laakso, H.: The occurrence frequency of auroral potential structures and electric fields as a function of altitude using Polar/EFI data, Ann. Geophys., 22, 1233–1250, 2004,
SRef-ID: 1432-0576/ag/2004-22-1233.
Johansson, T., Figueiredo, S., Karlsson, T., Marklund, G., Fazak-erley, A., Buchert, S., Lindqvist, P.-A., and Nilsson, H.: Intense high-altitude auroral electric fields – temporal and spatial char-acteristics, Ann. Geophys., 22, 2485–2495, 2004,
SRef-ID: 1432-0576/ag/2004-22-2485.
Karlsson, T. and Marklund, G.: A statistically study of intense low-altitude electric fields observed by Freja, Geophys. Res. Lett., 23, 1005–1008, 1996.
Karlsson, T., Marklund, G., Figueiredo, S., Johansson, T., and Buchert, S.: Separating spatial and temporal variations in auroral and magnetic fields by Cluster multipoint measurements, Ann. Geophys., 22, 2463–2472, 2004,
SRef-ID: 1432-0576/ag/2004-22-2463.
Kauristie, K.: Statistical fits for auroral oval boundaries during the substorm sequence, J. Geophs. Res., 100, 21 885–21 895, 1995. Keiling, A., Wygant, J., Cattell, C., Johnson, M., Temerin, M.,
Mozer, F., Kletzing, C., Scudder, J., and Russell, C.: Properties of large electric fields in the plasma sheet at 4-7RE measured
with Polar, J. Geophs. Res., 106, 5779–5798, 2001.
Marklund, G., Blomberg, L., F¨althammar, C.-G., Erlandsson, R., and Poterma, T.: Signatures of the high-altitude polar cusp and dayside aurorla regions as seen by the Viking electric field exper-iment, J. Geophs. Res., 95, 5767–5780, 1990.
Marklund, G., Karlsson, T., and Clemmons, J.: On low-altitude par-ticle acceleration and intense electric fields and their relation to black aurora, J. Geophs. Res., 102, 17 509–17 522, 1997. Marklund, G., Ivchenko, N., Karlsson, T., Fazakerley, A., Dunlop,
M., Lindquist, P.-A., Buchert, S., Owen, C., Taylor, M., Vaivalds, A., Carter, P., Andr´e, M., and Balogh, A.: Temporal evolution of the electric field accelerating electrons away from the auroral ionosphere, Nature, 414, 724–727, 2001.
Marklund, G., Karlsson, T., Figueiredo, S., Johansson, T., Lindqvist, P.-A., Andr´e, M., Buchert, S., Kistler, L., and Faza-kerley, A.: Characteristics of quasi-static potential structures ob-served in the auroral return current region by Cluster, Nonlinear Processes in Geophysics, 11, 709–720, 2004.
McFadden, J., Carlson, C., and Ergun, R.: Microstructures of the auroral acceleration region as observed by FAST, J. Geophs. Res., 104, 14 453–14 480, 1999.
Newell, P., Lyons, K., and Meng, C.-I.: A large survey of electron acceleration events, J. Geophs. Res., 101, 2599–2614, 1996. Palmroth, M., Laakso, H., and Pulkkinen, T.: Location of
high-altitude cusp during steady solar wind conditons, J. Geophs. Res., 106, 21 109–21 122, 2001.
Vaivads, A., Andre, M., Buchert, S., Eriksson, A., Olsson, A., Wahlund, J.-E., Janhunen, P., Marklund, G., Kistler, L., Mouikis, C., Winningham, D., Fazakerley, A., and Newell, P.: Discrete au-roral arc, electroststic shock and suprathermal electrons powered by dispersive, anomalously resistive field line resonance, Geo-phys. Res. Lett., 30, doi:10.1029/2002GL016 006, 2003. Weimer, D. and Gurnett, D.: Large-Amplitude Auroral electric