www.geosci-model-dev.net/8/1709/2015/ doi:10.5194/gmd-8-1709-2015
© Author(s) 2015. CC Attribution 3.0 License.
Improving the ISBA
CC
land surface model simulation of water and
carbon fluxes and stocks over the Amazon forest
E. Joetzjer1, C. Delire1, H. Douville1, P. Ciais2, B. Decharme1, D. Carrer1, H. Verbeeck3, M. De Weirdt3, and D. Bonal4 1CNRM-GAME UMR3589, Groupe d’étude de l’atmosphère météorologique, 31000 Toulouse, France
2Laboratory of Climate Sciences and the Environment (LSCE), Joint Unit of CEA-CNRS, L’Orme des Merisiers,
91191 Gif-sur-Yvette, France
3CAVElab Computational and Applied Vegetation Ecology, Department of Applied Ecology and Environmental Biology,
Faculty of Bioscience Engineering, Ghent University, Coupure Links 653, 9000 Ghent, Belgium
4INRA, UMR EEF, 54280 Champenoux, France
Correspondence to: E. Joetzjer ([email protected])
Received: 15 December 2014 – Published in Geosci. Model Dev. Discuss.: 11 February 2015 Revised: 7 May 2015 – Accepted: 15 May 2015 – Published: 10 June 2015
Abstract. We evaluate the ISBACC (Interaction Soil
Bio-sphere AtmoBio-sphere Carbon Cycle) land surface model (LSM) over the Amazon forest, and propose a revised param-eterization of photosynthesis, including new soil water stress and autotrophic respiration (RA) functions. The revised
ver-sion allows the model to better capture the energy, water and carbon fluxes when compared to five Amazonian flux tow-ers. The performance of ISBACC is slightly site dependent
although similar to the widely evaluated LSM ORCHIDEE (Organizing Carbon and Hydrology In Dynamic Ecosystems – version 1187), which is based on different assumptions. Changes made to the autotrophic respiration functions, in-cluding a vertical profile of leaf respiration, lead to yearly simulated carbon use efficiency (CUE) and carbon stocks which is consistent with an ecophysiological meta-analysis conducted on three Amazonian sites. Despite these major im-provements, ISBACC struggles to capture the apparent
sea-sonality of the carbon fluxes derived from the flux tower esti-mations. However, there is still no consensus on the season-ality of carbon fluxes over the Amazon, stressing a need for more observations as well as a better understanding of the main drivers of autotrophic respiration.
1 Introduction
The Amazon rainforest plays a crucial role in the regional energy, water and carbon cycles, thereby modulating the global climate system. The forest recycles about 25–35 % of the Amazonian precipitation through evapotranspiration (Eltahir and Bras, 1994) and stores about 10–15 % of the global aboveground biomass (e.g., Potter and Klooster, 1999; Malhi et al., 2006; Beer et al., 2010; Pan et al., 2011). De-spite intense deforestation and land use change, this region has acted as a long-term carbon sink (Phillips et al., 2008; Gatti et al., 2010, 2014; Gloor et al., 2012; Espírito-Santo et al., 2014), meaning that the carbon uptake by photosynthe-sis exceeded on average the carbon released by autotrophic respiration (RA) and decomposition.
Given the strong coupling between climate and the car-bon cycle and the emergence of holistic Earth system mod-els (ESMs), modeling the Amazon rainforest is a signifi-cant project. However, carbon balance projections are still highly uncertain, especially in the tropics (Friedlingstein et al., 2006; Jones et al., 2013; Anav et al., 2013; Hunting-ford et al., 2013). Beyond the scenario of anthropogenic CO2
emissions, key uncertainties are related to the carbon cycle response to a given scenario which depends on both model-dependent regional climate sensitivity (Berthelot et al., 2005; Ahlström et al., 2012) and model-dependent representation of carbon fluxes and stocks themselves (Dalmonech et al., 2014; Huntingford et al., 2013).
Most land surface models (LSMs) still struggle to capture the seasonal pattern of the net ecosystem carbon exchange (NEE) over the Amazon basin (Saleska et al., 2003; Baker et al., 2008; Verbeeck et al., 2011), which is defined as the dif-ference between the carbon released by both heterotrophic respiration (RH) andRAand taken up through
photosynthe-sis by gross primary productivity (GPP). Recent model de-velopments have focused on improving the seasonality of the simulated GPP, using an improved soil hydrology (Fisher et al., 2007; Baker et al., 2008; Grant et al., 2009), optimiz-ing model’s parameters (Verbeeck et al., 2011) or, and with more success, implementing new phenological processes (De Weirdt et al., 2012; Kim et al., 2012). Despite its major role in the carbon balance, less attention has been paid to ecosystem respiration (RECO) (Atkin et al., 2014; Rowland et al., 2014).
Ecosystem respiration is the sum of RH andRA and is the
result of multiple contributions (roots, wood, leaves forRA
and litter, soil carbon forRH) that are all influenced by
sev-eral environmental factors (temperature, soil water content (SWC), microbial dynamics). Ecosystem respiration plays a major role in explaining inter-annual variability of NEE at many forest ecosystems (Valentini et al., 2000; Saleska et al., 2003; Rowland et al., 2014).
In this paper, we evaluate the ISBACC (Interaction Soil
Biosphere Atmosphere Carbon Cycle) (Gibelin et al., 2008) LSM over the Amazon forest using in situ measurements and propose an alternative parameterization of both photosynthe-sis andRA. Such a focus is justified not only because ISBACC
has never been really evaluated on tropical rainforests, but also because ISBACC has been recently implemented in the
CNRM (Centre National de Recherches Météorologiques) ESM to participate in the forthcoming phases of CMIP (Cou-pled Model Intercomparison Project) and C4MIP (Cou(Cou-pled Climate Carbon Cycle Model Intercomparison Project). In CMIP3, some early ESMs projected a possible Amazon dieback (represented as the depletion of ecosystem carbon pools) at the end of the 21st century (Cox et al., 2000, 2013; Huntingford et al., 2013). Such dramatic projections are, however, very uncertain, depending for instance on the pro-jected change in precipitation and dry-season length (Good et al., 2013), on the response of forest water-use efficiency (Keenan et al., 2013), and therefore on the accuracy of the
water and carbon stocks and fluxes simulated at the land sur-face.
Here we conduct a step-by-step evaluation of the ISBACC
LSM against in situ observations collected at five instrumen-tal sites over the Amazon forest. To illustrate rather than re-ally quantify model uncertainties, we also compare ISBACC
to the ORCHIDEE (Organizing Carbon and Hydrology In Dynamic Ecosystems – version 1187) LSM (Krinner et al., 2005), which is based on different assumptions for the repre-sentation of photosynthesis, carbon allocation and growth. In Sect. 2, we first briefly describe both models and the available observations. In Sect. 3, we propose alternative parameteriza-tions of photosynthesis and photosynthesis sensitivity to soil water stress and ofRA in ISBACC. In Sect. 4, we compare
the skill of the various ISBACCparameterizations to capture
the observed water and carbon fluxes and stocks. The main conclusions are summarized in Sect. 5.
2 Material and method
2.1 Observations
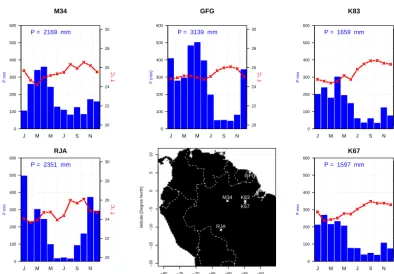
To evaluate carbon and water fluxes over the Amazon trop-ical forest, we use field measurements of five eddy flux towers in Amazonia. Four towers are located in Brazil and were established during the LBA (Large-scale Biosphere– Atmosphere) project (Da Rocha et al., 2009): Manaus km34 (M34), Santarem km67 (K67) and km83 (K83) and Reserva Jaru (JRU). The fifth tower is the Guyaflux tower (GFG) located at Paracou in French Guiana (Bonal et al., 2008). At JRU the forest is a semi-deciduous forest, whereas the other sites are representing typical tropical rainforests. Site location is shown in Fig. 1 together with the corresponding monthly mean climatologies of temperature and precipita-tion. Large seasonal variations in precipitation are found at GFG and JRU, the two wettest sites, in contrast with the other sites. Most data sets can be downloaded from the LBA web-site. For a detailed description of each site, please refer to the literature indicated in Table 1 or Costa et al. (2010) and Baker et al. (2013) for a comparative analysis of the Brazilian sites.
J M M J S N
M34
P mm
0 100 200 300 400 500 600
T °C
20 22 24 26 28 30 P = 2169 mm
J M M J S N
GFG
P (mm)
0 100 200 300 400 500 600
20 22 24 26 28 30
T °C
P = 3139 mm
J M M J S N
K83
P mm
0 100 200 300 400 500 600
T °C
20 22 24 26 28 30 P = 1659 mm
J M M J S N
RJA
P mm
0 100 200 300 400 500 600
T °C
20 22 24 26 28 30 P = 2351 mm
−80 −75 −70 −65 −60 −55 −50
−20
−15
−10
−5
0
5
10
longitude [Degree East]
latitude [Degree Nor
th]
K83
RJA M34
K67 GFG
J M M J S N
K67
P mm
0 100 200 300 400 500 600
T °C
20 22 24 26 28 30 P = 1597 mm
Figure 1. Mean annual cycle of precipitation (blue) and temperature (red) calculated over 3 years (see Table 1), and the location of the flux
towers used in this study.
Table 1. Characteristics and references of flux towers used in this study.
Site Code Cover period Texture (fraction) Root depth Soil depth References
Manaus km34 M34 2003→2005 CLAY=0.68; SAND=0.20 8 m 12 m Araujo et al. (2002)
Paracou GFG 2007→2009 CLAY=0.51; SAND=0.33 8 m 12 m Bonal et al. (2008)
Santarem km83 K83 2001→2003 CLAY=0.80; SAND=0.18 8 m 12 m Goulden et al. (2004)
Santarem km67 K67 2002→2004 CLAY=0.42; SAND=0.52 8 m 12 m Saleska et al. (2003)
Reserva Jarù JRU 2000→2003 CLAY=0.10; SAND=0.80 4 m 4 m Kruijt et al. (2004)
are 10 m deep (Bruno et al., 2006) and 2 m deep (da Rocha et al., 2004).
Gross primary productivity and carbon released by the whole RECO were retrieved from NEE data using the
Re-ichstein et al. (2005) algorithm. However, it does not give any information either on the partitioning between RA and RHor on carbon allocation to canopy, wood and roots. Yet,
these are essential processes to correctly represent the func-tioning of the Amazon ecosystem (Malhi et al., 2011). Malhi et al. (2009) gathered ecological measurements from K67, M34 and Caxiuanã (1.72◦S, 51.46◦W; eastern Amazon) to evaluate yearly average carbon cycling and allocation. We here use this data set to evaluate the annual carbon fluxes (GPP,RA, NEE), the carbon stocks and the carbon allocation
between the different pools in ISBACC(Sect. 4.4).
Finally, flux data are noisy. Hollinger et Richardson (2005) evaluated the relative uncertainty ofH, LE and CO2fluxes
to be around 25 % on a temperate site. Energy balance clo-sure in eddy-covariance data can also be problematic. At the five sites considered here, the overall energy balance ratio calculated as the sum of (LE+H) divided by the sum of net radiation over the whole period (Wilson et al., 2002) varies between 0.69 at M34 and 1.008 at K67, with values of 0.79 at JRU, 0.87 at K83 and 0.96 at GFG. Energy balance would be achieved with a ratio of one. For the carbon fluxes, according to Desai et al. (2008), the flux partitioning method to retrieve GPP andRECO from NEE may add up to 10 % uncertainty.
2.2 Models and experimental design
ISBACC(Noilhan and Planton, 1989; Noilhan and Mahfouf,
1996) and ORCHIDEE LSMs compute the exchange of wa-ter, energy and carbon between the land surface and the atmo-sphere. Both models deal with photosynthesis and allocate photosynthetic assimilates in several living biomass carbon pools defined by histological functional type. In both mod-els each carbon pool is associated with a respiration function and a specific turnover rate. None of these two models take into account demography.
Carbon assimilation and allocation in the biomass pools differ greatly between the two models. In ORCHIDEE, car-bon assimilation is based on the leaf-scale equation of Far-quhar et al. (1980) for C3plants and is assumed to scale from
leaf to canopy with APAR (Absorbed Photosynthetically Ac-tive Radiation) decreasing exponentially with leaf area index (LAI), according to the “big leaf” approximation. Stomatal conductance is proportional to the product of net CO2
as-similation by atmospheric relative humidity divided by atmo-spheric CO2concentration in the canopy (Ball et al., 1987).
Standard equations are given in Krinner et al. (2005) and Ver-beeck et al. (2011) for tropical forest plant functional types (PFTs). In contrast, ISBACChas a semi-empirical
parameter-ization of net carbon assimilation and the mesophyll conduc-tance (gm) following the model of photosynthesis proposed
by Jacobs (1994), based on Goudriaan et al. (1985) and im-plemented by Calvet et al. (1998). In its standard version, ISBACCuses Goudriaan’s (1986) solution of radiative
trans-fer to calculate net photosynthesis in three canopy layers. The standard ISBACCequations are given in Calvet et al. (1998,
2004) and Gibelin et al. (2008). In ORCHIDEE (v1187), the carbon allocation model accounts for eight biomass compart-ments (leaves, roots, fruits/harvested organs, reserves, above-ground sapwood, belowabove-ground sapwood, aboveabove-ground heart-wood, belowground heartwood) for tree PFTs.
ISBACCrepresents aboveground metabolic and structural
biomass pools, above- and belowground woody biomass pools and belowground structural biomass pools adapted from Lemaire and Gastal (1997), implemented in ISBACC
by Calvet and Soussana (2001) and detailed in Sect. 3.3. The description of the litter and soil carbon content and the asso-ciated heterotrophic fluxes is similar between the two models and is based on the CENTURY model developed by Parton et al. (1988). We only use the first top meter of soil carbon from the data set of Malhi et al. (2009) to evaluate ISBACC
since CENTURY was designed to represent the carbon con-tent in the first top meter. The litter is described by four pools defined by the lignin content and the location (metabolic and structural above- and belowground). The soil organic cycling module differentiates three carbon pools (active, slow, pas-sive) according to their turnover times (from a few years for the active pool to 1200 years for the passive pool).
At each site, we ran ISBACC and ORCHIDEE offline
forced by in situ hourly meteorological measurements (gap
filled when necessary) made on top of each flux tower (able at http://daac.ornl.gov/, except for GFG which is avail-able from the FLUXNET website following the “LaThuile” data sharing policy). We imposed the same evergreen tropical broadleaf tree PFT at the five sites and used the in situ soil texture, root and soil depth information for each site found in the literature and summarized in Table 1. Soil texture is used to compute the wilting point and field capacity, and the hydrological and thermal exchange coefficients following Decharme et al. (2011). The organic content in the upper soil layers, which also affects the hydrological and thermal ex-change coefficients, is given by HWSD (Harmonized World Soil Database; Nachtergaele et al., 2012). Both models were run until the slowest storage pools had reached equilibrium by cycling the atmospheric forcing over the available 3 years including the observed CO2concentration. To simulate soil
moisture content in the deep Amazonian soils we used the soil multilayer diffusion scheme implemented in ISBA by Decharme et al. (2011, 2013) and in ORCHIDEE by de Ros-nay et al. (2000, 2002). Both models impose a vertical distri-bution of roots following a decreasing exponential function of depth.
3 Towards a new parameterization of the tropical forest in ISBACC
ISBACC has never been evaluated over the tropical
rainfor-est biome (Gibelin et al., 2008), and, as shown below, in this control version (CTL), LE andRAwere seriously biased
and needed to be corrected. Large biases in the simulated LE and respiration fluxes are indeed not acceptable when mod-eling a region where precipitation recycling is important and where changes in the carbon fluxes could have profound ef-fects on the global climate. This section describes the original ISBACC model (CTL) and the implemented modifications.
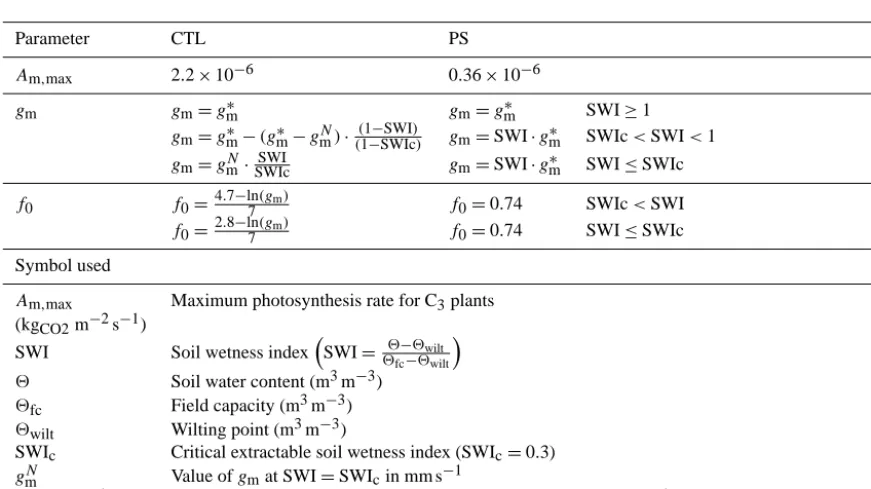
The main parameters of ISBACC are given in Table 2. We
first describe the changes made on the photosynthesis param-eterization and its sensitivity to soil moisture as summarized in Table 3. Second, we present the modifiedRA functions
(version PS+R) and the original ones (CTL) as summarized in Table 4.
3.1 ISBACC: selection of the reference version
As pointed out by Carrer et al. (2013), ISBACCoverestimates
Table 2. ISBACC: nomenclature.
Symbols Units Description
Am kgCO2m−2s−1 Photosynthesis rate (light saturated)
Ca ppmv Atmospheric CO2concentration
Ci ppmv Leaf internal CO2concentration
Ds g kg−1 Saturation deficit at the leaf surface
Dmax g kg−1 Maximum value ofDs
f unitless Coupling factor
f0 unitless Coupling factor at saturating air humidity (Ds=0)
f0∗ unitless Coupling factor in well-watered conditions and at saturating air humidity (Ds=0)
fmin unitless Coupling factor at maximum air humidity deficit (Ds=Dmax)
0 ppmv CO2concentration compensation point
gm mm s−1 Mesophyll conductance defined as the light-saturated rate of photosynthesis (Jacobs, 1994)
gm∗ mm s−1 gmin well-watered conditions
gs mm s−1 Stomatal conductance
Table 3. ISBACCmodifications: photosynthesis and transpiration PS version.
Parameter CTL PS
Am,max 2.2×10⁻⁶ 0.36×10⁻⁶
gm gm=gm∗ gm=gm∗ SWI≥1
gm=gm∗−(gm∗−gNm)· (1−SWI)
(1−SWIc) gm=SWI·g
∗
m SWIc<SWI<1 gm=gmN· SWI
SWIc gm=SWI·g
∗
m SWI≤SWIc f0 f0=4.7
−ln(gm)
7 f0=0.74 SWIc<SWI
f0=2.8−ln7(gm) f0=0.74 SWI≤SWIc
Symbol used
Am,max Maximum photosynthesis rate for C3plants
(kgCO2m−2s−1)
SWI Soil wetness indexSWI= 2−2wilt
2fc−2wilt
2 Soil water content (m3m−3)
2fc Field capacity (m3m−3)
2wilt Wilting point (m3m−3)
SWIc Critical extractable soil wetness index (SWIc=0.3)
gNm Value ofgmat SWI=SWIcin mm s−1
g∗m(mm s−1) Value ofgmin well-watered conditions (SWI≥1) (gm=2 mm s−1for broadleaf tropical forest)
(not shown). The new version of the radiative transfer al-lows ISBACCto better capture the amount of GPP thanks to
a more detailed and physical approach. To avoid unrealistic GPPs, we chose to test the version of ISBACCwith a
radia-tive transfer scheme from Carrer et al. (2013) and call it our control version (CTL).
3.2 Water and carbon coupling and drought
sensitivity: description of the original and modified parameterization (PS version)
The original ISBACCphotosynthesis model relies on a
“mes-ophyll conductance” (gm), defined by Jacobs (1994) as the
initial slope of the CO2response curve at high light intensity
and limiting CO2concentrations.
gm= Am Ci−0
, (1)
whereCi is the leaf-internal CO2 concentration,0the CO2
compensation point andAm the photosynthesis rate at
satu-rating light and lowCi.
The model also supposes a constant ratio ofCi to
atmo-spheric CO2concentration (Ca) when atmospheric humidity
is constant.
f =Ci−0
Ca−0
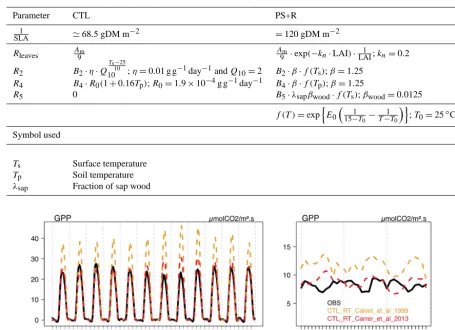
Table 4. ISBACC: modifications autotrophic respiration (RA) functions PS+R version.
Parameter CTL PS+R
1
SLA '68.5 gDM m
−2 =120 gDM m−2
Rleaves A9m A9m·exp(−kn·LAI)·LAI1 ;kn=0.2
R2 B2·η·Q Ts−25
10
10 ;η=0.01 g g
−1day−1andQ
10=2 B2·β·f (Ts);β=1.25 R4 B4·R0(1+0.16Tp);R0=1.9×10⁻⁴g g−1day−1 B4·β·f (Tp);β=1.25
R5 0 B5·λsapβwood·f (Ts);βwood=0.0125 f (T )=expnE0
1 15−T0−
1
T−T0 o
;T0=25◦C
Symbol used
Ts Surface temperature
Tp Soil temperature
λsap Fraction of sap wood
Figure 2. Observed and simulated GPP with the CTL version of ISBACCcomparing the two radiative transfers at K67. The left panel shows the diurnal cycle for each month averaged over 3 years (2002–2004); the right panel shows the monthly mean time series for 2001–2003.
In drier atmospheric conditions, the ratio decreases according to
f =f0
1− Ds
Dmax
+fmin
D
s Dmax
, (3)
where Ds is the atmospheric humidity deficit, Dmax the
deficit resulting in complete stomatal closure,fminthe value
of f atDmaxandf0 the value off at saturating humidity
(Ds=0).fmin,f0andDmaxare model parameters
depend-ing on plant type and based on available observations. Fol-lowing Eq. (2),Cialso decreases with drying air (increase in Ds):
Ci=f·Ca+0(1−f ). (4)
Assimilation is then calculated from light (Eqs. (A7)–(A9) in Calvet et al., 1998), air humidity,Ca, the ratio ofCi/Ca
and, finally, the stomatal conductance (gs) is deduced from
the assimilation rate.
Jacobs (1994) photosynthesis model was designed to sim-ulate the assimilation rate and the stomatal conductance of grapevines in semi-arid conditions. While ISBACC is used
for large-scale studies using a PFT approach, there were few attempts to adapt the ecophysiological parameters to each functional group, especially for evergreen tropical broadleaf trees. We used published measurements from about 20 differ-ent tree species (Domingues et al., 2005, 2007) from Tapajos National forest to deriveAm,max, the maximum
photosynthe-sis rate at high light intensity andf0(see Eq. 3). The original
values and the values of these two parameters are given in Table 3.
The soil water stress function (WSF) empirically describes the effect of soil moisture on transpiration and photosynthe-sis. In the case of ISBACC, SWC weighted by the roots
pro-file, affects transpiration and photosynthesis through changes ingmand, in the CTL version,f0. The WSF implemented in
ISBACCby Calvet (2000) was first designed for herbaceous
species and adapted for trees (Calvet et al., 2004). As de-scribed in Table 3 the parameterization for trees supposes a relationship betweenf0 and soil wetness index (SWI) and
was derived from measurements taken on saplings from
Pi-nus pinaster and Quercus petraea. It had never been tested
well when tested in the Amazon as shown below. Therefore, we propose an alternative parameterization assuming a con-stant f0 coherent with in situ observations (Domingues et
al., 2007) and validated against the two artificial drought ex-periments completed in the eastern Amazon (Joetzjer et al., 2014, and references within). Later in this paper, we call ver-sion PS ISBACC with these different values ofAm,max,f0
and the modified WSF.
3.3 Autotrophic respiration and specific leaf area description of the original and modified parameterization (PS+R version)
An analysis of the yearly carbon use efficiency (CUE) de-fined by the fraction of GPP invested into the net primary productivity (NPP/GPP) (Rowland et al., 2014) shows that ISBACCoverestimatesRAfrom leaves, roots and wood,
lead-ing to a loss of more than 90 % of the carbon assimilated on an annual basis (corresponding to a CUE<0.1). This result is not realistic. Over the Amazon, the CUE is roughly esti-mated to be around 0.3 (Chambers et al., 2004; Malhi et al., 2009, 2011; Metcalfe et al., 2010). Therefore, a new parame-terization of each respiration term is proposed and described below.
ISBACCsimulates six biomass pools, originally described
in Gibelin et al. (2008) as: – Bl, leaf biomass;
– B2, an active structural biomass pool which represents
the stem in the case of grass and crop, and can be assim-ilated to new twigs for trees;
– B3, a small biomass pool used for numerical stability
purposes, and accounts for a negligible amount of the carbon actually stored;
– B4, a belowground structural biomass pool representing
the roots’s sapwood and the fine roots;
– B5, an aboveground woody biomass pool representing
the aboveground wood (trunk and branches);
– B6, a belowground woody biomass pool representing
the roots’s heartwood.
The evolution of each biomass poolB(kg m−2) is given by 1B
1t =AB−DB−RB, (5)
where 1t is 1 day, AB (kg m−2day−1) is the increase in biomass coming from photosynthetic assimilation or allo-cation from another reservoir, DB (kg m−2day−1) repre-sents turnover or carbon reallocation to another pool andRB (kg m−2day−1) is a decrease term due to respiration.
3.3.1 Leaf respiration
Originally, leaf dark respiration integrated over the canopy was parameterized, following Van Heemst (1986) as Rleaf=
Am
9 ·LAI, (6)
where LAI is the leaf area index andAmthe photosynthetic
rate at high light intensities (Table 1). Am being constant
throughout the canopy, respiration is identical from the top to the bottom leaves, while assimilation decreases from top to bottom according to the absorbed fraction of PAR calcu-lated by the radiative transfer scheme (Carrer et al., 2013). However, observations show that leaf respiration is positively correlated to area-based leaf nitrogen content (NAREA)(Meir
et al., 2001, 2008; Reich et al., 2006), andNAREAis driven
by light availability according to the theory of optimal nu-trient allocation availability (Field and Mooney, 1986). In-deed,NAREAis highly correlated to photosynthesis capacity
as most of the leaf nitrogen is dedicated to the synthesis of photosynthetic proteins. So, a constant value for dark respi-ration throughout the canopy as supposed in ISBACCis not
reasonable, particularly for high canopies. Therefore, we im-posed a vertical profile of respiration based on an exponential profile of leaf nitrogen (Sect. 2.5 in Bonan et al., 2011, 2012). Rleaf=
Am
9 exp(−kn·LAI), (7)
whereknis the within-canopy profile of photosynthetic
ca-pacity set to 0.2 according to Mercado et al. (2009) and Bo-nan et al. (2011). This parametrization greatly reduces the leaf dark respiration of the canopy compared to the original one.
3.3.2 Twigs, stem and trunk
In the original version of ISBACC(Gibelin et al., 2008), the
woody biomass (B5) does not respire. If heartwood does not
respire, sapwood made of living cells (including phloema cells) does. We adopted the simple parameterization of sap-wood respiration from IBIS (Integrated BIosphere Simula-tor) (Kucharik et al., 2000). We first calculate an estimated sapwood fraction (λsap) from an assumed sap velocity, the
maximum transpiration rate and the tree height following Kucharik et al. (2000). Then, the respiration of the 5th reser-voir,R5is computed as
R5=B5·λsap·βwood·f (T ) with βwood=0.0125 yr−1,
(8) whereβwoodis a maintenance respiration coefficient defined
at 15◦C andf (T ) is given by the Arrhenius temperature
function modified by Lloyd et Taylor (1994). f (T )=exp
E0
1
15−T0
− 1
T−T0 ,
whereT is the temperature of the given carbon pool in ◦C
(here, the surface temperature because ISBACCdoes not
sim-ulate a vegetation temperature),E0a temperature sensitivity
factor (equal to 3500) and T0a temperature reference set at
25◦C.
For the B2 biomass reservoir (twigs), the function
pro-posed in ISBACCis R2=B2·η·Q
Ts−25 10
10 , (10)
where Q10=2, η=0.01 (g g−1day−1) andTs (◦C) is the
temperature of the surface. We did not find any measurement for respiration of twigs and did not find any other model rep-resenting this reservoir. We assumed that respiration per unit biomass of this reservoir had to be lower than respiration of leaves, and similar or slightly larger than sapwood. A com-parison with respiration functions from other models showed that Eq. (10) is about the same magnitude as respiration func-tions for leaves from ORCHIDEE, the Lund–Potsdam–Jena (LPJ) (Sitch et al., 2003) and IBIS (Foley et al., 1996) for temperatures up to 30◦C, but increases strongly at higher temperatures. It is also an order of magnitude larger than res-piration of sapwood from these models, which does not seem realistic. To be coherent withB5, we adopted the Kucharik et
al. (2000) formulation. Therefore,
R2=B2·β·f (T ) with β=1.25 yr−1. (11)
3.3.3 Root respiration
Originally, root respiration followed the linear respiration given in Ruimy et al. (1996):
R4=B4·R0(1+0.16Tp) with R0=1.9×10⁴g g−1day−1.
(12) To be consistent with sapwood respiration,R4 is now
com-puted as
R4=B4·β·f (T ) with β=1.25 yr−1. (13) 3.3.4 Specific leaf area
ISBACC calculates interactively the leaf biomass and the
LAI using a simple growth model (Calvet et al., 1998). Leaf biomass results directly from the carbon balance of the leaf: increasing with the carbon assimilated by photosynthesis and depleted by respiration, turnover and allocation to the other reservoirs (Calvet and Soussana, 2001). LAI is simply cal-culated as leaf biomass times the specific leaf area (SLA). Hence, there is no explicit phenology model in ISBACC.
Phe-nology is simply the result of the leaf carbon balance. In the CTL version the SLA depends on the leaf nitrogen concentration, a fixed parameter depending on the plant type
a)
c) b)
d)
e)
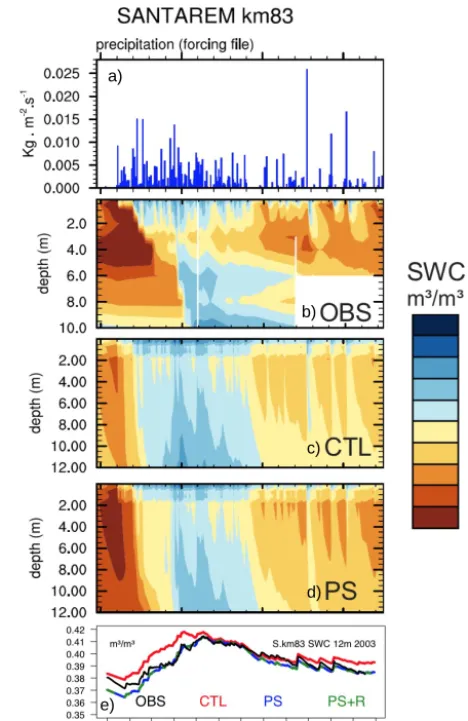
Figure 3. Daily precipitation (a): observed (b) and simulated (c
and d) soil moisture at K83 during 2003. The total soil water con-tent over the whole 12 m column is shown on plot (e). We linearly rescaled the soil moisture content of the 10 m pit (Bruno et al., 2006) to the values of the 2 m one (da Rocha et al., 2004) by multiplying the 10 m SWC by the ratio of field capacities between the 2 m and the 10 m pit).
(Gibelin et al., 2006). We replaced the original SLA calcu-lated by Gibelin et al. (2006) with the observed value from Domingues et al. (2007).
Later in this paper, we discuss version PS+R (ISBACC
version including the Table 3 parameters and functions) and the changedRAand SLA summarized Table 4.
4 Results and discussion
We now evaluate and compare three versions of ISBACC:
0 100 200 300 400 500 600
OBSd[, x]
JAN FEB MAR APR MAY JUN JUL AUG SEP OCT NOV DEC
W/m² R_NET
80 100 120 140 160
c(OBSm[, x], rep(NA, 12))
2001 2002 2003 2004
W/m² R_NET
OBS CTL PS PS+R
0 50 100 150 200 250
OBSd[, x]
JAN FEB MAR APR MAY JUN JUL AUG SEP OCT NOV DEC
W/m² H
10 20 30 40 50 60 70
c(OBSm[, x], rep(NA, 12))
2001 2002 2003 2004
W/m² H
OBS CTL PS PS+R
0 100 200 300
OBSd[, x]
JAN FEB MAR APR MAY JUN JUL AUG SEP OCT NOV DEC
W/m² LE
60 80 100 120 140
c(OBSm[, x], rep(NA, 12))
2001 2002 2003 2004
W/m² LE
OBS CTL PS PS+R
Figure 4. Observed and simulated net radiation (RNet), sensible heat (H) and latent heat (LE) at K83. Left panels show the diurnal cycle for
each month averaged over 3 years (2001–2003); and right panels, monthly mean time series for 2001–2003. Gray shaded areas indicate dry
seasons (defined as periods with precipitation less than 100 mm month−1).
Note that we mostly show results from K83 because deep soil moisture measurements are available.
4.1 Soil moisture
Looking at the top 10 m daily SWC simulated in 2003 at K83 (Fig. 3, bottom panel), the slight wet bias found in the orig-inal ISBACCmodel (CTL) is reduced when using either the
modified PS or PS+R versions. As shown in Sect. 4.2, this is due to the increased LE in the PS and PS+R versions. Note that the ISBACC soil moisture content was also
suc-cessfully evaluated at K67 and at Caxiuanã (Joetzjer et al., 2014; Fig. 3, top panels). Moving to the vertical profile of soil moisture (Fig. 3, mid-panels), and whatever the model version, the vertical profile of organic matter prescribed in ISBACC (Decharme et al., 2006) allows the model to
simu-late a relatively wet top 1m horizon as observed (Fig. 3, mid-panels). However, it is not sufficient to capture accurately the observed soil moisture dynamics. From February to April the soil moisture increases slowly from the surface to 6 m, while ISBACCsimulates a much more rapid re-wetting, and after a
heavy rain (e.g., October) water infiltrates too quickly. This might be due not only to uncertainties in water uptake by roots (prescribed according to Jackson et al., 1996) but also to the vertically uniform soil texture prescribed in ISBACC
due to the lack of in situ observations. In reality, the clay content is usually increasing with depth, which reduces the hydraulic conductivity at lower levels.
4.2 Energy budget
Focusing again on K83, while net radiation (RNET) is well
captured by the three ISBACC simulations, the CTL
exper-iment overestimates theH flux and underestimates the LE flux (Fig. 4). As expected, the partitioning of the energy bud-get is better represented with the simulation usingAm,max
andf0parameters derived from the in situ observations (PS
version, Table 3). The increase in LE simulated by PS com-pared to the CTL explains the reduction of the wet bias in SWC simulated by the CTL run (Fig. 3). Not surprisingly, the modification of theRAfunctions has little effect (run PS+R,
Table 4) on the simulated energy budget and does not impact the temporal variability ofRn,H and LE which are
reason-ably well simulated at both diurnal and seasonal timescales. Figure 5 shows a summary of the annual mean scores ofH and LE computed for the three versions of ISBACCand for
H
Standard de
viation
0.0 0.5 1.0 1.5
0.0
0.5
1.0
1.5
0.5 1 1.5
●
0.1 0.20.3
0.4 0.5
0.6 0.7
0.8
0.9
0.95
0.99
Correlation
● ●
● ●
LE
Standard de
viation
0.0 0.5 1.0 1.5
0.0
0.5
1.0
1.5
0.5 1 1.5
●
0.1 0.20.3
0.4 0.5
0.6 0.7
0.8
0.9
0.95
0.99
Correlation
●
●●●
●
0 50 100 150
H
%
K67 K83 JR
U
GFG M34
●
●
●
● bias %
●
60 80 100 120 140
H
W/m²
● ● ●●
RMSE W/m²
●
−40 −20 0 20
LE
%
K67 K83 JR
U
GFG M34
● ●
●●
bias %
●
60 80 100 120 140
LE
W/m²
● ●
●● RMSE W/m²
●
●
K67 K83 JRU GFG M34
CTL PS PS+R ORC
Figure 5. Taylor diagrams (top) and bias (%) (bottom) calculated among hourly values removing night values (short-wave down≤5 W m−2)
forH and LE at the five flux towers and for each available period (see Table 1). In the Taylor diagrams, correlation extends radially from
the origin. The blue lines indicate identical ratios of standard deviation of the simulated flux to the observed flux. The gray lines represent identical root mean square errors (RMSE) of the centered fluxes.
LE is greatly underestimated (by about 30 %) by the CTL, whatever the season (not shown), at four among the five sites and this bias is reduced in the revised versions. At M34, al-though CTL overestimates H, it simulates reasonably well LE. The PS model version reduces the bias inH but overes-timates LE. This result is coherent with the fairly low level of energy closure at this site (see Sect. 2.1) and suggests that the observed Bowen ratio should be considered with caution at M34.
The PS version improves the simulation ofHand LE com-pared to the CTL version, whatever the season. Interestingly, changes in the parameterization of respiration (PS+R) barely alter the results compared to PS. The scores of ORCHIDEE are very close to those computed with the improved version of ISBACC with large positive biases forH at JRU and LE
at M34 (Fig. 5). The fact that the results are more site
de-pendent than model dede-pendent suggests a problem in the prescribed atmospheric forcings or in the eddy-covariance measurements for these sites, as suggested by the level of energy closure on these sites. Considering the ISBACC and
ORCHIDEE models are based on different parameterizations of photosynthesis, respiration and growth, the likelihood of the models being both wrong at the same location is rather small, except for processes unaccounted for by both models like particular phenology adapted to the local conditions. 4.3 Carbon fluxes
Moving back to the K83 site, but looking at the carbon fluxes (Fig. 6), the ISBACC model reasonably captures the annual
0 10 20 30
OBSd[, x]
JAN FEB MAR APR MAY JUN JUL AUG SEP OCT NOV DEC µmolCO2/m² s GPP
0 5 10 15
c(OBSm[, x], rep(NA, 12))
2001 2002 2003 2004
µmolCO2/m² s GPP
OBS CTL PS
PS+R
0 5 10 15
OBSd[, x]
JAN FEB MAR APR MAY JUN JUL AUG SEP OCT NOV DEC µmolCO2/m² s R_ECO
0 5 10
c(OBSm[, x], rep(NA, 12))
2001 2002 2003 2004
µmolCO2/m² s R_ECO
OBS CTL PS
PS+R
−20 −10 0 10
OBSd[, x]
JAN FEB MAR APR MAY JUN JUL AUG SEP OCT NOV DEC µmolCO2/m² s NEE
−8 −6 −4 −2 0 2 4 6
c(OBSm[, x], rep(NA, 12))
2001 2002 2003 2004
µmolCO2/m² s NEE
OBS CTL PS
PS+R
Figure 6. Observed and simulated GPP,RECOand NEE at k83. Left panels show the diurnal cycle for each month averaged over 3 years
(2001–2003); and right panels, monthly mean time series for 2001–2003. Gray shaded areas indicate dry seasons (defined as periods with
precipitation less than 100 mm month−1).
model as the difference betweenRECOand GPP (NEE). The
annual magnitude of GPP is correctly simulated by the CTL version thanks to the radiative transfer scheme proposed by Carrer et al. (2013) (Fig. 2). While theAm,maxchosen in the
PS simulation is around 6 times smaller than initially (Ta-ble 3), the increase inf0enhances the assimilation rate,
lead-ing to little change in GPP between CTL and PS. Therefore, there is a trade-off in the model between f0 andAm,max,
that can be expected from the photosynthesis module. A lower maximum assimilation rate (Am,max)tends to reduce
the carbon assimilation (see Eq. (A7) in Calvet and Sous-sana, 2001). On the other hand, with a higherf0, intracellular
CO2is higher (see Eq. 4), which favors carbon assimilation.
PS barely impacts simulatedRECOand therefore NEE
com-pared to CTL. While the revised SLA and respiration func-tions lead to slightly decreased GPP (PS+R), the decrease in RECOis even stronger and leads to an increased net rate of
carbon uptake (more negative NEE).
The annual cycle of GPP,RECOand NEE, although
rela-tively small in these tropical regions (Fig. 6, right column), is poorly simulated by the model. The model tends to increase GPP at the beginning of the dry season when radiation in-creases and soil moisture is not yet limiting. As such, the model behaves as expected, radiation being the most limiting factor during the wet season, and the observed annual cycle results probably from processes that are not accounted for by the model, such as leaf phenology. Not surprisingly given the model formulation, but in contrast to the observations, the modeled seasonal cycle of GPP coincides with the seasonal cycle of LE in all ISBACCsimulations.
The statistical skill scores computed for the five flux tow-ers are again summarized in Taylor diagrams (Fig. 7, top). The GPP relative standard deviation (RSD) computed with
PS is improved at K67 but is slightly lowered at M34, while there are no substantial changes at K83 and JRU compared to CTL; this is also valid for the NEE. At GFG, the RSD of NEE is also improved. PS+R exhibits scores quite simi-lar to the PS run. The systematic positive bias in GPP (about 10 to 25 %) and inRECO (about 10 to 100 %) found in the
CTL run is reduced in PS, and even more in PS+R (Fig. 7, bottom). Although model modifications reduce the bias in NEE at JRU and M34, they increase it at K67, K83 and GFG. This is not surprising since NEE is a small flux result-ing from the difference between two large fluxes. Lookresult-ing at the absolute RMSE, errors are reasonable (between 5 and 10 µmol m2s−1) compared to observation uncertainties, and the ORCHIDEE results once again suggest that scores are more site-dependent than model-dependent.
It is important to note that flux towers measure di-rectly only NEE. TheRECOis reconstructed from nighttime
(i.e., when there is no photosynthesis) measurements which are however questionable (e.g., Reichstein et al., 2005). Day-timeRECOis likely to differ from nighttimeRECO because
of the temperature diurnal cycle. Also, the lower wind speed at night and thus lower friction velocity (u*) limits the ef-ficiency of the eddy-covariance technique (Aubinet et al., 2002; Saleska et al., 2003). As GPP is reconstructed from NEE andRECO, more bias can be expected for this flux and
conclusions on GPP should be also considered with caution. 4.4 Carbon stocks and carbon use efficiency
GPP
Standard de
viation
0.0 0.5 1.0 1.5
0.0 0.5 1.0 1.5 0.5 1 1.5 ● 0.1 0.20.3
0.4 0.5 0.6 0.7 0.8 0.9 0.95 0.99 Correlation NEE Standard de viation
0.0 0.5 1.0 1.5
0.0 0.5 1.0 1.5 0.5 1 1.5 ● 0.1 0.20.3
0.4 0.5 0.6 0.7 0.8 0.9 0.95 0.99 Correlation ● ● ● ● ● −5 0 5 10 15 20 25 30 GPP %
K67 K83 JR
U GFG M34 ● 0 2 4 6 8 10 12 GPP µmolCO2/m².s
K67 K83 JR
U GFG M34 RMSE µmolCO2/m².s ● −20 0 20 40 60 80 100 R_ECO %
K67 K83 JR
U GFG M34 ● 0 2 4 6 8 10 12 R_ECO µmolCO2/m².s
K67 K83 JR
U GFG M34 RMSE µmolCO2/m².s ● −30 −20 −10 0 10 20 NEE %
K67 K83 JR
U GFG M34 ● ● ● ● ● 0 2 4 6 8 10 12 NEE µmolCO2/m².s
K67 K83 JR
U GFG M34 ● ● ●● RMSE µmolCO2/m².s ● ●
K67 K83 JRU GFG M34 CTL PS PS+R ORC
Figure 7. Taylor diagrams (top) for GPP and NEE and bias for GPPRECOand NEE (%) (bottom) calculated among hourly values removing
night values (short-wave down≤5 W m−2) at the five flux towers and for each available period (see Table 1). Note that at GFG only NEE
time series was available. In the Taylor diagrams, correlation extends radially from the origin. The blue lines indicate identical ratios of standard deviation of the simulated flux to the observed flux. The gray lines represent identical root mean square errors (RMSE) of the centered fluxes.
stocks greatly differ (Fig. 8). Over these three sites, obser-vations indicate a total carbon stock of around 330 t C ha−1 with an error estimate of about 30 t C ha−1. The original model (CTL) greatly underestimates the stock by a factor of 3. While modifications of the photosynthesis components (PS) slightly increases carbon stocks, the underestimation of the carbon storage persists. Changes in respiration functions (PS+R) lead to a more reasonable total amount of carbon stock.
Flux tower data provide high frequency information on the carbon flux between the ecosystem and the atmosphere, but do not allow us to distinguish between vegetation and soil
fluxes. The meta-analysis from Malhi et al. (2009) however allows us to evaluate the annual fluxes between the different carbon pools at Caxiuanã (Fig. 9). Compared to observations, the CTL run highly overestimatesRAand consequently
un-derestimates the NPP. Therefore, the CUE, computed as the ratio NPP/GPP, is too low. 92 % of the carbon assimilated is directly respired, leaving only 8 % of the GPP to be allocated to the plant biomass pools. This result motivated the changes inRAfunctions presented in Table 4. These changes
OBS PS+R PS CTL
Caxiuana
tC/ha
0 100 200 300 400
322 tC/ha
364 tC/ha
142 tC/ha 117 tC/ha
OBS PS+R PS CTL
Santarem K67
tC/ha
0 100 200 300 400
338 tC/ha349 tC/ha
137 tC/ha 104 tC/ha
OBS PS+R PS CTL
Manaus M34
tC/ha
0 100 200 300 400
341 tC/ha
426 tC/ha
175 tC/ha 145 tC/ha
Leaves stem LIT CWD Roots SOC
OBS PS+R PS CTL
%
0 20 40 60 80 100
OBS PS+R PS CTL
%
0 20 40 60 80 100
OBS PS+R PS CTL
%
0 20 40 60 80 100
Figure 8. Observed (Mahli et al., 2009) and simulated (CTL, PS and PS+R) annual carbon pools (leaves (BL), stem (B2+B5), litter (LIT),
coarse and woody debris (CWD), roots (B4+B6) and soil organic content (SOC)) at Caxiuanã, K67 and M34. Top panels show the absolute
carbon stock in t C ha−1and below panels the relative carbon stock (%).
Caxiuana data Mahli 2009
GPP = 34.4 +/- 4.2
NPP = 10.0 +/- 1.2
Ra = 21.4 +/- 4.1
Leaves
3 Wood200 Roots16
SOC + litter + CWD
103
Rh = 9.4 +/- 0.8
CUE=0.32
+/- 0,07
OBSERVATIONS
Ecosystem
322 Re = 30.1 +/- 4.2
GPP = 37.2
NPP = 3.2
Ra = 34
Leaves
1.7 Wood75 Roots12
SOC + litter + CWD
28
Rh = 3.2
CUE=0.08
ISBACC CTL
Ecosystem
117 Re = 37.2
GPP = 34.8
NPP = 9.7
Ra = 25.1
Leaves
3.5 Wood255 roots18
SOC + litter + CWD
87
Rh = 9.6
CUE=0.28
ISBACC PS+R
Ecosystem
363 Re = 34.7
Figure 9. Annual carbon pools (in t C ha−1) and fluxes (in t C ha−1yr−1) from a synthesis of observations at Caxiuanã (Malhi et al., 2009)
compared to ISBACC(CTL and PS+R simulations). Adapted from Randerson et al. (2009).
pools, and the litterfall. The litter and the soil organic matter are increased, and, as a result,RH, largely underestimated by
the original model (CTL), is now correctly simulated. Note that the CTL version has a reasonable estimation of RECO
because the overestimation of RA is partly counterbalanced
by an underestimation ofRHthrough an underestimation of
the heterotrophic carbon stock (Fig. 9).
In spite of reasonableRAat each site, the ISBACC model
tends to overestimate the amount of carbon stored in the stems (Fig. 8). This pattern can very likely be explained by a too low mortality rate. At K67, the high amount of CWD (Saleska et al., 2003) and the low amount of aboveground biomass observed compared to the other sites suggest a re-cent higher than normal tree mortality. This could be
trig-gered by drought associated with the strong El Niño events of the 1990s (Rice et al., 2004; Pyle et al., 2008) that these simulations forced by 3 years meteorological forcing cannot represent.
4.5 Annual ratio between carbon stocks and fluxes
Table 5. Mean annual autotrophic and heterotrophic carbon stocks and respiration flux deduced from the synthesis of observations (OBS)
done by Malhi et al. (2009) and simulated by ISBACC (simulations CTL and PS+R) at Caxiuana, K67 and M34. Stocks are in t C ha−1and
fluxes in t C ha−1yr−1. The ratio defines the % of carbon respirated per carbon pool.
Caxiuanã Santarem K67 Manaus M34
Auto Hetero EcoS Auto Hetero EcoS Auto Hetero EcoS
Stocks OBS 218.7 103.3 322 166.7 171.5 338.2 199.9 141.0 340.9 PS+R 276.6 87.1 363.7 250.6 98.5 349.2 276.3 150.1 426.4 CTL 89 27.7 116.7 74.3 29.9 104.2 93.5 51.6 145.1
Resp OBS 21.4±4.1 9.4±0.8 30.1±4.2 14.9±4.2 14.9±1.4 29.8±4.4 19.8±4.6 9.6±1.2 29.3±4.7 PS+R 25.2 9.6 34.8 22.5 8.6 31.1 25.0 9.6 34.7 CTL 33.9 3.2 37.2 30.3 2.8 33.1 32.2 3.5 35.7
Ratio % OBS 9.8 9.1 9.4 8.9 8.7 8.8 9.9 6.8 8.6 PS+R 9.1 11.0 9.6 9.0 8.7 8.9 9.0 6.4 8.1 CTL 38.1 11.6 31.9 40.8 9.4 29.8 34.4 6.8 23.9
by the new (PS+R) version but totally misrepresented by the original scheme (CTL). Ecosystem respiration relative to the stock is 3 times too high although the absolute value was rea-sonable. Nevertheless, large uncertainties surrounds the sea-sonality ofRA(and consequentlyRECO).
5 Conclusions
In this study, we proposed and evaluated revised parame-terizations of the photosynthesis, its sensitivity to soil water stress and theRAfunction in the ISBACCLSM implemented
in the CNRM ESM, over the Amazon forest. As far as the energy and water budgets are concerned, net radiation and soil water dynamics that are driven by observed atmospheric forcing are reasonably well simulated by ISBACC. Our mod-ifications of photosynthesis mainly allow the model to better capture the turbulent energy fluxes (H and LE). While the mean carbon fluxes are slightly better captured with the re-vised parameterization, ISBACCstill struggles to capture the
seasonality of the observed (NEE) or reconstructed (RECO
and GPP) carbon fluxes. Interestingly, when ISBACCis
com-pared to the ORCHIDEE model based on different param-eterizations, scores are systematically more site-dependent than model-dependent. This either suggests problems in the prescribed atmospheric forcing, or in the eddy-covariance measurements, unless both models do not account for a cru-cial process. Further investigations are thus needed.
Changes made to the parameterization ofRAimprove the
simulation of the CUE, in good agreement with the observa-tions from Malhi et al. (2009) and Rowland et al. (2014). By enhancing the carbon storage, biomass pools become larger and more consistent with observations. However, increasing the carbon stock in ISBACC by a factor of 3 between CTL
and PS+R versions barely impacts the net carbon flux. This illustrates the weak link between carbon stocks and fluxes in the ISBACCmodel and the need for further improvements.
There is no silver bullet for the parameterization ofRA,
such as the Farquhar model for the carbon assimilation. Be-causeRArepresents a large part ofRECO, andRECOis crucial
to determine the NEE, both annual amount and seasonality of RAneed to be correctly represented. Indeed, considering the
relevance ofRECOin the seasonal changes of the ecosystem
carbon budget (Meir et al., 2008; Rowland et al., 2014), and not only over the Amazon forest (Atkin and Macherel, 2009; Atkin et al., 2014), there is an urgent need to better under-stand the main drivers of autotrophic respiration in a wide range of environmental conditions.
Code availability
ISBACC is part of the larger sea and land surface scheme
SURFEX. The control version (CTL) of ISBACCused here
is part of SURFEX_v7.2 (http://www.cnrm.meteo.fr/surfex/) and the modified version (PS+R) is part of SURFEX_v8 that will be released before summer 2015.
Acknowledgements. The authors thank Rogério D. Bruno and
Humberto R. da Rocha for access to 10 m soil moisture observa-tions. Thanks are due to the two anonymous reviewers for their constructive comments.
Edited by: C. Sierra
References
Ahlström, A., Schurgers, G., Arneth, A., and Smith, B.: Robust-ness and uncertainty in terrestrial ecosystem carbon response to CMIP5 climate change projections, Environ. Res. Lett., 7, 044008, doi:10.1088/1748-9326/7/4/044008, 2012.
Aragao, L. E., Poulter, B., Barlow, J. B., Anderson, L. O., Malhi, Y., Saatchi, S., Phillips, O. L., and Gloor, E: Environmental change and the carbon balance of Amazonian forests, Biol. Rev., 89, 913–931, 2014.
Araujo, A., Nobre, A., Kruijt, B., Elbers, J., Dallarosa, R., Ste-fani, P., von Randow, C., Manzi, A., Culf, A., Gash, J., Valentini, R., and Kabat, P.: Comparative measurements of carbon dioxide fluxes from two nearby towers in a central Amazonian rainforest: The Manaus LBA site, J. Geophys. Res., 107, 58.1–58.20, 2002. Atkin, O. K. and Macherel, D.: The crucial role of plant mitochon-dria in orchestrating drought tolerance, Ann. Bot. London, 103, 581–597, 2009.
Atkin, O. K., Meir, P., and Turnbull, M. H.: Improving repre-sentation of leaf respiration in large-scale predictive climate– vegetation models, New Phytologist, 202, 743–748, 2014. Aubinet, M., Grelle, A., Ibrom, A., Rannik, U., Moncrieff, J.,
Fo-ken, T., Kowalski, A. S., Martin, P., Berbigier, P., Bernhofer, C., Clement, R., Elbers, J., Granier, A., Grunwald, T., Morgenstern, K., Pilegaard, K., Rebmann, C., Snijders, W., Valentini, R., and Vesala, T.: Estimates of the annual net carbon and water ex-change of forests: The Euroflux methodology, Adv. Ecol. Res., 30, 113–175, 2000.
Aubinet, M., Heinesch, B., and Longdoz, B.: Estimation of the car-bon sequestration by a heterogeneous forest: night flux correc-tions, heterogeneity of the site and inter-annual variability, Glob. Change Biol., 8, 1053–1097. 2002.
Baldocchi, D., Falge, E., Gu, L., Olson, R., Hollinger, D., Running, S., Anthoni, P., Bernhofer, C., Davis, K., Evans, R., Fuentes, J., Goldstein, A., Katul, G., Law, B., Lee, X., Malhi, Y., Meyers, T., Munger, W., Oechel, W., Paw U, K. T., Pilegaard, K., Schmid, H. P., Valentini, R., Verma, S., Vesala, S., Wilson, K., and Wofsy, S.: FLUXNET: A new tool to study the temporal and spatial variabil-ity of ecosystem-scale carbon dioxide, water vapor, and energy flux densities, B. Am. Meteorol. Soc., 82, 2415–2434. 2001. Baker, I. T., Prihodko, L., Denning, A. S., Goulden, M. L., Miller,
S., and da Rocha, H. R.: Seasonal drought stress in the ama-zon: reconciling models and observations, J. Geophys. Res., 113, 2005–2012, doi:10.1029/2007JG000644, 2008.
Baker, I. T., Harper, A. B., da Rocha, H. R., Denning, A. S., Araújo, A. C., Borma, L. S., Freitas, H. C., Goulden, M. L., Manzi, A. O., Miler, S.D., Nobre, A. D., Restro-Coupe, N., Saleska S. R., Stöckli, R., von Randow, C., and Wofsy, S. C.: Surface ecophys-iological behavior across vegetation and moisture gradients in tropical South America, Agric. For. Meteorol., 182–183, 177– 188, 2013.
Ball, J. T., Woodrow, I. E., and Berry, J. A.: A model predicting stomatal conductance and its contribution to the control of photo-synthesis under different environmental conditions, in: Progress in Photosynthesis Research, vol. 4, edited by: Biggins, J., Marti-nus Nijhoff, the Netherlands, 221–224, 1987.
Beer, C., Reichstein, M., Tomelleri, E., Ciais, P., Jung, M., Carval-hais, N., Rodenbeck, C., Arain, M. A., Baldocchi, D., Bonan, G. B., Bondeau, A., Cescatti, A., Lasslop, G., Anders, L., Lomas, M., Luyssaert, S., Margolis, H., Olewson, K. W., Roupsard, O., Veenendaal, E., Viovy, N., Williams, C., Woodward, F. I., and Papale, D.: Terrestrial gross carbon dioxide uptake: global dis-tribution and covariation with climate, Science, 329, 834–838, doi:10.1126/science.1184984, 2010.
Berthelot, M., Friedlingstein, P., Ciais, P., Dufresne, J.-L., and Mon-fray, P.: How uncertainties in future climate change predictions translate into future terrestrial carbon fluxes, Glob. Change Biol., 11, 959–970, doi:10.1111/j.1365-2486.2005.00957.x, 2005. Bonal, D., Bosc, A., Ponton, S., Goret, J. Y., Burban, B., Gross,
P., Bonnefond, J. M., Elbers, J., Longdoz, B., Epron, D., Guehl, J. M., and Granier, A.: Impact of severe dry season on net ecosystem exchange in the neotropical rainforest of french guiana, Glob. Change Biol., 14, 1917–1933, doi:10.1111/j.1365-2486.2008.01610.x, 2008.
Bonan, G. B., Lawrence, P. J., Oleson, K. W., Levis, S., Jung, M., Reichstein, M., Lawrence, D. M., and Swenson, S. C.: Improving canopy processes in the Community Land Model version 4(CLM4) using global flux fields empirically in-ferred from FLUXNET data, J. Geophys. Res., 116, G02014, doi:10.1029/2010JG001593, 2011.
Bonan, G. B., Oleson, K. W., Fisher, R. A., Lasslop, G., and Re-ichstein, M.: Reconciling leaf physiological traits and canopy flux data: use of the TRY and FLUXNET databases in the Com-munity Land Model version 4, J. Geophys. Res., 117, G02026, doi:10.1029/2011JG001913, 2012.
Bruno, R. D., da Rocha, H. R., de Freitas, H. C., Goulden, M. L., and Miller, S. D.: Soil moisture dynamics in an eastern Amazonian tropical forest, Hydrol. Processes, 20, 2477–2489, doi:10.1002/hyp.6211, 2006.
Calvet, J.: Investigating soil and atmospheric plant water stress us-ing physiological and micrometeorological data, Agric. For. Me-teorol., 103, 229–247, 2000.
Calvet, J. C. and Soussana J., F.: Modelling CO2-enrichment effects
using an interactive vegetation SVAT scheme, Agr. For. Meteol., 108, 129–152, 2001.
Calvet, J. C., Noilhan, J., Roujean, J. L., Bessemoulin, P., Ca-belguenne, M., Olioso, A., and Wigneron, J. P.: An interactive vegetation SVAT model tested against data from six contrasting sites, Agr. Forest Meteorol., 92, 73–95, 1998.
Calvet, J. C., Rivalland, V., Picon-Cochard, C., and Guehl, J. M.:
Modelling forest transpiration and CO2fluxes response to soil
moisture stress, Agr. For. Meteorol., 124, 143–156, 2004. Carrer, D., Roujean, J. L., Lafont, S., Calvet, J. C., Boone, A.,
Decharme, B., Delire, C., and Gastellu-Etchegorry, J. P.: A canopy radiative transfer scheme with explicit FAPAR for the in-teractive vegetation model ISBA-A-gs: impact on carbon fluxes, J. Geophys. Res.-Biogeo., 118, 1–16, doi:10.1002/jgrg.20070, 2013.
Chambers, J. Q., Tribuzy, E. S., Toledo, L. C., Crispim, B. F., Higuchi, N., dos Santos, J., Araujo, A. C., Kruijt, B., Nobre, A. D., and Trumbore, S. E.: Respiration froma tropical forest ecosystem: partitioning of sources and low carbon use efficiency, Ecol. Appl., 14, S72–S88, 2004.
Costa, M. H., Biajoli, M. C., Sanches, L., Malhado, A. C. M., Hutyra, L. R., Da Rocha, H. R., Aguiar, R. G., and De Araújo, A. C.: Atmospheric versus vegetation controls of Amazonian trop-ical rain forest evapotranspiration: Are the wet and seasonally dry rain forests any different?, J. Geophys. Res.-Biogeosci., 115, 1–9, doi:10.1029/2009JG001179, 2010.
Cox, P. M., Pearson, D., Booth, B. B., Friedlingstein, P., Hunting-ford, C., Jones, C. D., and Luke, C. M.: Sensitivity of tropical carbon to climate change constrained by carbon dioxide variabil-ity, Nature, 494, 341–344, 2013.
Dalmonech, D., Foley, A. M., Anav, A., Friedlingstein, P., Friend, A. D., Kidston, M., Willeit, M., and Zaehle, S.: Challenges and opportunities to reduce uncertainty in projections of
fu-ture atmospheric CO2: a combined marine and terrestrial
bio-sphere perspective, Biogeosciences Discuss., 11, 2083–2153, doi:10.5194/bgd-11-2083-2014, 2014.
da Rocha, H. R., Goulden, M. L., Miller, S. D., Menton, M. C., Pinto, L. D., de Freitas, H. C., and Silva Figueira, A. M.: Sea-sonality of water and heat fluxes over a tropical forest in eastern Amazonia, Ecol. Applic., 14, S22–S32, 2004.
da Rocha, H. R., Manzi, A. O., Cabral, O. M., Miller, S. D., Goulden, M. L., Saleska, S. R., Restro- Coupe, N.,Wofsy, S. C., Borma, L. S., Artaxo, P., Vourlitis, G., Nogueira, J. S., Cardoso, F. L., Nobre, A. D., Kruijt, B., Freitas, H. C., von Randow, C., Aguiar, R. G., and Maia, J. F.: Patterns of wa-ter and heat flux across a biome gradient from tropical forest to savanna in Brazil, J. Geophys. Res. Biogeo., 114, G00B12, doi:10.1029/2007JG000640, 2009.
Decharme, B., Douville, H., Boone, A., Habets, F., and Noilhan, J.: Impact of an exponential profile of saturated hydraulic conduc-tivity within the ISBA LSM: simulations over the Rhone basin, J. Hydrometeorol., 7, 61–80, 2006.
Decharme, B., Boone, A., Delire, C., and Noihlan, J.: Local evalu-ation of the Interaction between Soil Biosphere Atmosphere soil multilayer diffusion scheme using four pedotransfer functions, J. Geophys. Res., 116, 1984–2012, 2011.
Decharme, B., Martin, E., and Faroux, S.: Reconciling soil ther-mal and hydrological lower boundary conditions in land surface models, J. Geophys. Res.-Atmos., 118, 1–16, 2013.
de Rosnay, P., Bruen, M., and Polcher, J.: Sensitivity of sur-face fluxes to the number of layers in the soil model
used in GCMs, Geophys. Res. Lett., 27, 3329–3332,
doi:10.1029/2000GL011574, 2000.
de Rosnay, P., Polcher, J., Bruen, M., and Laval, K.: Impact of a physically based soil water flow and soil-plant interaction rep-resentation for modeling large-scale land surface processes, J. Geophys. Res.-Atmos., 107, 4118, doi:10.1029/2001JD000634, 2002.
Desai, A. R., Richardson, A. D., Moffat, A. M., Kattge, J., Hollinger, D. Y., Barr, A., Falge, E., Noormets, A., Papale, D., Reichstein, M., and Stauch, V. J.: Cross site evaluation of eddy covariance GPP and RE decomposition techniques, Agr. Forest Meteorol., 148, 821–838, doi:10.1016/j.agrformet.2007.11.012, 2008.
De Weirdt, M., Verbeeck, H., Maignan, F., Peylin, P., Poulter, B., Bonal, D., Ciais, P., and Steppe, K.: Seasonal leaf dynamics for tropical evergreen forests in a process-based global ecosystem model, Geosci. Model Dev., 5, 1091–1108, doi:10.5194/gmd-5-1091-2012, 2012.
Domingues, T. F., Berry, J. A., Martinelli, L. A., Ometto, J., and Ehleringer, J. R.: Parameterization of canopy structure and leaf-level gas exchange for an eastern Amazonian tropical rain forest (Tapajós National Forest, Para, Brazil), Earth Interact., 9, EI149, doi:10.1175/EI149.1, 2005.
Domingues, T. F., Martinelli, L. A., and Ehleringer, J. R.: Eco-physiological traits of plant functional groups in forest and pas-ture ecosystems from eastern Amazonia, Brazil, Plant Ecol., 193, 101–112, 2007.
Eltahir, E. and Bras, R. L.: Precipitation recycling in the Amazon Basin, Q. J. Roy. Meteorol. Soc., 120, 861–880, 1994.
Espírito-Santo, F. D. B., Gloor, M., Keller, M., Malhi, Y., Saatchi, S., Nelson, B., Junior, R. C. O., Pereira, C., Lloyd, J., Frolk-ing, S., Palace, M., Shimabukuro, Y. E., Duarte, V., Mendoza, A. M., López-González, G., Baker, T. R., Feldpausch, T. R., Brienen, J. W., Asner, P., Boyd, D. S., and Phillips, O. L.: Size and frequency of natural forest disturbances and the Ama-zon forest carbon balance, Nature communications, 5, 3434, doi:10.1038/ncomms4434, 2014.
Farquhar, G. D., von Caemmerer, S., and Berry, J. A.: A
biochem-ical model of photosynthetic CO2assimilation in leaves of C3
species, Planta, 149, 78–90, 1980.
Field, C. B. and Mooney, H. A.: The photosynthesis-nitrogen re-lationship in wild plants, in: The Economy of Plant Form and Function, edited by: Givnish, T. J., Cambridge University Press, Cambridge, 25–55, 1986.
Fisher, R. A.,Williams, M., da Costa, A. L., Malhi, Y., da Costa, R. F., Almeida, S., and Meir, P.: The response of an Eastern Amazo-nian rain forest to drought stress: results and modelling analyses from a throughfall exclusion experiment, Glob. Change Biol., 13, 2361–2378, 2007.
Foley, J. A., Prentice, C., Ramankutty, N., Levis, S., Pollard, D., Sitch, S., and Haxeltine, A.: An integrated biosphere model of land surface processes, terrestrial carbon balance, and veg-etation dynamics, Global Biogeochem. Cycles, 10, 603–628, doi:10.1029/96GB02692, 1996.
Foley, J. A., Costa, M. H., Delire, C., Ramankutty, N., and Sny-der, P.: Green surprise? How terrestrial ecosystems could affect earth’s climate, Front. Ecol. Environ., 1, 38–44, 2003.
Friedlingstein, P., Cox, P., Betts, R., Bopp, L., von Bloh, W., Brovkin, V., Cadule, P., Doney, S., Eby, M., Fung, I., Bala, G., John, J., Jones, C., Joos, F., Kato, T., Kawamiya, M., Knorr, W., Lindsay, K., Matthews, H. D., Raddatz, T., Rayner, P., Re-ick, C., Roeckner, E., Schnitzler, K. G., Schnur, R., Strassmann, K., Weaver, A. J., Yoshikawa, C., and Zeng, N.: Climatecarbon cycle feedback analysis: results from the C4MIP model inter-comparison, J. Climate, 19, 3337–3353, 2006.
Fu, R., Yin, L., Li, W., Arias, P. A., Dickinson, R. E., Huang, L., Chakraborty, S., Fernandes, K., Liebmann, B., Fisher, R. A., and Myneni, R. B.: Increased dry-season length over southern Amazonia in recent decades and its implication for future cli-mate projection, P. Natl. Acad. Sci. USA, 110, 18110–18115, doi:10.1073/pnas.1302584110, 2013.
Gatti, L. V., Miller, J. B., D’Amelio, M. T. S., Martinewski, A., Basso, L. S., Gloor, M. E., Wofsy, S., and Tans, P.: Vertical
pro-filer of CO2above eastern Amazonia suggest a net carbon flux to
the atmosphere and balanced biosphere between 2000 and 2009, Tellus B, 20, 581–594, doi:10.1111/j.1600-0889.2010.00484.x, 2010.
Gibelin, A. L., Calvet, J. C., Roujean, J. L., Jarlan, L., and Los, S. O.: Ability of the land surface model ISBA-A-gs to simulate leaf area index at the global scale: Compari-son with satellites products, J. Geophys. Res., 11, D18102, doi:10.1029/2005JD0066911, 2006.
Gibelin, A. L., Calvet, J. C., and Viovy, N.: Modelling energy and
CO2fluxes with an interactive vegetation, land surface model,
Evaluation at high and middle latitudes, Agr. For. Meteorol., 148, 1611–1628, 2008.
Gloor, M., Gatti, L., Brienen, R., Feldpausch, T. R., Phillips, O. L., Miller, J., Ometto, J. P., Rocha, H., Baker, T., de Jong, B., Houghton, R. A., Malhi, Y., Aragão, L. E. O. C., Guyot, J.-L., Zhao, K., Jackson, R., Peylin, P., Sitch, S., Poulter, B., Lomas, M., Zaehle, S., Huntingford, C., Levy, P., and Lloyd, J.: The car-bon balance of South America: a review of the status, decadal trends and main determinants, Biogeosciences, 9, 5407–5430, doi:10.5194/bg-9-5407-2012, 2012.
Good, P., Jones, C., Lowe, J., Betts, R., and Gedney, N.: Compar-ing tropical forest projections from two generations of Hadley Centre Earth System models, HadGEM2-ES and HadCM3LC, J. Climate, 26, 495–511, 2013.
Goudriaan, J.: A simple and fast numerical method for the computa-tion of daily totals of crop photosynthesis, Agric. For. Meteorol., 38, 249–254, 1986.
Goudriaan, J., van Laar, H. H., van Keulen, H., and Louwerse, W.:
Photosynthesis, CO2and plant production, in: Wheat growth and
modelling, edited by: Day, W. and Atkin, R. K., NATO AS/ Se-ries, Series A, vol. 86, Plenum Press, New York, 107–122, 1985. Goulden, M. L., Miller, S. D., da Rocha, H. R., Menton, M. C., de Freitas, H. C., Figueira, A. M. E. S., and de Sousa, C. A. D.:
Diel and seasonal patterns of tropical forest CO2exchange, Ecol.
Appl., 14, 42–54, 2004.
Grant, R., Hutyra, L., and Oliveira, R.: Modeling the carbon balance of Amazonian rain forests: resolving ecological controls on net ecosystem productivity, Ecol. Monogr., 79, 445–463, 2009. Hollinger, D. Y. and Richardson, A. D.: Uncertainty in eddy
covari-ance measurements and its application to physiological models, Tree Physiol., 25, 873–885, 2005.
Huntingford, C., Zelazowski, P., Galbraith, D., Mercado, L. M., Sitch, S., Fisher, R. A., Lomas, M., Walker, A. P., Jones, C. D., Booth, B. B. B., Malhi, Y., Hemming, D., Kay, G., Good, P., Lewis, S. L., Phillips, O. L., Atkin, O. K., Lloyd, J., Gloor, E., Zaragoza-Castells, J., Meir, P., Betts, R., Harris, P. P., Nobre, C., Marengo, C., and Cox, P. M.: Simulated resilience of tropical
rainforests to CO2-induced climate change, Nat. Geosci., 6, 268–
273, 2013.
Jackson, R. B., Canadell, J., Ehleringer, J. R., Mooney, H. A., Sala, O. E., and Schulze, E. D.: A global analysis of root distributions for terrestrial biomes, Oecologia, 108, 389–411, 1996.
Jacobs, C. M. J.: Direct impact of atmospheric CO2enrichment on
regional transpiration, PhD thesis, Agricultural University, Wa-geningen, 1994.
Joetzjer, E., Douville, H., Delire, C., and Ciais, P.: Present-day and future Amazonian precipitation in global climate models: CMIP5 versus CMIP3, Clim. Dynam., 41, 2921–2936, 2013.
Joetzjer, E., Delire, C., Douville, H., Ciais, P., Decharme, B., Fisher, R., Christoffersen, B., Calvet, J. C., da Costa, A. C. L., Fer-reira, L. V., and Meir, P.: Predicting the response of the Amazon rainforest to persistent drought conditions under current and
fu-ture climates: a major challenge for global land surface models, Geosci. Model Dev., 7, 2933–2950, doi:10.5194/gmd-7-2933-2014, 2014.
Jones, C., Robertson, E., Arora, V., Friedlingstein, P., Shevliakova, E., Bopp, L., Brovkin, V., Hajima, T., Kato, E., Kawamiya, M., Liddicoat, S., Lindsay, K., Reick, C. H., Roelandt, C.,
Segschnei-der, J., and Tjiputra, J.: Twenty-first-century compatible CO2
emissions and airborne fraction simulated by CMIP5 Earth Sys-tem Models under four representative concentration pathways, J. Climate, 26, 4398–4413, 2013.
Keenan, T. F., Hollinger, D. Y., Bohrer, G., Dragoni, D., Munger, J. W., Schmid, H. P., and Richardson, A. D.: Increase in for-est water-use efficiency as atmospheric carbon dioxide concen-trations rise, Nature, 499, 324–327, doi:10.1038/nature12291, 2013.
Kim, Y., Knox, R. G., Longo, M., Medvigy, D., Hutyra, L. R., Pyle, E. H., Wofsky, S. C., Bras, R. L., and Moorcroft, P. R.: Seasonal carbon dynamics and water fluxes in an Amazon rainforest, Glob. Change Biol., 18, 1322–1334, 2012.
Krinner, G., Viovy, N., de Noblet-Ducoudre, N., Ogee, J., Polcher, J., Friedlingstein, P., Ciais, P., Sitch, S., and Prentice, I.: A dynamic global vegetation model for studies of the coupled atmosphere-biosphere system, Global Biogeochem. Cy., 19, 1– 33, 2005.
Kucharik, C. J., Foley, J. A., Delire, C., Fisher, V. A., Coe, M. T., Lenters, J. D., Young-Molling, C., Ramankutty, N., Norman, J. M., and Gower, S. T.: Testing the performance of a dynamic global ecosystem model: water balance, carbon balance, and vegetation structure, Global Biogeochem. Cycles, 14, 795–825, 2000.
Kruijt, B., Elbers, J. A., von Randow, C., Araújo, A. C., Oliveira, P. J., Culf, A., Manzi, A. O., Nobre, A. D., Kabat, P., and Moors, E. J.: The robustness of eddy correlation fluxes for Amazon rain forest conditions, Ecol. Appl., 14, 101–113, 2004.
Lemaire, G. and Gastal, F.: N Uptake and Distribution in Plant Canopies, in: Diagnosis of the Nitrogen Status in Crops, edited by: Lemaire, G., Springer-Verlag, Heidelberg, 3–43, doi:10.1007/978-3-642-60684-7_1, 1997.
Lewis, S. L., Lloyd, J., Sitch, S., Mitchard, E. T., and Laurance, W. F.: Changing ecology of tropical forests: evidence and drivers, Annu. Rev. Ecol., Evolution, Systematics, 40, 529–549, 2009. Lloyd, J. and Taylor, J. A.: On the temperature dependence of soil
respiration, Functional Eco., 8, 315–323, 1994.
Malhi, Y., Wood, D., Baker, T. R., Wright, J., Phillips, O. L., Cochrane, T., Meir, P., Chave, J., Almeida, S., Arroyo, L., Higuchi, N., Killeen, T. J., Laurance, S. G., Laurance, W. F., Lewis, S. L., Monteagudo, A., Neill, D. A., NúñezVargas, P., Pit-man, N. C. A., Quesada, C. A., Salomão, R., Silva, J. N. M., Tor-res Lezama, A., Terborgh, J., Vásquez Martínez, R., and Vinceti, B.: The regional variation of aboveground live biomass in old growth Amazonian forests, Glob. Change Biol., 12, 1107–1138, 2006.