Immersed Membrane BioReactor (IMBR) for treatment of combined domestic and
dairy wastewater in an isolated farm: An exploratory case study implementing the
Facet Analysis (FA)
Amos Bick
a,b,⁎
, Jaime G. Plazas T
c, Fei Yang
d, Adi Raveh
e, Josef Hagin
g, Gideon Oron
d,f,gaDepartment of Industrial Engineering and Management, Jerusalem College of Technology, Jerusalem, 21 Havaad Haleumi St. Jerusalem., 91160, Israel b
Department of Chemical Engineering, Shenkar College of Engineering and Design, 12 Anna Frank street, Ramat Gan , 52526, Israel
c
Department of Civil and Environmental Engineering, Universidad de los Andes Bogotá, Colombia
d
Zuckerberg Institute for Water Research, J. Blaustein Institutes for Desert Research, Ben-Gurion University of the Negev, Kiryat Sde Boker, 84990, Israel
e
The School of Business Administration, The Hebrew University, Mt. Scopus, Jerusalem, 91905, Israel
f
Department of Industrial Engineering and Management, Ben-Gurion University of the Negev, Beer Sheva, 84105, Israel
g
The Grand Water Research Institute, Technion, Haifa 32000, Israel
a b s t r a c t
a r t i c l e i n f o
Article history: Accepted 28 June 2009 Available online xxxx
Keywords: Dairy Wastewater Facet Analysis Management Modeling Membrane BioReactor Ultrafiltration
In many regions dairy farms and milk processing industries, discharge large quantities of their wastes to the surroundings which pose serious environmental risks. With the purpose of treating the combined dairy and domestic wastewater from a small dairy farm in the Negev Desert of Israel, the use of a recent emerging technology of Immersed Membrane BioReactor (IMBR) was evaluated over the course of 500 test hours, under a variety of wastewater feed quality conditions.
Field experiments were performed at the Kornmehl farm, an isolated dairy farm located 30 km south of Beer-Sheva, in the Negev Desert of Israel. The operating conditions for this experiment included constant product flow of 7 (L/h)], and the transmembrane pressure was increased smoothly during the experiment from 0.05 to 0.13 bar. Temperatures ranged between 30 °C and 37 °C, pH ranged between 4 and 9, TSS varied between 353 mg/L to 1000 mg/L and COD changed from 900 mg/L to 12,800 mg/L.
The overall performance of a pilot-scale Ultrafiltration (UF) IMBR process for a combined domestic and dairy wastewater was analyzed based on the Facet Analysis (FA) method. Preliminary results of the FA model indicate: (i) the Trans-Membrane Pressure (TMP); the pH and the temperature do not have an effect on the performance of the permeate normalizedflux and on the specific normalizedflux, and; (ii) the bioreactor is characterized by high concentration of organic matters and it can be estimated that the IMBR normalizedflux decline is dependent on other variables (air blower performance, backwash procedure and chemical cleaning). © 2009 Elsevier B.V. All rights reserved.
1. Introduction
The scarcity of water resources in arid and semi-arid areas of the world, especially in the Mediterranean Basin, has changed public attitude towards wastewater management. Adequate management of wastewater is now a necessity, not just an option.
Dairy industries and milk processing farms frequently discharge their wastes directly to the close surroundings, generating environmental nuisances. As result of the multiple activities carried out during the processing of dairy products (i.e. pasteurization, cleaning, and disinfection of the milking sheds and other facilities), dairy wastewater usually contains high concentrations of organic matter, solids, and nutrients, as
well as some dissolved inorganic pollutants[1–3]. Consequently, dairy wastewater deserves special attention since its levels of potential contaminants typically exceed those levels considered hazardous for domestic wastewater[4–9](Table 1).
Despite the large number of publications, membrane treatment of wastewater is not well understood due to the complexity of the interacting phenomena and the multitude of module and reactor configurations as well as wastewater and operating conditions[10,11]. In this current paper the facet analysis method is implemented to clarify membrane pilot that uses a combined domestic and dairy wastewater operation at a constant productflow.
2. Immersed Membrane Bioreactor (IMBR) performance
The advanced tested treatment method is based on the Immersed Membrane BioReactor (IMBR). In contrast to the traditional technologies (i.e. stabilization ponds, activated sludge, etc.), the IMBR is a compact
Desalination xxx (2009) xxx–xxx
⁎Corresponding author.
E-mail addresses:[email protected](A. Bick),[email protected] (J.G. Plazas T),[email protected](F. Yang),[email protected](A. Raveh), [email protected](J. Hagin),[email protected](G. Oron).
DES-09356; No of Pages 6
0011-9164/$–see front matter © 2009 Elsevier B.V. All rights reserved. doi:10.1016/j.desal.2009.06.035
Contents lists available atScienceDirect
Desalination
j o u r n a l h o m e p a g e : w w w. e l s e v i e r. c o m / l o c a t e / d e s a l
system (small footprint) with a high capacity of treating varying quality wastes and efficient energy use[12–20].
The average Trans-Membrane Pressure (TMP) is generally given for an IMBR by[21]:
Ptm= 0:5ðPi+PoÞ Pp ð1Þ
where Ptm is the Trans-Membrane Pressure (bar), Pi is the inlet
pressure of the membrane module (bar),Pois the pressure at the
outlet of the membrane module (bar) andPpis the permeate pressure
(bar). Temperature corrections to 20 °C for permeateflux are made according to Eq. (2), which is based on the variation of water viscosity with temperature[22]:
Jn=ðQ pu f⋅e
0:0239ðT20ÞÞ=Auf ð2Þ
WhereJnis the normalized permeateflux (at 20 °C), L/(hour·m2); Q pufis the permeateflow, L/hour;Tis actual operating temperature,
°C, and,Aufis the membrane surface area, m2. The specific normalized
flux, [Jns, L/(hour·m2·bar)] at 20 °C is given by Eq. (3):
Jns=Jn=TMP ð3Þ
Subject to the above following expressions it can be concluded: (i) the specific normalizedflux depends primarily on TMP, and; (ii) there is probably a very low correlation between the normalizedflux and the colloidal molecular weight of the suspended matter in the solution. These equations that describe the used cross-flow UF model have several drawbacks: (i) The quantitative expressions do not account for the effluent quality, membrane characteristics and fouling processes, and; (ii) there are limited explanations for the heavy metal removal by hybrid complexation and polymer-enhanced Ultrafi ltra-tion[23].
The purpose of the paper is to demonstrate the use of Facet Analysis (FA) for clear distinction of the cluster of variables[24–28]
affecting the IMBR performance. The following objectives are expected to be achieved in the framework of this paper: (i) development of a conceptual approach enabling to present effluent quality interactions with membrane treatment processes; (ii) iden-tifying interaction between state variables (effluent quality) and operational variables (TMP, normalizedflux), and; (iii) to apply the FA to an IMBR system (for treatment of combined domestic and dairy wastewater).
3. Management modelling
3.1. General
Management modeling provides effective means of rapidly testing and evaluating different scenarios for a given system operated under diverse conditions. Well-defined models allow examination diverse hypothetical
situations, which yield perceptive insight into the analyzed phenomena. The various aspects of IMBR can be viewed at the following levels: (i) the local level of the isolated process: economic, chemical, microbial and membrane performance criteria[15,16], and; (ii) at the regional level of water sources utilization, environmental control, including membrane technology issues[29,30]. At this level, IMBR performance is only one link in a multi-component system. Other phases to be considered in management modeling include environmental pollution, disposal of concentrates, public involvement regulatory and risk issues[31].
Management models provide effective means of rapidly testing and evaluating different water system scenarios for a given set of con-ditions[15]. Well-defined models allow examination of many hypo-thetical situations, which will yield perceptive insight[32]. Although models frequently deviate from real life situations; they provide preferences of optimal system selection and potential directions of processing. These directions can be consequently interpreted by the decision-makers for project evaluation and implementation[33–36].
Facet Analysis is a research approach which has been found to be effective in the depiction and analysis of complex systems, where a large number of mutual interacting variables are involved[37]. In this current paper the FA method is implemented to clarify IMBR system performance.
3.2. The Facet Analysis (FA)
According to FA, it is assumed that a matrix“A”can describe the performance of an IMBR system.
A=αil; i=l;……;N;l=l; ::::;L ð4Þ
where i is a record index [in this case the points (i= 1,……,N) describe the date] and l denotes a variable index [in this case the points (l = 1,….,L) describe the IMBR performance] The similarity coefficientμlmis defined by Eq. (5)[38]:
μlm= ∑N
i= 1 ∑
N
j= 1ð
ail−ajlÞðaim−ajmÞ
∑N
i= 1 ∑
N
j= 1 j
ail−ajlj jaim−ajmj
; i≠j;l≠m ð5Þ
whereμlmis the similarity coefficient of thelth and themth variables andailis the value of the variable. The inter-correlation of the variables,
which serve as the empirical measure of similarity coefficient between them, is expressed in the space by the distances between pairs of point. Therefore, two points of variables are closer together if the correlation between the corresponding variables is high. When the correlation between the two variables is poor, they are farther apart, and the geometric distance between the points is large.
A structured map can be characterized by the similarity coefficients:
dlmðxÞ=fðμlmÞ ð6Þ
wheredlm(x) is a distance (an Euclidean distance) andfis a function
(typically a weak descending monotone function or a linear function). If Eq. (6) does not hold, an optimal solution is searched that minimizes a coefficient of alienation (St) that is defined by Groenen[39]:
St=
ffiffiffiffiffiffiffiffiffiffiffiffiffiffiffiffiffiffiffiffiffiffiffiffiffiffiffiffiffiffiffiffiffiffiffiffiffiffiffiffiffiffiffiffiffiffiffiffiffiffiffi ∑l<m½fðμlmÞ dlmðxÞ2
∑l<md
2
lmðxÞ v
u u
t ð7Þ
[image:2.595.34.284.77.172.2]The smaller the value of the coefficient of alienation—the better is the correlation of Eq. (6). Mapping the problem thus involves a composite optimization problem, however, there are algorithms that almost definitelyfind the best solution[40].
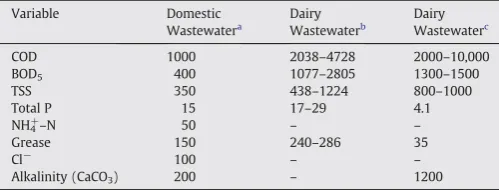
Table 1
Typical composition of untreated domestic and dairy wastewater (mg/L).
Variable Domestic Wastewatera
Dairy Wastewaterb
Dairy Wastewaterc
COD 1000 2038–4728 2000–10,000 BOD5 400 1077–2805 1300–1500
TSS 350 438–1224 800–1000
Total P 15 17–29 4.1
NH4+–N 50 – –
Grease 150 240–286 35
Cl− 100 – –
Alkalinity (CaCO3) 200 – 1200 aMetcalf and Eddy[4]
b
Typical composition of strong concentration untreated dairy wastewater Tawfiket al.[1]
c
Koyuncu et al.[3]
2 A. Bick et al. / Desalination xxx (2009) xxx–xxx
4. Materials and methods
Field experiments were performed at the Kornmehl farm, an isolated dairy farm located 30 km south of Beer-Sheva, in the Negev Desert of Israel[16]. The products manufactured at Kornmehl are based on goat's milk. The raw feed source is dairy and domestic wastewaters are discharged and collected in a settling tank. The wastewater from the settling tank isfiltered by a strainer and pumped into a storage tank located 2 m above the bioreactor, where further settling is maintained. An extrafilter is used (0.130 mm pore diameter) to remove suspended solids and then wastewater is fed into the bioreactor. The characteristics of the raw wastewater generated in the farm are summed inTable 2. (Total of 28 samples). As observed, Kornmehl Farm wastewater contains high concentrations of organics, solids, and nutrients because of the multiple activities comprised during the cheese manufacture (i.e. spilled milk, cheese wastes, goat dung, domestic and cleaning activities, etc).
Zenon Environmental Systems Inc supplied the IMBR used in the experiments as well as its respective components. The IMBR is equipped with an Ultrafiltration ZeeWeed ZW-10 hollow fiber membrane module, with a surface area of 0.93 m2and a nominal pore size of
0.04μm. Other main elements of the system include a 220 Liter process tank, a 20 Liter backpulse tank, a small control panel, a process pump, an permeate pump, and a blower.
The Zenon ZW-10 module was cleaned prior to the system start up of the whole experiment, at the beginning of each experiment, and when the permeability of the membrane during the experiments reached approximately 10–20% of the initial permeability. All chemical cleanings were performed using manufacturers' recommen-dations and protocols. For the system startup, the process tank was
filled with potable water and sufficient NaOCl was added to produce a 200-mg/L solution. The module was soaked in this solution at 25 °C for 24 h. After this period, the process tank contents were replaced and the membrane was rinsed with potable water. The initial permeability was then measured.
For maintenance cleaning, the membrane module was soaked with a 200-mg/L solution of NaOCl for 5 h in a clean-up vessel with a volume of 25 L. During this period, aeration was injected to the module to enhance cleaning efficiency. After this, the solution in the tank was replaced with a clean solution and the membrane module was submerged for a second time, to apply a concentrated backwash of 1000-mg/L of NaOCl of the solution for a half hour. At the end of the backwash, the module was cleaned with tap water and the membrane permeability was measured.
Initial specificflux was determined one day prior to the start of the experiment with clean tap water after chemical cleaning of the
mem-brane. The permeateflow rate was set to a constant value by means of potentiometers mounted in the control panel to regulate the process pump. Three samples, namely: influent, bioreactor (MLSS), and effluent were collected on each one of the sampling days to determine wastewater quality and evolution before, during, and after the IMBR system. Data was recorded manually on operational and water quality data sheets prepared specifically for this study. In order to maintain a stable productflow, theflow rate of the wastewater was controlled by an adjustable timer installed on the front of the control panel. Solid Retention Time variation was controlled manually by a drain valve and by altering theflow rate of excessive sludge discharge.
Thefirst stage of the project recorded an operational period of 500 h. The maintenance procedure included a backwashing of 15 s every 5 min and chemical cleaning at following timing: 79, 160, 200, 275, 360 h. Temperatures ranged between 30 °C and 37 °C, with an average temperature of 33 ± 2 °C, typical for this period of the year in the Negev Desert. The operating conditions for this experiment include constant productflow [7 (L/h)], and the pilot was operated at a hydraulic retention time [reactor volume (L) divided by the volume of treated water per hours (L/h)] of 24 h. The transmembrane pressure always increased smoothly during the experiment from 0.05 to 0.13 bar and for 180 h, it was then increased from 0.13 bar to 0.33 bar in one day. The wastewater samples were analyzed according to accepted analytical procedures[41]and the data was analyzed by the FA model.
Twenty variables concerning the IMBR and the permeate perfor-mance were examined: quality variables [PO4≡, NH4+–N, Electrical
Conductivity (EC), pH, BOD5, COD, TSS, Turbidity and Temperature],
Ultrafiltration membrane performance [Trans-membrane Pressure (TMP), normalizedflux and specific normalizedflux].
5. Results and discussion
The measured turbidity in the bioreactor ranged between 310 and 8500 NTU during the entire experiment, the effluent turbidity varied between 0.3 and 3.9 NTU (Rejection is more than 98.8 percent), while the TSS varied between 0 and 48 mg/L (Rejection is more than 75%). Poor COD and BOD5 rejection rates were obtained during the
experiment: Average of 50.4% and 47.6% in the effluent were found. There was negligible NH4+and PO4≡removal (less than 10%).
[image:3.595.44.310.570.748.2]The results were analyzed by the FA algorithm that consists of the following phases[40]: (i) computing the similarity coefficient matrix (Table 3); (ii) matching points in a Euclidean space, and; (iii) perfor-ming iterations and representing variables on a map of distances.
Table 3presents the matrix of the similarity coefficients for the observed variables calculated. The original coefficient were multiplied by 100 and rounded into integer numbers. Some of the correlation coefficients between the twenty variables are negative. The negative signs correspond to variables of different clusters.
According to the result ofTable 3, the normalized flux and the specific normalized flux are not correlated with the bioreactor variables (COD, BOD5, TSS, NTU). The results of a two-dimension
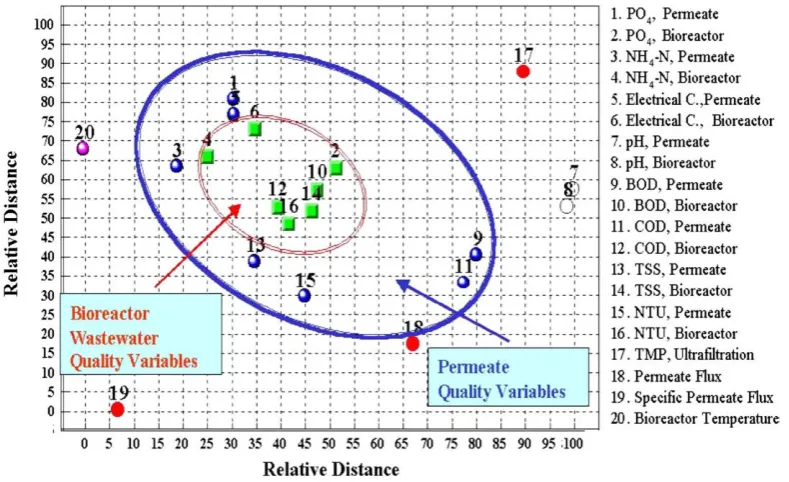
facet analysis for the twenty variables (Table 3) are shown inFig. 1. Two elliptical curves (Fig. 2) divide the variables into three facets, each of them includes several variables: (i) the bioreactor wastewater quality variables (COD, BOD5, TSS, NTU, PO4≡, NH4+, EC); (ii) overall
UF permeate performance (COD, BOD5, TSS, NTU, PO4≡, NH4+, EC),
and; (iii) UF performance variables (normalized flux, specific normalized flux, TMP and external process variables such as the temperature and the pH.
Preliminary results of the FA model indicate the following (Fig. 2): (i) there are high correlations (small distances) between the constituent content in the bioreactor (BOD5, COD, TSS and turbidity);
(ii) concerning specific inorganic constituent (NH4+, Electrical
con-ductivity, pH) there is high correlation (small distances) between the concentrations in the bioreactor and the permeate (implying a low
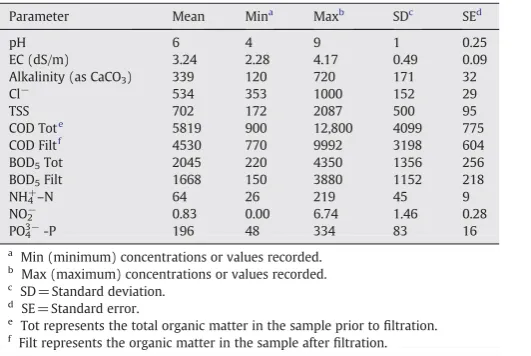
Table 2
Typical composition of constituent concentrations for Kornmehl Farm raw wastewater (mg/L).
Parameter Mean Mina
Maxb
SDc
SEd
pH 6 4 9 1 0.25
EC (dS/m) 3.24 2.28 4.17 0.49 0.09 Alkalinity (as CaCO3) 339 120 720 171 32
Cl− 534 353 1000 152 29
TSS 702 172 2087 500 95
COD Tote
5819 900 12,800 4099 775 COD Filtf
4530 770 9992 3198 604 BOD5Tot 2045 220 4350 1356 256
BOD5Filt 1668 150 3880 1152 218
NH4+–N 64 26 219 45 9
NO2− 0.83 0.00 6.74 1.46 0.28
PO43−-P 196 48 334 83 16 a
Min (minimum) concentrations or values recorded.
b Max (maximum) concentrations or values recorded. c SD = Standard deviation.
d
SE = Standard error.
e
Tot represents the total organic matter in the sample prior tofiltration.
f
Filt represents the organic matter in the sample afterfiltration.
3 A. Bick et al. / Desalination xxx (2009) xxx–xxx
rejection); (iii) the pH and the temperature have a negligible effect on the performance of the immersed membrane normalizedflux and on the specific normalized flux; (iv), the pH of the system can be considered as a state variable, and can be considered as an input effluent quality, and; (v) the bioreactor is characterized by high concentration of organic matters (Table 2) and it can be estimated that the IMBR normalizedflux decline depends on other variables (air blower performance, backwash procedure and the frequency of che-mical cleaning).
Concerning IMBR performance, the fouling remains the major issue and in order to reduce fouling, air and mixed liquor are introduced into the bottom of the membrane modules through an‘airlift effect’. The air bubbles blend with the mixed liquor and rise up into membranefibers,
providing an effective scouring action on the membrane's surface, and refreshing the surface to prevent solids concentration polarization.
According to the literature, air sparging, backflushing and high crossflow velocity are the main anti-fouling strategies[42,43]and an elevated rate of aeration can reduce the probability of sludge attaching to the membrane surface duringfiltration, and enhances the removal of the dynamic sludge layer during the backwashing and idle-cleaning phase [44]. The steady aeration intensity can be theoretically calculated from the boundary layer model and the actual value according to experiments it is nearly 20% higher[45].
[image:4.595.40.554.75.286.2]Low aeration cannot remove the membrane foulants from the membrane surface effectively and too high aeration can induce a severe breakage of sludge flocs [46,47]. It is very important to find the
Table 3
Similarity coefficient matrix for IMBR variables [Eq.(5)].
Variable 1 2 3 4 5 6 7 8 9 10 11 12 13 14 15 16 17 18 19 20
PO4Permeate 1 _ +62 + 72 +79 + 90 +81 −24 −26 −14 + 36 −17 + 60 +31 +42 +31 + 39 + 26 −52 −39 +54
PO4Bioreactor 2 +62 – + 35 + 52 + 73 + 79 + 8 + 8 + 56 + 80 + 24 + 83 + 41 + 87 + 38 + 74 + 4 + 27 −48 −10
NH4−N Permeate 3 +72 +35 – + 98 + 68 + 67 −25 −22 −36 + 43 + 6 +64 + 54 + 44 +42 + 58 + 3 −36 −17 + 76
NH4−N Bioreactor 4 +79 +52 + 98 – + 79 + 80 −24 −22 −22 + +57 +9 + 73 + 54 +58 + 39 + 67 + 3 −30 −27 +70
Electrical C. Permeate 5 +90 +73 + 68 +79 – + 97 −41 −42 + 7 + 56 +5 + 66 +22 +57 +13 + 53 −2 −32 −30 + 56 Electrical C. Bioreactor 6 +81 +79 + 67 +80 +97 – −36 −36 + 17 + 72 + 16 + 71 + 24 + 69 + 9 + 64 −7 −16 −34 +49 pH Permeate 7 −24 +8 −25 −24 −41 −36 – + 99 + 42 −5 +39 −5 +10 −3 +25 −6 + 70 +27 −66 −70 pH Bioreactor 8 −26 +8 −22 −22 −42 −36 + 99 – + 44 −3 +45 −1 + 15 + 1 + 30 + 0 + 65 + 32 −63 −68 BOD5Permeate 9 −14 +56 −36 −22 + 7 + 17 + 42 + 44 – + 37 +70 +30 + 1 +47 +11 + 34 −3 +68 −32 −63
BOD5Bioreactor 10 +36 +80 + 43 +57 +56 +72 −5 −3 +37 – + 22 + 79 + 51 + 91 + 12 + 86 −19 +42 −32 + 4
COD Permeate 11 −17 +24 + 6 + 9 +5 +16 + 39 +45 + 70 + 22 – + 22 + 3 + 28 + 15 + 34 + 0 + 43 −28 −16 COD Bioreactor 12 +60 +83 + 64 +73 +66 +71 −5 −1 + 30 + 79 + 22 – + 81 + 95 + 63 + 95 −20 + 33 −18 + 17 TSS Permeate 13 +31 +41 + 54 +54 + 22 +24 + 10 + 15 +1 + 51 + 3 +81 – + 70 + 70 + 80 −17 + 35 +3 + 11 TSS Bioreactor 14 +42 +87 + 44 +58 + 57 +69 −3 + 1 + 47 + 91 + 28 + 95 +70 – + 46 + 96 −29 +52 −18 −1 NTU Permeate 15 +31 +38 + 42 +39 +13 +9 + 25 + 30 + 11 + 12 +15 + 63 + 70 +46 – + 50 −1 +22 −1 −5 NTU Bioreactor 16 +39 +74 + 58 +67 +53 +64 −6 + 0 + 34 + 86 + 34 + 95 +80 +96 +50 – −34 +49 −9 +15 TMP 17 +26 +4 + 3 +3 −2 −7 + 70 + 65 −3 −19 + 0 −20 −17 −29 −1 −34 – −47 −84 −22 Flux Permeate 18a −52 +27 −36 −30 −32 −16 +27 + 32 + 68 + 42 +43 +33 + 35 + 52 +22 + 49 −47 – + 19 −62
Specific Flux Permeate 19a −39 −48 −17 −27 −30 −34 −66 −63 −32 −32 −28 −18 + 3 −18 −1 −9 −84 + 19 – + 23
Temperature Bioreactor 20 +54 −10 + 76 +70 +56 +49 −70 −68 −63 + 4 −16 + 17 +11 −1 −5 +15 −22 −62 −23 – The original coefficient were multiplied by 100 and rounded into integer numbers.
a
[image:4.595.101.495.466.720.2]Normalized to 20 °C (Eq.((2))).
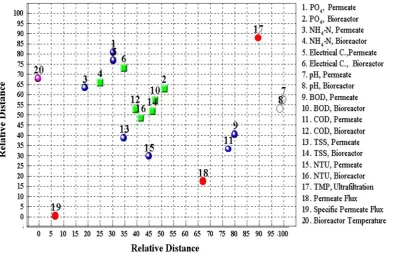
Fig. 1.Properties mapping of Immersed Membrane BioReactor performance [permeateflux and specific permeateflux are normalized to 20 °C (Eq. (2)); Coefficient of alienation (Eq. (7)) equals 0.178).
4 A. Bick et al. / Desalination xxx (2009) xxx–xxx
relationship between sufficient aeration in order to minimize mem-brane fouling, while preventing formation of colloidal particles due to excessive share forces caused by the aeration. Effective distribution of the air over the whole bioreactor is particularly challenging in sub-merged membrane system[48].
The allocation of the membrane modules, as well as the distribution of the air-sparker are very important aspects that influence the bubble
flow patterns, and on the effective aeration intensity. Thefiltration performance can be further improved as the membrane inclination is changed from the vertical position (90°) to an inclined position (160°)
[49].
In general, the fouling problem does not appear to be avoidable for IMBRs. However, sludge cake deposition on the membrane can be minimized by decreasing thefiltrationflux and increasing the aeration rate and for a lower sludge concentration. But, sometimes it has a negative economic impact on wastewater treatment cost. Hence to choose the best combination between aeration, backwashing, chemical cleaning andflux it seems to be an important key for the process.
6. Conclusions
A management model was developed, defining clusters of similar Immersed Membrane BioReactor (IMBR) operational variables and their related ranges. The model provides afirst approximation of UF membrane behavior by means of the Facet Analysis (FA). Membrane performance is discussed in terms of measured variables, permeate normalized flux, specific permeate normalized flux and permeate quality. The analysis provides the rational for a hypothesis concerning the interrelationships among components of bioreactor wastewater quality, permeate quality, and the membrane system operational characteristics.
From the results reported here, the following conclusions can be drawn:
• The normalized flux and the specific normalized flux are not correlated with the bioreactor variables (COD, BOD5, TSS, NTU).
• There are high correlations between the constituent content in the bioreactor (BOD5, COD, TSS and turbidity).Concerning specific
inorganic constituent (NH4+–N, Electrical conductivity, pH) there is
high correlation between the concentrations in the bioreactor and the permeate (implying a low rejection).
• The pH and the temperature have a negligible effect on the performance of the immersed membrane normalizedflux and on the specific normalizedflux. The pH of the system can be considered as a state variable, and can be considered as an input effluent quality.
• It can be estimated that the IMBR normalizedflux decline depends on other variables (air blower performance, backwash procedure and the frequency of chemical cleaning).
Acknowledgments
This work was supported partially by the SMART (Sustainable Management of Available Water Resources with Innovative Technologies) projectfinanced by the Ministry of Science of the German government [Projektantrag zum BMBF-Förderschwerpunkt, Integriertes Wasserres-sourcen-Management (IWRM)], by The Beracha Foundation, The Stephen and Nancy Grand Water Research Institute, The Technion, Haifa Israel, The Palestinian-Jordanian-Israeli Project (PJIP) (1996), on Membrane Tech-nology for Secondary Effluent Polishing: From Raw Sewage to Valuable Waters and Other By-Products, and by The Levin Family Foundation, Dayton, Ohio, USA, on Membrane Use for Wastewater Reclamation Research Authority of Jerusalem College of Technology (JCT), Israel.
References
[1] A. Tawfik, M. Sobhey, M. Badawy, Treatment of a combined dairy and domestic wastewater in an up-flow anaerobic sludge blanket UASB) reactor followed by activated sludge (AS system), Desalination 227 (2008) 167–177.
[2] M. Vourch, B. Balannec, B. Chaufer, G. Dorange, Treatment of dairy industry wastewater by reverse osmosis for water reuse, Desalination 219 (2008) 190–202. [3] I. Koyuncu, M. Turan, D. Topacik, A. Ates, Application of low-pressure nanofi ltra-tion membranes for the recovery and reuse of dairy industry effluents, Water Science and Technology 41 (1) (2000) 213–221.
[4] Metcalf and Eddy, Inc, Wastewater Engineering: Treatment, Disposal, Reuse. 3rd edition, McGraw Hill, New York, 1991.
[5] F. Beolchini, F. Veglio, D. Barba, Microfiltration of bovine and ovine milk for the reduction of microbial content in a tubular membrane: a preliminary investiga-tion, Desalination 161 (2004) 251–258.
[6] M. Meul, F. Nevens, and D. Reheul, Validating sustainability indicators: focus on ecological aspects of Flemish dairy farms, Ecological Indicators 9 (2009) 284–295. [7] Y. Pouliot, Membrane processes in dairy technology—from a simple idea to
[image:5.595.107.502.52.293.2]worldwide panacea, International Dairy Journal 18 (2008) 735–740. Fig. 2.Partitioning mapping of Immersed Membrane BioReactor performance variables [permeateflux and specific permeateflux are normalized to 20 °C (Eq. (2))].
5 A. Bick et al. / Desalination xxx (2009) xxx–xxx
[8] A. Saxena, B.P. Tripathi, M. Kumar, V.K. Shahi, Membrane-based techniques for the separation and purification of proteins: an overview, Advances in Colloid and Interface Science 145 (2009) 1–22.
[9] S. Arros-Alileche, U. Merin, G. Daufin, G. G san-Guiziou, The membrane role in an anaerobic membrane bioreactor for purification of dairy wastewaters: a numerical simulation, Bioresource Technology 99 (2008) 8237–8244.
[10] M. Kraume, D. Wedi, J. Schaller, V. Iversen, A. Drews, Fouling in MBR: what use are lab investigations for full scale operation? Desalination 236 (2009) 94–103. [11] B. Teychene, C. Guigui, C. Cabassud, G. Amy, Toward a better identification of
foulant species in MBR processes, Desalination 231 (2008) 27–34.
[12] T. Stephenson, S. Judd, B. Jefferson, K. Brindle (Eds.), Membrane Bioreactors for Wastewater Treatment, IWA Publishing, London, United Kingdom, 2000. [13] A.K. Pabby, A.M. Sastre, S.S.H Rizvi, Handbook of Membrane Separation: Chemical,
Pharmaceutical, Food and Biotechnological Applications, CRC, USA, 2008. [14] G. Oron, L. Gillerman, N. Buriakovsky, A. Bick, M. Gargir, Y. Dolan, Y. Manor, L. Katz,
J. Hagin, Membrane technology for advanced wastewater reclamation for sustainable agriculture production, Desalination 218 (2008) 170–180. [15] A. Bick, G. Oron, L. Gillerman, Y. Manor, Data envelopment analysis for assessing
optimal operation of ultra-filtration systems for effluent polishing, Water Science & Technology: Water Supply 3 (5) (2003) 379–384.
[16] A. Bick, J.G. Plazas, G. Oron, Immersed Membrane Bioreactor (IMBR) for treatment of combined domestic and dairy wastewater in an isolated farm, Water Science and Technology 51 (10) (2005) 327–334.
[17] J.-J. Qin, K.A. Kekre, G. Tao, M.H. Oo, M.N. Wai, T.C. Lee, B. Vswanath, H. Seah, New option of MBR-RO process for production of NEWater from domestic sewage, Journal of Membrane Science 272 (2006) 70–77.
[18] J.-J. Qin, M.N. Wai, G. Tao, K.A. Kekre, H. Seah, Membrane bioreactor study for reclamation of mixed sewage mostly from industrial sources, Separation and Purification Technology 53 (2007) 296–300.
[19] P. Le-Clech, V. Chen, A.G. Fane, Fouling in membrane bioreactors used in wastewater treatment, Journal of Membrane Science 284 (2006) 17–53. [20] F. Yang, A. Bick, S. Shandalov, G. Oron, Optimal performance of an immersed
membrane bioreactor equipped with a draft tube for domestic wastewater reclamation, Water Sci. Technol. 54 (10) (2006) 155–162.
[21] J. Bersillon, M.A. Thompson, In situ evaluation and operation in: water treatment membrane processes, McGraw-Hill, Madrid, 1998.
[22] J.G. Jacangelo, J.M. Laine, E.W. Cummings, A. Deutschmanns, J. Mallevialle, M.R. Wiesner, Evaluation of ultrafiltration membrane pretreatment and nanofiltration of surface water, AWWARF, 1994, ISBN 0-89867-732-7.
[23] J. Bohdziewiczt, Removal of chromium ions (VI) from underground water in the hybrid complexation–ultrafiltration process, Desalination 129 (2000) 227–235. [24] I. Borg, S. Shye, Facet theory form and content, Sage, Thousand Oaks Ca, 1995. [25] A Cohen, The underlying structure of the Beck Depression Inventory II: a
multidimensional scaling approach, Journal of Research in Personality 42 (2008) 779–786.
[26] W. Bilsky, S.H. Schwartz, Measuring motivations: integrating content and method, Personality and Individual Differences 44 (2008) 1738–1751.
[27] N. Maslovaty, A. Cohen, S. Furman, The structural validity of the perceived traits of the“ideal student”multi-faceted theory among education students, Studies in Educational Evaluation 34 (2008) 165–172.
[28] E.H. Cohen, Symbols of Diaspora Jewish identity: an international survey and multi-dimensional analysis, Religion 38 (2008) 293–304.
[29] M. Sartor, M. Kaschek, V. Mavrov, Feasibility study for evaluating the client application of membrane bioreactor (MBR) technology for decentralized municipal wastewater treatment in Vietnam, Desalination 224 (2008) 172–177.
[30] Y. Wenbo, N. Cicek, J. Ilg, State-of-the-art of membrane bioreactors: worldwide research and commercial applications in North America, Journal of Membrane Science 270 (2006) 201–211.
[31] I. Alameddine, M. El-Fadel, Brine discharge from desalination plants: a modeling approach to an optimized outfall design, Desalination 214 (2007) 241–260. [32] L. Gillerman, A. Bick, N. Buriakovsky, G. Oron, Secondary wastewater polishing
with ultrafiltration membranes for unrestricted reuse: fouling and flushing modelling, Environmental Science and Technology 40 (2006) 6830–6836. [33] J.C. Chen, M. Elimelech, A.S. Kim, Monte Carlo simulation of colloidal membrane
filtration: model development with application to characterization of colloid phase transition, Journal of Membrane Science 255 (2005) 291–305.
[34] Y. Ye, V. Chen, A.G. Fane, Modeling long-term subcriticalfiltration of model EPS solutions, Desalination 191 (2006) 318–327.
[35] H. Al-Zoubi, N. Hilal, N.A. Darwish, A.W. Mohammad, Rejection and modelling of sulphate and potassium salts by nanofiltration membranes: neural network and Spiegler–Kedem model, Desalination 206 (2007) 42–60.
[36] H. Prummel, J.C. Schippers, Optimization of PACl dose to reduce RO cleaning in an IMS, Desalination 220 (2008) 239–251.
[37] S. Shye, D. Elizur, Introduction to facet theory, Sage, Newbury Park Ca, 1994. [38] J.B. Kruskal, Multidimentional scaling by optimizing goodness offit to a nonmetric
hypothesis, Psychometrika 29 (1964) 115–129.
[39] P.J.F. Groenen, The majorization approach to multidimensional scaling, DSWO Press, Leiden, Netherlands, 1994.
[40] S. Shye, Faceted smallest space analysis. a computer program for the PC Ver 3.01, 1991.
[41] Standard Methods for Examination of Water and Wastewater, American Public Health Associations (APHA)/American Water Works Association/Water Environ-mental Federation, Washington DC, USA19th Edt, 1995.
[42] C. Psoch, S. Schiewer, Long-term flux improvement by air sparging and backflushing for a membrane bioreactor, and modeling permeability decline, Desalination 230 (2008) 193–204.
[43] J. Lebegue, M. Heran, A. Grasmick, Membrane airflow rates and HF sludging phenomenon in SMBR, Desalination 236 (2009) 135–142.
[44] A. Zarragoitia-Gonzlez, S. Schetrite, M. Alliet, U. Juregui-Haza, C. Albasia, Modelling of submerged membrane bioreactor: conceptual study about link between activated sludge biokinetics, aeration and fouling process, Journal of Membrane Science 325 (2008) 612–624.
[45] Y. Mao-sheng, Z. Han-min, Y. Feng-lin, Experimental study on application of the boundary layer theory for estimating steady aeration intensity of precoated dynamic membrane bioreactors, Desalination 230 (2008) 100–112.
[46] I. Ivanovic, T. Leiknes, Impact of aeration rates on particle colloidal fraction in the biofilm membrane bioreactor (BF-MBR), Desalination 231 (2008) 182–190. [47] F. Meng, F. Yang, B. Shi, H. Zhang, A comprehensive study on membrane fouling in
submerged membrane bioreactors operated under different aeration intensities, Separation and Purification Technology 59 (2008) 91–100.
[48] E. Nguyen Cong Duc, L. Fournier, C. Levecq, B. Lesjean, P. Grelier, A. Tazi-Pain, Local hydrodynamic investigation of the aeration in a submerged hollow fibre membranes cassette, Journal of Membrane Science 321 (2008) 264–271. [49] T.W. Cheng, Z.W. Lee, Effects of aeration and inclination onflux performance of
submerged membranefiltration, Desalination 234 (2008) 74–80.
6 A. Bick et al. / Desalination xxx (2009) xxx–xxx