ESTIMATION OF POTENTIAL AND EFFECTIVE BRØNSTED ACID SITE
CONCENTRATIONS IN ACIDIC MORDENITES BY CONDUCTOMETRIC
TITRATION METHOD
M. A. Zanjanchi
*and M. Mohammadi
Department of Chemistry, Faculty of Science, University of Guilan, P. O. Box 1914, Rasht, Islamic Republic of Iran
Abstract
Quantitative determination of Brønsted acid sites in acidic mordenite samples
with varying proton concentrations has been studied using aqueous
conductometric titration method. Conductometric titration of the ammonium form
of mordenite with sodium hydroxide is feasible and the results indicate potential
number of Brønsted acid sites. However, Brønsted acid sites concentration in
acidic mordenites, measured by this method, is less than that evaluated by
ammonium-mordenite titration. Calcination procedure, to produce acidic
mordenites from its ammonium form, reduces Brønsted acid sites by
dealumination and dehydroxylation processes. In conductometric titration, only
accessible Brønsted acid sites are titrated and extra-framework aluminum species,
which are generated during calcination and reside in the structure, are not titrated.
This finding is supported by observing more reduction in the Brønsted acidity
when higher temperatures of calcination are employed. Also, comparing diffuse
reflectance spectra of the acidic mordenite before and after titration does not show
extra-framework aluminum species reacting with added base. A negative linear
correlation was observed between concentration of Brønsted acid sites measured
by conductometric titration and the temperature of calcination within 450-750°C.
*E-mail: [email protected]
Introduction
Solid acids have found a wide range of uses as catalysts for many important reactions [1-3]. Zeolites
Keywords: Conductometric titration; Ammonium mordenite; Brønsted acid sites; Acidic mordenite; Extra-framework aluminum; Diffuse reflectance spectroscopy
are the most widely used solid acid catalysts in industry and their characterization and specification is an
theoretically the number of Brønsted acid sites is equal to that of the framework aluminum. However more detailed studies have subsequently revealed that this appears to be an oversimplification and that other parameters have to be taken into account. It is now commonly accepted that the acid site concentration and strength are dependent on the structure and composition of the zeolites [5]. Furthermore, zeolites may contain Lewis acid sites as well [6,7]. They are in nature extra-framework aluminum species and are formed during treatment of zeolite to prepare protonic ones. The protonic acid sites in zeolites are generated in various ways. Two main procedures are thermal decomposition of ammonium exchanged zeolites and inorganic acid leaching of as-synthesized zeolites. During thermal treatment of ammonium exchanged zeolites, dehydroxylation is observed reducing concentration of potential Brønsted acid sites and producing Lewis acid sites [8].
To date, a variety of techniques including IR spectroscopy, UV-Visible spectroscopy, Hammett indicators, temperature programmed desorption of adsorbate molecules (like NH3 or pyridine),
microcalorimetry, solid state NMR and potentiometric titration in both aqueous and non-aqueous solvents have been used for characterizing zeolites acidity. The methods and the range of their application have been intensively reviewed [2,9,10]. Aqueous titration techniques using Hammett indicators have a large number of limitations, starting from the fact that diffusion of the indicators in the zeolite pores may be restricted [11]. The simple method of conductometric titration has been used for the first time by Crocker et al. to determine Brønsted acidity in high silica zeolites
[12]. They performed several experiments to assess the accuracy and applicability of conductometric titration in the measurement of Brønsted acidity in mordenite and ZSM-5 zeolites. They claimed that conductometric titration yields the sum of the concentration of Brønsted acid sites and extra-framework aluminum species (AlO+). They reached this conclusion on the basis that
during conductometric titration of acidic mordenite, octahedrally coordinated extra-framework aluminum observed in the 27Al MAS NMR spectrum of the
sample, disappears after titration.
In the present contribution, we will show that the method of conductometric titration can successfully be applied to evaluat potential amount of Brønsted acid sites in mordenite by titrating its ammonium form with a strong base. We will also show that concentration of Brønsted acid sites of acidic mordenites prepared in thermally different condition can be probed by conductometric titration. We use complementary technique of diffuse reflectance spectroscopy to study extra-framework aluminum species before and after the
titration, for interpretation of our conductometric data. We will show that extra-framework aluminum species are not titrated with added base and only accessible Brønsted acid sites are neutralized by sodium hydroxide.
Experimental Section
Sample Preparation
Mordenite was prepared by hydrothermal synthesis method described in the literature [13]. Sodium silicate solution (27% SiO2, 8% Na2O, 65% H2O, Merck) and
aluminum sulfate (Fluka, No. 6421) were used as sources of silicon and aluminum of the synthesis gel, respectively. Ammonium exchanged mordenite was prepared by treating as-synthesized mordenite with 1 M solution of NH4NO3 under reflux at 80°C for 5 h. The
solution was filtered and zeolite washed with deionized hot water several times and dried at 110°C. To transfer the ammonium form of mordenite into protonic form (acidic mordenite) samples were calcined separately at different temperatures ranging from 450 to 750°C. For every sample, calcination step was performed by heating the sample in a muffle furnace. The sample were heated at a rate of 10°C/min and held at the desired temperature for 7 h.
Characterization
The chemical composition of the as-synthesized sample was calculated from energy dispersive X-ray micro-analysis data. A Philips XL-30 scanning electron microscope equipped with an EDX spectrometer system and a computer based multichannel analyzer were used. Water content of the samples was determined by thermogravimetric method with a Polymer Laboratories TG1500 thermobalance. The crystalline phase identification was carried out using a Philips 1840 X-ray powder diffractometer with Cu Kα radiation. XRD patterns of the as-synthesized, ammonium-exchanged and acidic mordenite samples were recorded with an automatic divergence slit adjustment. Presence of extra-framework aluminum was studied by a diffuse reflectance spectrophotometer (DRS). A special cell loaded with the powder sample and covered by a quartz window was used in all experiments. Diffuse reflectance spectra were recorded by a UV-2100 Shimadzu spectrophotometer equipped with an integrating sphere assembly unit. All the spectra were recorded at room temperature against barium sulfate and plotted in terms of absorbance.
Titration
and standardized 0.1 N sodium hydroxide were added to a stirring suspension containing about 0.5 g (weighted with accuracy of 0.1 mg) of acidic sample in about 100 ml deionized water at two-minute intervals. The conductance of the mixture was measured immediately before each addition. Hydroxide addition was continued until the readings indicated that conductance is rising because of excess NaOH. Titration was stopped at a point far enough from equivalence point to get appropriate conductometric curve. All the conductance readings were corrected for the volume increase and the corrected conductances were plotted against the volume of added sodium hydroxide. End points were determined graphically by extrapolation of at least six experimental points on the straight lines after the rounded portion of the curves.
Results and Discussion
The EDX/SEM analysis revealed that composition of the as-synthesized mordenite on the unit cell basis is as follow:
Na7 H0.4 [(AlO2)7.4 (SiO2)40.6].23.7 H2O
The composition of the ammonium treated and the acidic samples in Si/Al atomic ratios is given in Table 1. The Si/Al ratio in NH4MOR was found to be the same
as the Si/Al ratio in the as-synthesized mordenite (i.e. NaMOR) which is obvious from the unit cell formula given above. But the EDX analyses of the acidic samples (HMOR-1 to HMOR-4) showed that the Si/Al ratios increased in these samples. Our studies to inspect this show that the dealumination process, which takes place during heat treatment, reduces the surface aluminum concentration and leaves non-framework aluminum species within the pores of the mordenite zeolites [14,15]. The EDX/SEM analysing system we used measures less aluminum on the surface and therefore a Si/Al increase is observed for the calcined samples.
Examining our XRD results of the as-synthesized, ammonium-exchanged and acidic mordenite samples showed all of them are structurally pure phase and of the type MOR [16]. The crystallinity of the samples upon ammonium treatment and calcination at 450-750°C are preserved and only small changes in the intensity of some reflections were observed.
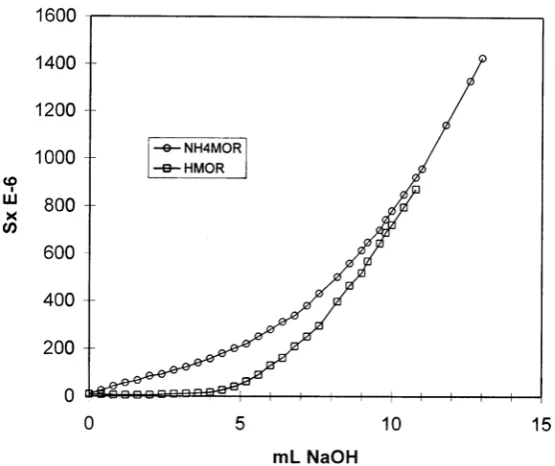
Conductometric titration curve of acidic mordenite (H-MOR) shows very little conductance values obtained before equivalence point. This indicate that H+ ions
inside mordenite do not possess significant macroscopic mobility, and hence, conductivity with respect to the suspension. Addition of NaOH to the mordenite suspension does not change the negligible conductance
before equivalence point because neutralization reaction proceeds as below:
H+Z–
(s) + Na+OH–(aq)→ H2O + Na+Z–(s)
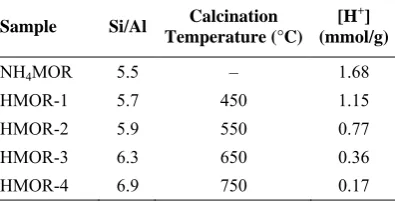
and no ionic species remains free in the suspension. Beyond the equivalence point, addition of excess NaOH will cause linear increase of conductance. Table 1 shows concentration of Brønsted acid sites (expressed in mmol H+/g) in the acidic samples. These acidic
mordenites are produced from calcination of ammoni-um-exchanged form of the zeolite at different tempera-tures. To evaluate maximum concentration of Brønsted acid sites based on a 1:1 ratio of H+/NH
4+ a
conduc-tometric titration of ammonium-exchanged mordenite (NH4MOR) was also performed. Titration curve in this
case was different from the acidic mordenites. In fact, in latter, addition of sodium hydroxide to the suspension of NH4MOR in water leads to a gradual increase in
conductance till equivalence point is reached. After the equivalence point, conductance will increase rapidly because of the excess hydroxide added. Pronounced hydrolysis in the vicinity of the equivalence point makes it necessary to select enough experimental points for construction of the two branches far away from the equivalence point. As a matter of fact before equivalence point addition of NaOH will lead to the substitution of NH4+ ions of mordenite for Na+
immediately after reaction of OH– with NH
4+ ion as
shown below:
NH4+Z–(s) + Na+OH–(aq)→ Na+Z–(s) + NH3(aq) + H2O
Hydrolysis of produced ammonia in water is the reason for the rise in conductance. In Figure 1 the two titration curves for ammonium-exchanged and acidic mordenites are compared.
It can be shown that reaction of a weak acid like NH4+ with sodium hydroxide as a strong base is
virtually complete. The equilibrium constant of the acid-base reaction can be calculated; the magnitude of this constant is an indication of the completeness of the reaction. The equilibrium constant for this type of reaction can be easily estimated from the following formula [17]:
K = 55.5 × ka / 1.1 × 10⁻¹⁴
where ka is the dissociation constant of the weak acid
(i.e. NH4+). Substitution of 5.70×10⁻¹⁰ for ka of NH4+
gives: K = 3.16×10⁶. The magnitude of this value shows
Figure 1. Conductometric titration curves for NH4MOR and HMOR-1
samples. Weight of NH4MOR and HMOR-1 samples were 0.4645 and 0.5418
g, respectively. Concentration of standardized NaOH used for the titration of NH4MOR and HMOR-1 were 0.1035 and 0.1027 N, respectively.
fraction of the NH4+ that reacts. If C is the initial
concentration of NH4+, we can simply write:
2 2
2 2
2
α) (1
α α) (1 C
) (C K
− = − α =
solving for α from above equation, we get:
K 1
K + = α
substituting the value for K = 3.16×10⁶, we get α = 0.9994. Hence the NH4+ and OH– are 99.9% reacted.
As can be observed from Table 1, concentration of Brønsted acid sites in all acidic mordenites is lower than the measured potentially available acidic sites taken from ammonium mordenite titration data. Still the measured acidity on ammonium-mordenite is in turn less than the theoretical maximum concentration of Brønsted acid sites in zeolite on the basis of one proton per one aluminum (2.14 mmol/g for our sample). In spite of this, interpretation of our results is straightforward. A number of reasons such as incomplete NH4+ ion exchange or weak or non-acidic
hydroxyl groups may be mentioned in order to explain the lower concentration of Brønsted sites, But the determinants of reduction of potential Brønsted acid sites, attainable from ammonium mordenite, are
dehydroxylation and/or dealumination processes taking place upon heating of ammonium-exchanged zeolites to produce acidic ones [15]. The aluminum expelled from the framework resides in the channels and cavities of mordenite in the form of oxyaluminum species and a potentially acidic site will be lost. Very low acidity of our HMOR-4 sample (Table 1) is therefore attributable to the high degree of dealumination and dehydroxylation occurring during calcination at a temperature as high as 750°C.
We used UV diffuse reflectance spectroscopy to evaluate possible changes in the structural state of aluminum atoms expelled from their tetrahedral sites in the framework hence altering its acidity. Such a method has been successful in acquiring some structural information about the state of aluminum in molecular sieves [18,19]. Figure 2 shows diffuse reflectance spectra of as-synthesized, ammonium-exchanged and acidic mordenite samples. The spectra of NaMOR and NH4MOR show only a single absorption band centered
octahedral, pentacoordinated and non-framework tetrahedral aluminum atoms exist. Broadening is more pronounced in sample HMOR-4 because the higher the calcination temperature of the ammonium mordenite, the greater the amount of aluminum leaving the framework.
Figure 2. Diffuse reflectance spectra of as-synthesized, ammonium-exchanged and acidic mordenite samples, a: NaMOR, b: NH4MOR, c: HMOR-1, d: HMOR-1, e: HMOR-3
and f: HMOR-4.
It is evident from the measured values of the acidity of HMOR samples, determined by conductometric titration, that extra-framework aluminum species generated by dealumination and dehydroxylation do not give rise to Brønsted acid sites in contrast with Crocker
et al. suggestion [12]. They stressed that during a
conductometric titration, extra-framework aluminum (considered by them as AlO+ cationic species) is titrated
along with acidic protons of the sample. They have noticed that during titration, octahedrally coordinated extra-framework aluminum species originally present in their H-mordenite sample and observable by 27AL MAS
NMR, are no longer detected by NMR after titration. However, in our opinion their NMR spectra contain another band placed on the shoulder of 55 ppm, located at about 30 ppm, which is more pronounced in their NMR spectra after the titration. This band (usually unobservable by conventional 27AL MAS NMR) has
often been assigned by the authors to either distorted tetrahedral or pentacoordinated extra-framework aluminum species which is produced upon thermal treatment of zeolites [15,20-22]. A further feature of the spectra is the broadening of the 55 ppm band. Although one might expect that broadening of this band occurs due to calcination-induced structural disorder, it is possible also that a portion of the intensity of the 55 ppm band has resulted from non-framework tetrahedral aluminum [22-24].
In fact thermal treatment will transform some of the framework aluminum atoms to extra-framework aluminum species which in turn through rehydration step (i.e. titration in aqueous medium) will change in their localization. Some of the aluminum species originally present in the large 12-ring channels of mordenite may lose their water upon thermal treatment and move to the side-pockets. The coordinated water decreases the strength of the specific Coulomb interaction with mordenite framework, which possesses a high symmetrical octahedral coordination so that a sharp NMR band might be observed [25,26]. This species may easily be removed or titrated [25,26]. As calcination temperature increases, more aluminum atoms are expelled from the framework to form aluminum species with lower symmetries such as four- and five-coordinated aluminum species. It is not possible to remove all of these extra-framework aluminum species from the structure even by employing strict conditions [25,26].
Table 1. The Si/Al ratio and Brønsted acid sites concentration in mordenite samples
Sample Si/Al Calcination Temperature (°C)
[H+] (mmol/g)
NH4MOR 5.5 – 1.68
HMOR-1 5.7 450 1.15
HMOR-2 5.9 550 0.77
HMOR-3 6.3 650 0.36
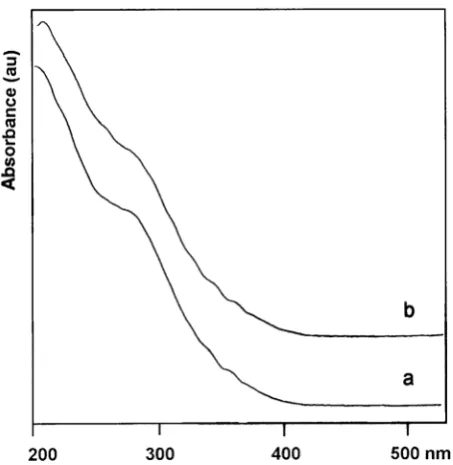
Figure 3. Diffuse reflectance spectra of acidic HMOR-2 sample before (a) and after (b) conductometric titration.
Figure 4. Correlation between concentration of Brønsted acid sites in acidic samples and calcination temperature of ammonium mordenite. Correlation coefficient = -0.98.
We have investigated the diffuse reflectance spectra of our acidic samples after conductometric titration to inspect any alteration in comparison with those of before titration. Figure 3 shows that we still get the absorption bands with the positions and the intensities almost similar to the previous ones (before titration). Therefore, we conclude that the majority of extra-framework aluminum species as described above are not titrated. The sample examined by Crocker et al.
contained 1.52 mmol/g aluminum with a Si/Al ratio of 10.4. One may expect that in a sample with such Si/Al
ratio and in a relatively low calcination temperature (500°C), only a little titrable aluminum species be produced. On the other hand, there is the report of Miller et al. to emphasize that in their
ammonium-mordenite (with Si/Al ratio of approximately the same as that of Crocker et al.), 20% of the aluminum atoms
were lost from the structure following calcination at 500°C, and non of them were acidic [15]. Because of this discrepancy, we carefully inspected the data of Miller et al. and found good accordance among our data
and those of them even though acidity measurement techniques were entirely different. Miller et al. have
used IR spectroscopy to measure Brønsted acidity of their mordenite samples by adsorbing pyridine on Brønsted sites and determining 1550 cm-1 band intensity. According to their results, concentration of Brønsted sites in the acidic mordenite produced from calcination of ammonium form at 735°C is 6 times less than the concentration of acid sites in the acidic sample produced from calcination of the ammonium form sample at 500°C. Our results taken from conductometric titration is in very good agreement with their data. In fact mean concentration of acid sites in our HMOR-1 and HMOR-2 samples is approximately 6 times the concentration of Brønsted sites in HMOR-4. This would be another proof that only accessible Brønsted acid sites are titrated by conductometric method.
We found a linear negative correlation between concentration of Brønsted acid sites and the temperature of calcination within the 450-750°C range (Fig. 4). The calculated correlation coefficient –0.989 shows the extent of linearity. This curve reflects the linear dependence of the total number of Brønsted acid sites on the framework aluminum atoms. As temperature of calcination increases, more aluminum atoms are expelled from their tetrahedral sites and the density (concentration) of acid sites is reduced. Linear dependence of the concentration of acid sites on the framework aluminum have also been observed by Stach and Janchen in dealuminated mordenites studied by calorimetric measurements [27].
Conclusion
calcination. As the temperature of calcination is increased, more dealumination occurs and therefore less titrable protons are produced. Added strong base reacts exclusively with Brønsted acid sites of mordenite and no extra-framework aluminum species in the structure is titrated. This was confirmed by observing less acidity in the samples calcined at higher temperature while their diffuse reflectance spectra before and after titration remains intact. A linear negative correlation is observed for Brønsted acidity expressed in mmol/g with respect to the temperature of calcination in the 450-750°C range.
Acknowledgements
The financial assistance from the Research Council of the University of Guilan is gratefully acknowledged. We also thank Dr. M. Mohammadian in the Faculty of Engineering for EDX analysis.
References 1. Corma, A. Chem. Rev., 95 : 559, (1995).
2. Farneth, W. E. and Gorte, R. J. Ibid., 95: 615, (1995). 3. Corma, A. Ibid., 97: 2373, (1997).
4. Zanjanchi, M. A., Vaghar-Lahijani, G. and Mohamma-dian, M. J. Sci. I. R. Iran, 9: 156, (1998).
5. Barthomeuf, D. Mat. Chem. Phys., 17: 49, (1987). 6. Zholobenko, V. L., Kustov, L. M., Kazansky, V. B.,
Lofter, E., Lohse, U. and Oehlmann, G. Zeolites, 11: 132, (1991).
7. Lago, R. M., Haag, W. O., Mikovsy, R. J., Olson, D. H., Hellring, S. D., Schmitt, K. D. and Kerr, G. T. Stud. Surf. Sci. Catal., 28: 677, (1986).
8. Barthomeuf, D. “Zeolites: Science and Technology” Eds.: Ribeiro, F. R., Rodrigues, A. E., Rollmann, L. D. and Naccache, C. NATO Adv. Sci. Ser. No. 80, p. 317, Martinus Nijhoff Pub. The Netherland, (1984).
9. Kijenski, J. and Baiker, A. Catal. Today, 5: 1, (1989). 10. Guisnet, M. R. Acc. Chem. Res., 23: 392, (1990).
11. Umansky, B., Engelhardt, J. and Hall, W. K. J. Catal., 127: 128, (1991).
12. Crocker, M., Herold, R. H. M., Sonnemans, M. H. W., Emeis, C. A., Wilson, A. E. and van der Moolen, J. N. J. Phys. Chem., 97: 432, (1993).
13. Shikh, A. A., Joshi, P. N., Jacob, N. E. and Shiralker, V. P. Zeolites, 13: 511, (1993).
14. Meyers, B. L., Fleisch, T. H., Ray, G. J., Miller, J. T. and Hall, J. B. J. Catal., 110: 82, (1988).
15. Miller, J. T., Hopkins, P. D., Meyers, B. L., Ray, G. J., Roginski, R. T., Zajac, G. W. and Rosenbaum, N. H. Ibid., 138: 115, (1992).
16. Treacy, M. M. J., Higgins, J. B. and Ballmoos, R. V. Collection of simulated XRD Powder patterns for zeolites, Zeolites, 16: 530, (1996).
17. Thompson, R. J. J. Chem. Edu., 67: 220, (1990).
18. Garbowski, D. and Mirodatos, C. J. Phys. Chem., 86: 97, (1982).
19. Zanjanchi, M. A. and Rashidi, M. K. Spectrochimica Acta, A, 55: 947, (1999).
20. Rocha, J. and Klinowski, J. J. Chem. Soc. Chem. Commun., 1121, (1991).
21. Harrey, G., Prins, R., Crockett, R. and Roduner, E. J. Chem. Soc. Faraday Trans., 92: 2027, (1996).
22. Samoson, A., Lippmaa, E., Engelhardt, G., Lohse, U. and Jerschkewitz, H. G. Chem. Phys. Lett., 134: 589, (1987). 23. Ray, G. J., Meyers, B. L. and Marshall, C. L. Zeolites, 7:
307, (1987).
24. Stach, H., Janchen, J., Jerschkewitz, H. G., Lohse, U., Parlitz, B. Zibrowins, B. and Hunger, M. J. Phys. Chem., 96: 8473, (1992).
25. Barras, J., Klinowski, J. and McComb, D. W. J. Chem. Soc. Faraday Trans., 90: 3719, (1994).
26. Goovaerts, F., Vansant, E. F., Philippaerts, J., Hulsters, P. D. and Gelan, J. Ibid., 1, 85: 3675, (1989).