V
N
.
1
(2011),
I
N
.
7
(D
)
ISSN
2231-5756
I
I
I
N
N
N
T
T
T
E
E
E
R
R
R
N
N
N
A
A
A
T
T
T
I
I
I
O
O
O
N
N
N
A
A
A
L
L
L
J
J
J
O
O
O
U
U
U
R
R
R
N
N
N
A
A
A
L
L
L
O
O
O
F
F
F
R
R
R
E
E
E
S
S
S
E
E
E
A
A
A
R
R
R
C
C
C
H
H
H
I
I
I
N
N
N
C
C
C
O
O
O
M
M
M
M
M
M
E
E
E
R
R
R
C
C
C
E
E
E
,
,
,
I
I
I
T
T
T
A
A
A
N
N
N
D
D
D
M
M
M
A
A
A
N
N
N
A
A
A
G
G
G
E
E
E
M
M
M
E
E
E
N
N
N
T
T
T
A Monthly Double-Blind Peer Reviewed Refereed Open Access International e-Journal - Included in the International Serial Directories
Indexed & Listed at: Ulrich's Periodicals Directory ©, ProQuest, U.S.A., Index Copernicus Publishers Panel, Poland, Open J-Gage, India
C
C
C
CONTENTS
ONTENTS
ONTENTS
ONTENTS
Sr.
No.
TITLE & NAME OF THE AUTHOR (S)
Page
No.
1
.
CONFLICT MANAGEMENT AND LEADERSHIP STYLE AS PREDICTORS OF ORGANISATIONAL LEARNING
ARUNA B. BHAT, DR. SANTOSH RANGNEKAR & DR. MUKESH BARUA
1
2
.
A STUDY ON TRAINING FACTORS AND ITS IMPACT ON TRAINING EFFECTIVENESS IN KEDAH STATE DEVELOPMENT CORPORATION, KEDAH,
MALAYSIA
DR. VIMALA SANJEEVKUMAR & HU YANAN
8
3
.
EDUCATIONAL HYPERMEDIA - IMPACTS ON TEACHING AND LEARNING PROCESSES
DR. SALAH ALKHAFAJI. & B.SRIRAM.
16
4
.
TECHNOLOGICAL ‘CATCHING UP’ IN BANGLADESH-EPZS: A PERFORMANCE APPRAISAL
DR. TAIMUR SHARIF & DR. JAMAL UDDIN AHMED
21
5
.
APPRAISING ICT RELEVANCE IN POLITICAL ADVERTISING
DR. CHINENYE NWABUEZE, RITA OKEKE & FESTINUS OKOYE
32
6
.
EFFECTIVE MAINTENANCE MANAGEMENT IN PETROCHEMICAL INDUSTRIES
N. K. K. PRASANNA & TUSHAR N. DESAI
36
7
.
IMPACT OF BUSINESS TYPES ON THE PROBLEMS FACED BY SHG WOMEN ENTREPRENEURS
DR. M. R. VANITHAMANI & DR. S. SANDHYA MENON
41
8
.
MORALE AND MOTIVATION OF PUBLIC SECTOR BANK EMPLOYEES (A CASE STUDY OF KURNOOL CITY IN A.P.)
DR. G. RAMA KRISHNA, P. BASAIAH, DR. A. HARI HARA NATH REDDY & K. VENU GOPAL RAO
45
9
.
HIDDEN MOTIVATORS OF TELECOM EMPLOYEES
DR. PRATIMA VERMA
50
10
.
MICROFINANCE IN INDIA
R. RAJENDRAKUMAR & DR. S. ASOKKUMAR
55
11
.
IDENTIFICATION OF IT GOVERNANCE PRACTICES & HUMAN RESOURCES IMPACTING BUSINESS - IT ALIGNMENT IN THE INDIAN IT CONTEXT
LAKSHMI VISHNU MURTHY TUNUGUNTLA & DR. MU.SUBRAHMANIAN
57
12
.
CONSUMER’S PERCEPTION AND PURCHASE INTENTIONS TOWARDS GREEN PRODUCTS
DASARI.PANDURANGARAO, SHAIK.CHAND BASHA & K.V.R.SATYAKUMAR
63
13
.
ROUGH SET THEORY IN ANALYSING THE CONSUMER AWARENESS ABOUT FACE WASH PRODUCTS IN CHENNAI CITY
C.R.SENTHILNATHAN
67
14
.
A STUDY ON BRAND PREFERENCE OF MOBILE PHONE CUSTOMERS WITH REFERENCE TO ERODE CITY
DR. P. KARTHIKEYAN
72
15
.
RELATIONSHIP BETWEEN WORKING CAPITAL AND PROFITABILITY: AN EMPIRICAL ANALYSIS
M. SUMAN KUMAR, S. MD. AZASH & N. VENKATA RAMANA
77
16
.
FEMALE WORKFORCE - A MISSING PILLAR OF HUMAN RESOURCE DEVELOPMENT IN THE GLOBALIZATION ERA
FIONA JEELANI, ZEENAZ ELIZABETH & DR. PARVEZ A. MIR
81
17
.
AN ANALYSIS ON IMPACT OF MOBILE PHONES ON INDIAN CONSUMER - A COMPARATIVE STUDY
SHEETAL SINGLA & DR. SANJIV BANSAL
86
18
.
‘SOFT SKILLS’- AN ESSENTIALITY IN TODAY’S BUSINESS ENGLISH
JAYATEE CHAKRABORTY
96
19
.
ROLE OF RFID TECHNOLOGY IN HOSPITALS
DR. L. KALYAN VISWANATH REDDY & RAMAIAH ITUMALLA
100
20
.
A COMPARATIVE STUDY OF CORPORATE GOVERNANCE DISCLOSURE PRACTICE OF ELECON AND GMM
JAIMIN H. TRIVEDI & DIVYANG V. BHRAMBHATT
106
21
.
A STUDY ON WORKING CAPITAL MANAGEMENT IN TAMILNADU SUGAR CORPORATION LIMITED (TASCO)
DR. P. KANAGARAJU
109
22
.
PERFORMANCE EVALUATION AND BARRIERS OF CRM PRACTICES IN HIGHER EDUCATION
DR. NARINDER TANWAR
113
23
.
SERVICE QUALITY GAP IN PRIVATE HOSPITALS
VANISHREE
119
24
.
MEASURING IMPACT OF TRAINING ON DEVELOPMENT: A STATISTICAL APPROACH
S. AMOLAK SINGH
122
25
.
IMPACT OF STRESS ON WORK-LIFE-BALANCE OF WOMEN EMPLOYEES WITH REFERENCE TO BPO AND EDUCATION SECTORS IN
BANGALORE
K. THRIVENI KUMARI
129
CHIEF PATRON
CHIEF PATRON
CHIEF PATRON
CHIEF PATRON
PROF. K. K. AGGARWAL
Chancellor, Lingaya’s University, Delhi
Founder Vice-Chancellor, Guru Gobind Singh Indraprastha University, Delhi
Ex. Pro Vice-Chancellor, Guru Jambheshwar University, Hisar
PATRON
PATRON
PATRON
PATRON
SH. RAM BHAJAN AGGARWAL
Ex. State Minister for Home & Tourism, Government of Haryana
Vice-President, Dadri Education Society, Charkhi Dadri
President, Chinar Syntex Ltd. (Textile Mills), Bhiwani
CO
CO
CO
CO----ORDINATOR
ORDINATOR
ORDINATOR
ORDINATOR
AMITA
Faculty, Government M. S., Mohali
ADVISORS
ADVISORS
ADVISORS
ADVISORS
DR. PRIYA RANJAN TRIVEDI
Chancellor, The Global Open University, Nagaland
PROF. M. S. SENAM RAJU
Director A. C. D., School of Management Studies, I.G.N.O.U., New Delhi
PROF. M. N. SHARMA
Chairman, M.B.A., Haryana College of Technology & Management, Kaithal
PROF. S. L. MAHANDRU
Principal (Retd.), Maharaja Agrasen College, Jagadhri
EDITOR
EDITOR
EDITOR
EDITOR
PROF. R. K. SHARMA
Professor, Bharti Vidyapeeth University Institute of Management & Research, New Delhi
CO
CO
CO
CO----EDITOR
EDITOR
EDITOR
EDITOR
DR. BHAVET
Faculty, M. M. Institute of Management, Maharishi Markandeshwar University, Mullana, Ambala, Haryana
EDITORIAL ADVISORY BOARD
EDITORIAL ADVISORY BOARD
EDITORIAL ADVISORY BOARD
EDITORIAL ADVISORY BOARD
DR. RAJESH MODI
Faculty, Yanbu Industrial College, Kingdom of Saudi Arabia
PROF. SANJIV MITTAL
University School of Management Studies, Guru Gobind Singh I. P. University, Delhi
PROF. ANIL K. SAINI
Chairperson (CRC), Guru Gobind Singh I. P. University, Delhi
DR. SAMBHAVNA
Faculty, I.I.T.M., Delhi
DR. MOHENDER KUMAR GUPTA
V
N
.
1
(2011),
I
N
.
7
(D
)
ISSN
2231-5756
DR. SHIVAKUMAR DEENE
Asst. Professor, Government F. G. College Chitguppa, Bidar, Karnataka
MOHITA
Faculty, Yamuna Institute of Engineering & Technology, Village Gadholi, P. O. Gadhola, Yamunanagar
ASSOCIATE EDITORS
ASSOCIATE EDITORS
ASSOCIATE EDITORS
ASSOCIATE EDITORS
PROF. NAWAB ALI KHAN
Department of Commerce, Aligarh Muslim University, Aligarh, U.P.
PROF. ABHAY BANSAL
Head, Department of Information Technology, Amity School of Engineering & Technology, Amity University, Noida
PROF. A. SURYANARAYANA
Department of Business Management, Osmania University, Hyderabad
DR. ASHOK KUMAR
Head, Department of Electronics, D. A. V. College (Lahore), Ambala City
DR. SAMBHAV GARG
Faculty, M. M. Institute of Management, Maharishi Markandeshwar University, Mullana, Ambala, Haryana
DR. V. SELVAM
Divisional Leader – Commerce SSL, VIT University, Vellore
DR. PARDEEP AHLAWAT
Reader, Institute of Management Studies & Research, Maharshi Dayanand University, Rohtak
S. TABASSUM SULTANA
Asst. Professor, Department of Business Management, Matrusri Institute of P.G. Studies, Hyderabad
SURJEET SINGH
Asst. Professor, Department of Computer Science, G. M. N. (P.G.) College, Ambala Cantt.
TECHNICAL ADVISOR
TECHNICAL ADVISOR
TECHNICAL ADVISOR
TECHNICAL ADVISOR
AMITA
Faculty, Government H. S., Mohali
MOHITA
Faculty, Yamuna Institute of Engineering & Technology, Village Gadholi, P. O. Gadhola, Yamunanagar
FINANCIAL ADVISORS
FINANCIAL ADVISORS
FINANCIAL ADVISORS
FINANCIAL ADVISORS
DICKIN GOYAL
Advocate & Tax Adviser, Panchkula
NEENA
Investment Consultant, Chambaghat, Solan, Himachal Pradesh
LEGAL ADVISORS
LEGAL ADVISORS
LEGAL ADVISORS
LEGAL ADVISORS
JITENDER S. CHAHAL
Advocate, Punjab & Haryana High Court, Chandigarh U.T.
CHANDER BHUSHAN SHARMA
Advocate & Consultant, District Courts, Yamunanagar at Jagadhri
SUPERINTENDENT
SUPERINTENDENT
SUPERINTENDENT
SUPERINTENDENT
CALL FOR MANUSCRIPTS
CALL FOR MANUSCRIPTS
CALL FOR MANUSCRIPTS
CALL FOR MANUSCRIPTS
We
invite unpublished novel, original, empirical and high quality research work pertaining to recent developments & practices in the area of
Computer, Business, Finance, Marketing, Human Resource Management, General Management, Banking, Insurance, Corporate Governance
and emerging paradigms in allied subjects like Accounting Education; Accounting Information Systems; Accounting Theory & Practice; Auditing;
Behavioral Accounting; Behavioral Economics; Corporate Finance; Cost Accounting; Econometrics; Economic Development; Economic History;
Financial Institutions & Markets; Financial Services; Fiscal Policy; Government & Non Profit Accounting; Industrial Organization; International
Economics & Trade; International Finance; Macro Economics; Micro Economics; Monetary Policy; Portfolio & Security Analysis; Public Policy
Economics; Real Estate; Regional Economics; Tax Accounting; Advertising & Promotion Management; Business Education; Business Information
Systems (MIS); Business Law, Public Responsibility & Ethics; Communication; Direct Marketing; E-Commerce; Global Business; Health Care
Administration; Labor Relations & Human Resource Management; Marketing Research; Marketing Theory & Applications; Non-Profit
Organizations; Office Administration/Management; Operations Research/Statistics; Organizational Behavior & Theory; Organizational
Development; Production/Operations; Public Administration; Purchasing/Materials Management; Retailing; Sales/Selling; Services; Small
Business Entrepreneurship; Strategic Management Policy; Technology/Innovation; Tourism, Hospitality & Leisure; Transportation/Physical
Distribution; Algorithms; Artificial Intelligence; Compilers & Translation; Computer Aided Design (CAD); Computer Aided Manufacturing;
Computer Graphics; Computer Organization & Architecture; Database Structures & Systems; Digital Logic; Discrete Structures; Internet;
Management Information Systems; Modeling & Simulation; Multimedia; Neural Systems/Neural Networks; Numerical Analysis/Scientific
Computing; Object Oriented Programming; Operating Systems; Programming Languages; Robotics; Symbolic & Formal Logic and Web Design.
The above mentioned tracks are only indicative, and not exhaustive.
Anybody can submit the soft copy of his/her manuscript
anytime
in M.S. Word format after preparing the same as per our submission
guidelines duly available on our website under the heading guidelines for submission, at the email addresses:
or
.
GUIDELINES FOR SUBMISSION OF MANUSCRIPT
GUIDELINES FOR SUBMISSION OF MANUSCRIPT
GUIDELINES FOR SUBMISSION OF MANUSCRIPT
GUIDELINES FOR SUBMISSION OF MANUSCRIPT
1. COVERING LETTER FOR SUBMISSION:
DATED: _____________
THE EDITOR
IJRCM
Subject:SUBMISSION OF MANUSCRIPT IN THE AREA OF . (e.g. Computer/IT/Engineering/Finance/Marketing/HRM/General Management/other, please specify).
DEAR SIR/MADAM
Please find my submission of manuscript titled ‘___________________________________________’ for possible publication in your journals.
I hereby affirm that the contents of this manuscript are original. Furthermore, it has neither been published elsewhere in any language fully or partly, nor is it under review for publication anywhere.
I affirm that all author (s) have seen and agreed to the submitted version of the manuscript and their inclusion of name (s) as co-author (s).
Also, if my/our manuscript is accepted, I/We agree to comply with the formalities as given on the website of journal & you are free to publish our contribution in any of your journals.
NAME OF CORRESPONDING AUTHOR:
Designation:
Affiliation with full address, contact numbers & Pin Code:
Residential address with Pin Code:
Mobile Number (s):
Landline Number (s):
E-mail Address:
Alternate E-mail Address:
2. MANUSCRIPT TITLE: The title of the paper should be in a 12 point Calibri Font. It should be bold typed, centered and fully capitalised.
3. AUTHOR NAME (S) & AFFILIATIONS: The author (s) full name, designation, affiliation (s), address, mobile/landline numbers, and email/alternate email address should be in italic & 11-point Calibri Font. It must be centered underneath the title.
V
N
.
1
(2011),
I
N
.
7
(D
)
ISSN
2231-5756
5. KEYWORDS: Abstract must be followed by list of keywords, subject to the maximum of five. These should be arranged in alphabetic order separated by commas and full stops at the end.
6. MANUSCRIPT: Manuscript must be in BRITISH ENGLISH prepared on a standard A4 size PORTRAIT SETTING PAPER. It must be prepared on a single space and single column with 1” margin set for top, bottom, left and right. It should be typed in 8 point Calibri Font with page numbers at the bottom and centre of the every page. It should be free from grammatical, spelling and punctuation errors and must be thoroughly edited.
7. HEADINGS: All the headings should be in a 10 point Calibri Font. These must be bold-faced, aligned left and fully capitalised. Leave a blank line before each heading.
8. SUB-HEADINGS: All the sub-headings should be in a 8 point Calibri Font. These must be bold-faced, aligned left and fully capitalised.
9. MAIN TEXT: The main text should follow the following sequence:
INTRODUCTION
REVIEW OF LITERATURE
NEED/IMPORTANCE OF THE STUDY
STATEMENT OF THE PROBLEM
OBJECTIVES
HYPOTHESES
RESEARCH METHODOLOGY
RESULTS & DISCUSSION
FINDINGS
RECOMMENDATIONS/SUGGESTIONS
CONCLUSIONS
SCOPE FOR FURTHER RESEARCH
ACKNOWLEDGMENTS
REFERENCES
APPENDIX/ANNEXURE
It should be in a 8 point Calibri Font, single spaced and justified. The manuscript should preferably not exceed 5000 words.
10. FIGURES &TABLES: These should be simple, centered, separately numbered & self explained, and titles must be above the table/figure. Sources of data should be mentioned below the table/figure. It should be ensured that the tables/figures are referred to from the main text.
11. EQUATIONS: These should be consecutively numbered in parentheses, horizontally centered with equation number placed at the right.
12. REFERENCES: The list of all references should be alphabetically arranged. The author (s) should mention only the actually utilised references in the preparation of manuscript and they are supposed to follow Harvard Style of Referencing. The author (s) are supposed to follow the references as per following:
•
All works cited in the text (including sources for tables and figures) should be listed alphabetically.•
Use (ed.) for one editor, and (ed.s) for multiple editors.•
When listing two or more works by one author, use --- (20xx), such as after Kohl (1997), use --- (2001), etc, in chronologically ascending order.•
Indicate (opening and closing) page numbers for articles in journals and for chapters in books.•
The title of books and journals should be in italics. Double quotation marks are used for titles of journal articles, book chapters, dissertations, reports, working papers, unpublished material, etc.•
For titles in a language other than English, provide an English translation in parentheses.•
The location of endnotes within the text should be indicated by superscript numbers.PLEASE USE THE FOLLOWING FOR STYLE AND PUNCTUATION IN REFERENCES: BOOKS
•
Bowersox, Donald J., Closs, David J., (1996), "Logistical Management." Tata McGraw, Hill, New Delhi.•
Hunker, H.L. and A.J. Wright (1963), "Factors of Industrial Location in Ohio," Ohio State University. CONTRIBUTIONS TO BOOKS•
Sharma T., Kwatra, G. (2008) Effectiveness of Social Advertising: A Study of Selected Campaigns, Corporate Social Responsibility, Edited by David Crowther & Nicholas Capaldi, Ashgate Research Companion to Corporate Social Responsibility, Chapter 15, pp 287-303.JOURNAL AND OTHER ARTICLES
•
Schemenner, R.W., Huber, J.C. and Cook, R.L. (1987), "Geographic Differences and the Location of New Manufacturing Facilities," Journal of Urban Economics, Vol. 21, No. 1, pp. 83-104.CONFERENCE PAPERS
•
Garg Sambhav (2011): "Business Ethics" Paper presented at the Annual International Conference for the All India Management Association, New Delhi, India, 19–22 June.UNPUBLISHED DISSERTATIONS AND THESES
•
Kumar S. (2011): "Customer Value: A Comparative Study of Rural and Urban Customers," Thesis, Kurukshetra University, Kurukshetra. ONLINE RESOURCES•
Always indicate the date that the source was accessed, as online resources are frequently updated or removed. WEBSITEAN ANALYSIS ON IMPACT OF MOBILE PHONES ON INDIAN CONSUMER - A COMPARATIVE STUDY
SHEETAL SINGLA
ASST. PROFESSOR
BHAI GURDAS INSTITUTE OF ENGINEERING & TECHNOLOGY
SANGRUR
DR. SANJIV BANSAL
ASSOCIATE PROFESSOR
SANT LONGOWAL INSTITUTE OF ENGINEERING & TECHNOLOGY
LONGOWAL
ABSTRACT
Mobile phones have the big impact on Indian Consumer. This paper empirically investigates the selection criteria of consumers for cellular phones. The samples
were collected from consumers of Ludhiana & Sangrur District on the demographic profile basis i.e. on the basis of age, gender, income, occupation, education
etc. Indian mobile market is one of the fastest growing markets and is forecasted to reach 868.47 million users by 2013.This paper investigates the important
attributes for a consumer & its selection criteria for mobiles that increases their usage. By using chi square tests, T Tests, F Tests, my study is able to obtain the
positive & negative impact on consumer mobile switching behavior. The availability of a number of subscriber options for consumers & varied tariff rates of each
player, this leads the consumers to switch between service providers. The objectives of the study are to find the factors that influence the consumers in switching
the service provider. The results include the reaction of consumers for mobiles when these are on silent/vibrating mode, missing phone at home means missing
something in life or not, along with the usage of mobiles while driving by Ludhiana & Sangrur Consumers.
KEYWORDS
Mobile Usage, Demographic Profile, Mobile Switching behavior.
INTRODUCTION
n today's increasingly competitive environment, quality services and customer satisfaction are the most critical factors in telecom industry. Mobile
telephone provides social interactions between and among people & organizations. In turn, the new demands of business have spurred many telecom
based technological innovations. According to Lee et al. (2001) the mobile providers should build up customer commitment by providing good quality
service to their customers. In the current marketplace, considerable attention has been paid to the concept of relationships between service providers and their
customers (Barnes, 1997; Gwinner et al., 1998; Reynolds and Arnold, 2000). Today’s development of communication technology ignores the global border and
makes the world as “global village” (McLuhan, 1964). The telecommunication sector is experiencing global change with the liberalization and privatization in the
economy. (Beard & Hartmann, 1999), which, in turn, widens a fierce competition. Telecom services have been recognized the world over as an important
element in the socio-economic development of a country. The cellular phone is a natural extension of the basic telephone service with an added advantage of
wireless technology coupled with ease of handling, usage, and mobility.
Consumer behavior is becoming more relevant than technology when it comes to
understanding future evolution in the mobile phone market. The Indian telecom sector, seen as providing the most affordable services in the world, has grown
by leaps and bounds in the last decade. This remarkable journey to 100 million consumers is a testament to the vision and commitment of a company that
benchmarks itself with the best in the world,'' Sunil Bharti Mittal, chairman and group chief executive officer of Bharti Enterprises said. (Times of India May
2009). This telecommunication sector contributed much to the nation’s economic growth and development, which is consistent with the national vision 2020.
Among the study on the potential consumers’ intentions to adopt mobile data services is from Hong and Tam’s (2006) study, which identified besides the
dominant factor, perceived usefulness, other factors such as perceived enjoyment, perceived monetary value and social influence have strong effects on
adoption intention. The effects of perceived services availability on perceived usefulness and perceived ease of use were also found to be significant. This paper
would extend the study by Hong and Tam (2006) and other past studies on the adoption of new technologies.
MOBILE PHONE USER SEGMENTATION
LITERATURE REVIEW
A study done by Heinonen & Strandvik (2003) showed that mobile channels are perceived to be more personal than traditional and e mail channels. This creates
high expectations for the relevance of marketing communication messages. A consumer expects messages to be personal and of high interest and this makes
the disappointment greater when they get undesired messages. Mobile advertising may even step over the line of discretion and invade consumers’ privacy
I
Consumer
Business
Trendy
Voice only Voice & Data
Intense Use
V
N
.
1
(2011),
I
N
.
7
(D
)
ISSN
2231-5756
because of the personal nature of the mobile device. Li et al (2002) discusses how negative reactions like irritation arise through intrusion advertising. The
channel influences consumer responsiveness to marketing communication by being perceived as either disturbing or acceptable (Abernethy 1991). If the
consumer considers marketing communication via a channel as disturbing it may negatively affect the attention to and perception of the message. In contrast,
the channel may also enhance the acceptance of the
marketing communication if it is perceived as appropriate for the specific marketing communication. Also, some consumers may perceive the channels as
neutral, i.e. it is neither disturbing nor accepted. Wang and Lo (2002) studied on comprehensive integrated framework for service quality, customer value, and
customer satisfaction and behavioral intentions of customers in China’s mobile phone sector. Customer perceptions of the quality of a service are traditionally
measured immediately after the person has consumed the service. In fact, a consumer’s perception of service quality at the time he or she next decides whether
or not to buy the service may better explain repeats buying behavior (Plamer & O’Neill, 2003). Crosby et al. (2003) examined how perceptions of quality were
created and maintained in the minds of consumers. The first thing the authors noted was that an understanding of quality was not necessarily something that
was perceived, let alone established, in the mind of the consumer upon the first impression. The usage of mobile services in India has penetrated to almost all
economic and social sectors. Penetration rate of mobile phones in India has reached a noteworthy level. According to the Department of Telecommunications of
India, there were 346.9 million wireless telephones in India as of December 2008. India's mobile subscriber base is expected to grow at a compound annual
growth rate (CAGR) of 18.3% from 2007 to 20133, reaching a penetration rate of 53.4% by the end of 2013. stream in the current literature addressing various
issues related to mobile communication (
m-communication
) and mobile commerce (
m-commerce
) Barnes and Corbitt,( 2003). Anand & Hundal, B .S. (2007)
stated examined the comparative buying behavior of rural & their urban counterparts towards the purchase of refrigerator. The factors considered by them,
item of necessity, symbol of social status, advertising influence, brand reputation & time saving device (Punjab). Abraham (2007), who also looked at Kerala
fishermen, found that the widespread use of mobile phones increased the efficiency of markets by decreasing risk and uncertainty, although it noted that
realizing potential efficiencies depended on easy access to capital. Using mobile phones at sea, fishermen are able to respond quickly to market demand and
prevent wastage from the catch – a common occurrence before the adoption of phones. Mobile phones help co-ordinate supply and demand, enabling traders
and transporters to take advantage of the free flow of price information by catering to demand in undersupplied markets. Bhatt (2008), stated in his study titled
“A Study of Mobile Phone Usage Among the Post Graduate Students” analyzed that it is important for mobile carriers, service providers, content developers,
equipment manufacturers, as well as for parents and young people alike that the key characteristics of mobile technology is well understood so that the risks
associated with it potentially damaging or disruptive aspects can be mitigated. This paper has tried to compare the usage difference by gender with respect to
the difference manufacturing and service provider companies. Bismut (2006) in his study titled “Competition in European Telecom Markets” analyzed that in
recent years the European telecommunications market has witnessed major developments, with rapid expansion in access to telecommunications networks and
a surge in the number of available services and applications. While many factors have contributed to the transformation of the telecommunications industry,
competition has played a key role in driving telecom players to invest in new technologies, to innovate and to offer new services.
Chris (2003)
has analyzed
‘Telecom advertising in print media.’ This research attempted to investigate why Telecom theme are used in advertisement, and the motives that lead
companies and advertisers to use sport celebrities and sport concept in advertisements. From study it has been revealed that the appearance of sport celebrities
in advertising endorsement occurred more often in Telecom magazines than in other magazines, because their target group is more acquainted with athletes.
The sport celebrities that dominated each printed media are related with their target group characteristics.
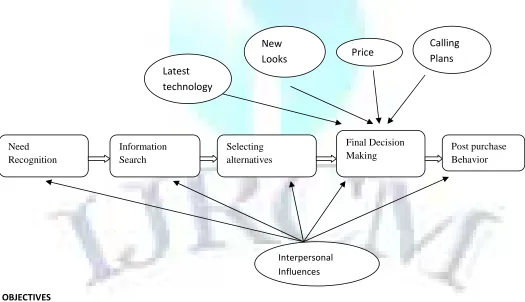
FIGURE 1: MOBILE PHONE PURCHASER DECISION-MAKING PROCESS AND MAJOR INFLUENCING FACTORS FOR USAGE OF MOBILES
OBJECTIVES
•
To gain an insight into the perception of consumers regarding mobile service providers.
•
To broadly identify the most impacting factors enhancing the acceptability/ utility of mobile users.
My study has taken sample size of 796 respondents in Ludhiana & Sangrur city. Out of whole demographic profiles, I have taken gender wise analysis in this
paper. So, for all the above mentioned objectives this paper categorized consumer with Male/Female category.
•
To gain an insight into the perception of consumers regarding mobile service providers.
Interpersonal
Influences
Need
Recognition
Information
Search
Selecting
alternatives
Final Decision
Making
Post purchase
Behavior
Latest
technology
New
Looks
Price
SERVICE PROVIDER YOU USE
--- |
AIRTEL | BSNL | VODAFONE | RELIANCE | TATA Ind. | Other | AIRTEL+ | Group/Sub Group | N % | N % | N % | N % | N % | N % | N % | ---|---|---|---|---|---|---|---| | | | | | | | | City | | | | | | | | 1.Ludhiana | 115 28.82 | 57 14.29 | 71 17.79 | 21 5.26 | 26 6.52 | 55 13.78 | 54 13.53 | 2.Sangrur | 137 34.60 | 42 10.61 | 72 18.18 | 20 5.05 | 15 3.79 | 49 12.37 | 61 15.40 |Chi^2=7.94(df:6)
| | | | | | | |C=0.10; Gender | | | | | | | | 1.Male | 192 33.51 | 71 12.39 | 94 16.40 | 28 4.89 | 28 4.89 | 77 13.44 | 83 14.49 | 2.Female | 60 27.03 | 28 12.61 | 49 22.07 | 13 5.86 | 13 5.86 | 27 12.16 | 32 14.41 |Chi^2=5.77(df:6)
| | | | | | | |C=0.08; Education Level | | | | | | | | 1.Primary | 28 26.17 | 15 14.02 | 15 14.02 | 6 5.61 | 5 4.67 | 16 14.95 | 22 20.56 | 2.Under Grad. | 71 35.15 | 20 9.90 | 33 16.34 | 10 4.95 | 9 4.46 | 27 13.37 | 32 15.84 | 3.Graduate | 85 33.20 | 31 12.11 | 47 18.36 | 14 5.47 | 14 5.47 | 33 12.89 | 32 12.50 | 4.Post Grad. | 68 29.57 | 33 14.35 | 48 20.87 | 11 4.78 | 13 5.65 | 28 12.17 | 29 12.61 |Chi^2=11.85(df:18)
| | | | | | | |C=0.12; Occupation | | | | | | | | 1.Service | 96 32.00 | 33 11.00 | 51 17.00 | 13 4.33 | 15 5.00 | 43 14.33 | 49 16.33 | 2.Business | 80 31.37 | 33 12.94 | 49 19.22 | 13 5.10 | 19 7.45 | 28 10.98 | 33 12.94 | 3.Student | 25 35.21 | 7 9.86 | 13 18.31 | 2 2.82 | 3 4.23 | 14 19.72 | 7 9.86 | 4.Other | 51 30.18 | 26 15.38 | 30 17.75 | 13 7.69 | 4 2.37 | 19 11.24 | 26 15.38 |Chi^2=17.77(df:18)
| | | | | | | |C=0.15; Income Level | | | | | | | | 1.Up to 10 Th. | 43 26.54 | 20 12.35 | 36 22.22 | 10 6.17 | 5 3.09 | 21 12.96 | 27 16.67 | 2. 10-25 | 95 34.17 | 37 13.31 | 46 16.55 | 11 3.96 | 11 3.96 | 41 14.75 | 37 13.31 | 3. 25-50 | 57 31.32 | 22 12.09 | 32 17.58 | 9 4.95 | 12 6.59 | 21 11.54 | 29 15.93 | 4.Above 50 | 57 32.95 | 20 11.56 | 29 16.76 | 11 6.36 | 13 7.51 | 21 12.14 | 22 12.72 |Chi^2=13.17(df:18)
| | | | | | | |C=0.13; | | | | | | | | All Data | 252 31.70 | 99 12.45 | 143 17.99 | 41 5.16 | 41 5.16 | 104 13.08 | 115 14.47 | ---
INTERPRETATION
Location and service providers are the 2 attributes. In this task, this table shows that no value of X
2is computable i.e. in case of location of customers reinterpret
that in LDH, people mostly prefer to use the service of AIRTEL with (28.82%) maximum value among all, then Vodafone with(17.79%) of value, then BSNL, Tata,
Reliance and others.
In SANGRUR also, first preference of service provider is AIRTEL, 2
ndis Vodafone and then comes to BSNL, Tata, Reliance. Here DF=6 X
2=7.94.
Gender wise, male mostly used services of AIRTEL with 34%, then Vodafone with 16.40% then others like BSNL, Tata etc. same is the case of females education
level wise, reinterpret from the table that primary class, under graduate, graduates, post graduates also used maximum services of AIRTEL, then Vodafone, then
others idea, then to BSNL, Tata etc.
Occupation wise, income level wise also we are able to understand from the table that mostly people prefer to use AIRTEL services, others Vodafone, idea, BSNL,
Tata and others etc.
Airtel
BSNL
Vodafone
Rel
TaTa
Others
Mix +
Male
33.51
12.39
16.4
4.89
4.89
13.44
14.49
Female
27.03
12.61
22.07
5.86
5.86
12.16
14.41
CHART 1.1.1 MALE PREFERENCES FOR SERVICE PROVIDERS
V
N
.
1
(2011),
I
N
.
7
(D
)
ISSN
2231-5756
INFERENCES
From the above charts it is understood that from the whole sample both males & females prefers first service provider as Airtel, 2nd preference is for
Vodafone,3
rdgoes to the number of mix means any service provider, then it is the turn of others, BSNL then Reliance& Tata are preferred same by both the
genders equally.
•
To broadly identify the most impacting factors enhancing the acceptability/ utility of mobile users.
Rate the importance: Price of mobile?
---
---| Summary | Least Imp. | Not Imp. | Average | Important | Most.Imp. | Group/Sub Group | WAS Avg SD CV | N % | N % | N % | N % | N % | ---|---|---|---|---|---|---| | | | | | | | City | | | | | | | 1.Ludhiana | 1.29 4.29 0.96 22.38 | 13 3.26 | 7 1.75 | 43 10.78 | 123 30.83 | 213 53.38 | 2.Sangrur | 1.31 4.31 0.95 22.04 | 10 2.53 | 14 3.54 | 36 9.09 | 121 30.56 | 215 54.29 |Chi^2=3.36(df:4)
| | | | | | |C=0.06; t=0.182(df:793)
Gender | | | | | | | 1.Male | 1.34 4.34 0.93 21.43 | 15 2.62 | 13 2.27 | 54 9.42 | 172 30.02 | 319 55.67 | 2.Female | 1.20 4.20 1.02 24.29 | 8 3.60 | 8 3.60 | 25 11.26 | 72 32.43 | 109 49.10 |Chi^2=3.75(df:4)
| | | | | | |C=0.07; t=1.789(df:793)
Education Level | | | | | | | 1.Primary | 1.31 4.31 0.95 22.04 | 2 1.87 | 3 2.80 | 16 14.95 | 25 23.36 | 61 57.01 | 2.Under Grad. | 1.27 4.27 1.03 24.12 | 8 3.96 | 7 3.47 | 18 8.91 | 59 29.21 | 110 54.46 | 3.Graduate | 1.30 4.30 0.96 22.33 | 9 3.52 | 5 1.95 | 22 8.59 | 84 32.81 | 136 53.12 | 4.Post Grad. | 1.32% 4.32 0.89 20.60 | 4 1.74 | 6 2.61 | 23 10.00 | 76 33.04 | 121 52.61 |Chi^2=10.07(df:12)
| | | | | | |C=0.11; F=0.12(df:3, 791)
Occupation | | | | | | | 1.Service | 1.30 4.30 0.99 23.02 | 10 3.33 | 10 3.33 | 25 8.33 | 90 30.00 | 165 55.00 | 2.Business | 1.28 4.28 0.90 21.03 | 7 2.75 | 1 0.39 | 32 12.55 | 88 34.51 | 127 49.80 | 3.Student | 1.30 4.30 1.04 24.19 | 3 4.23 | 3 4.23 | 4 5.63 | 21 29.58 | 40 56.34 | 4.Other | 1.33 4.33 0.95 21.94 | 3 1.78 | 7 4.14 | 18 10.65 | 45 26.63 | 96 56.80 |Chi^2=16.27(df:12)
| | | | | | |C=0.14; F=0.07(df:3, 791)
Income Level | | | | | | | 1.Up to 10 Th. | 1.38 4.38 0.90 20.55 | 4 2.47 | 1 0.62 | 19 11.73 | 43 26.54 | 95 58.64 | 2. 10-25 | 1.28 4.28 0.93 21.73 | 8 2.88 | 6 2.16 | 27 9.71 | 96 34.53 | 141 50.72 | 3. 25-50 | 1.25 4.25 1.06 24.94 | 8 4.40 | 7 3.85 | 16 8.79 | 51 28.02 | 100 54.95 | 4.Above 50 | 1.30 4.30 0.93 21.63 | 3 1.73 | 7 4.05 | 17 9.83 | 54 31.21 | 92 53.18 |Chi^2=12.09(df:12)
| | | | | | |C=0.12; F=0.59(df:3, 791)
| | | | | | | All Data | 1.30 4.30 0.96 22.33 | 23 2.89 | 21 2.64 | 79 9.94 | 244 30.69 | 428 53.84 |
---Least Imp.
Not Imp
Average
Imp
Most Imp.
Male
2.62
2.27
9.42
30.02
55.67
Female
3.6
3.6
11.26
32.43
49.1
CHART 2.1.1 FEMALE IMPORTANCE RATING CRITERIA FOR PRICE
CHART 2.1.2 MALE IMPORTANCE RATING CRITERIA FOR PRICE
Among the Males, 56% gives most important rating to the price of the mobile, 30% give only importance to the price feature in the mobile, 9% are average for
price feature, then 3% & 2% to the least important & not important.
So, from the male female category, it is clear that both gave more importance to price feature.
Rate the importance: Quality of mobile?
---
Summary | Least Imp. | Not Imp. | Average | Important |
Most.Imp. |Group/Sub Group | WAS Avg SD CV | N % | N % | N % | N % | N % | ---|---|---|---|---|---|---| | | | | | | | City | | | | | | | 1.Ludhiana | 1.40 4.40 0.83 18.86 | 5 1.25 | 8 2.01 | 35 8.77 | 125 31.33 | 226 56.64 | 2.Sangrur | 1.37 4.37 0.89 20.37 | 9 2.27 | 9 2.27 | 31 7.83 | 124 31.31 | 223 56.31 |Chi^2=1.46(df:4)
| | | | | | |C=0.04; t=0.487(df:793)
Gender | | | | | | | 1.Male | 1.38 4.38 0.89 20.32 | 11 1.92 | 14 2.44 | 52 9.08 | 167 29.14 | 329 57.42 | 2.Female | 1.41 4.41 0.78 17.69 | 3 1.35 | 3 1.35 | 14 6.31 | 82 36.94 | 120 54.05 |Chi^2=6.09(df:4)
| | | | | | |C=0.09; t=0.512(df:793)
Education Level | | | | | | | 1.Primary | 1.35 4.35 0.79 18.16 | 1 0.93 | 3 2.80 | 6 5.61 | 45 42.06 | 52 48.60 | 2.Under Grad. | 1.37 4.37 0.89 20.37 | 3 1.49 | 7 3.47 | 18 8.91 | 59 29.21 | 115 56.93 | 3.Graduate | 1.39 4.39 0.88 20.05 | 5 1.95 | 3 1.17 | 30 11.72 | 68 26.56 | 150 58.59 | 4.Post Grad. | 1.42 4.42 0.84 19.00 | 5 2.17 | 4 1.74 | 12 5.22 | 77 33.48 | 132 57.39 |Chi^2=19.05(df:12)
| | | | | | |C=0.15; F=0.24(df:3, 791)
Occupation | | | | | | | 1.Service | 1.42 4.42 0.86 19.46 | 6 2.00 | 7 2.33 | 17 5.67 | 95 31.67 | 175 58.33 | 2.Business | 1.40 4.40 0.83 18.86 | 3 1.18 | 5 1.96 | 24 9.41 | 79 30.98 | 144 56.47 | 3.Student | 1.14 4.14 0.98 23.67 | 2 2.82 | 3 4.23 | 9 12.68 | 26 36.62 | 31 43.66 | 4.Other | 1.41 4.41 0.85 19.27 | 3 1.78 | 2 1.18 | 16 9.47 | 49 28.99 | 99 58.58 |Chi^2=11.43(df:12)
| | | | | | |C=0.12; F=2.15(df:3, 791)
Income Level | | | | | | | 1.Up to 10 Th. | 1.33 4.33 0.94 21.71 | 4 2.47 | 6 3.70 | 12 7.41 | 51 31.48 | 89 54.94 | 2. 10-25 | 1.33 4.33 0.91 21.02 | 6 2.16 | 7 2.52 | 28 10.07 | 86 30.94 | 151 54.32 | 3. 25-50 | 1.46 4.46 0.76 17.04 | 2 1.10 | 2 1.10 | 12 6.59 | 61 33.52 | 105 57.69 | 4.Above 50 | 1.46 4.46 0.79 17.71 | 2 1.16 | 2 1.16 | 14 8.09 | 51 29.48 | 104 60.12 |Chi^2=8.35(df:12)
| | | | | | |C=0.10; F=1.54(df:3, 791)
| | | | | | | All Data | 1.39 4.39 0.86 19.59 | 14 1.76 | 17 2.14 | 66 8.30 | 249 31.32 | 449 56.48 |
---Least Imp.
Not Imp
Average
Imp
Most Imp.
Male
1.92
2.44
9.08
29.14
57.42
Female
1.35
1.35
6.31
36.94
54.05
V
N
.
1
(2011),
I
N
.
7
(D
)
ISSN
2231-5756
CHART 3.3.2 FEMALE IMPORTANCE RATING CRITERIA FOR QUALITY
It is clear from the above charts that both the males & females give importance to quality as 57% & 54 %.
Rate the importance: Style of mobile?
--- | Summary | Least Imp. | Not Imp. | Average | Important | Most.Imp. | Group/Sub Group | WAS Avg SD CV | N % | N % | N % | N % | N % | ---|---|---|---|---|---|---| | | | | | | | City | | | | | | | 1.Ludhiana | 0.95 3.95 1.13 28.61 | 20 5.01 | 25 6.27 | 69 17.29 | 126 31.58 | 159 39.85 | 2.Sangrur | 0.98 3.98 1.04 26.13 | 11 2.78 | 25 6.31 | 79 19.95 | 128 32.32 | 153 38.64 |Chi^2=3.41(df:4)
| | | | | | |C=0.07; t=0.356(df:793)
Gender | | | | | | | 1.Male | 0.97 3.97 1.08 27.20 | 23 4.01 | 32 5.58 | 107 18.67 | 189 32.98 | 222 38.74 | 2.Female | 0.95 3.95 1.11 28.10 | 8 3.60 | 18 8.11 | 41 18.47 | 65 29.28 | 90 40.54 |Chi^2=2.51(df:4)
| | | | | | |C=0.06; t=0.208(df:793)
Education Level | | | | | | | 1.Primary | 0.92 3.92 1.02 26.02 | 3 2.80 | 5 4.67 | 28 26.17 | 33 30.84 | 38 35.51 | 2.Under Grad. | 0.96 3.96 1.14 28.79 | 12 5.94 | 9 4.46 | 37 18.32 | 62 30.69 | 82 40.59 | 3.Graduate | 0.92 3.92 1.13 28.83 | 11 4.30 | 23 8.98 | 39 15.23 | 85 33.20 | 98 38.28 | 4.Post Grad. | 1.04 4.04 1.01 25.00 | 5 2.17 | 13 5.65 | 44 19.13 | 74 32.17 | 94 40.87 |Chi^2=14.83(df:12)
| | | | | | |C=0.14; F=0.57(df:3, 791)
Occupation | | | | | | | 1.Service | 0.97 3.97 1.09 27.46 | 11 3.67 | 19 6.33 | 58 19.33 | 91 30.33 | 121 40.33 | 2.Business | 0.95 3.95 1.08 27.34 | 8 3.14 | 20 7.84 | 47 18.43 | 83 32.55 | 97 38.04 | 3.Student | 0.89 3.89 1.13 29.05 | 5 7.04 | 2 2.82 | 14 19.72 | 25 35.21 | 25 35.21 | 4.Other | 1.01 4.01 1.08 26.93 | 7 4.14 | 9 5.33 | 29 17.16 | 55 32.54 | 69 40.83 |Chi^2=6.28(df:12)
| | | | | | |C=0.09; F=0.23(df:3, 791)
Income Level | | | | | | | 1.Up to 10 Th. | 0.78 3.78 1.20 31.75 | 11 6.79 | 12 7.41 | 35 21.60 | 47 29.01 | 57 35.19 | 2. 10-25 | 1.05 4.05 1.03 25.43 | 8 2.88 | 16 5.76 | 44 15.83 | 96 34.53 | 114 41.01 | 3. 25-50 | 1.04 4.04 1.03 25.50 | 4 2.20 | 13 7.14 | 29 15.93 | 61 33.52 | 75 41.21 | 4.Above 50 | 0.91 3.91 1.11 28.39 | 8 4.62 | 9 5.20 | 40 23.12 | 50 28.90 | 66 38.15 |Chi^2=14.11(df:12)
| | | | | | |C=0.13; F=2.57(df:3, 791)
| | | | | | | All Data | 0.96 3.96 1.09 27.53 | 31 3.90 | 50 6.29 | 148 18.62 | 254 31.95 | 312 39.25 |
Least Imp.
Not Imp
Average
Imp
Most Imp.
Male
1.92
2.44
9.08
29.14
57.42
Female
1.35
1.35
6.31
36.94
54.05
CHART 4.4.2 FEMALE IMPORTANCE RATING CRITERIA FOR STYLE
Rate the importance: Features of mobile?
---
---| Summary | Least Imp. | Not Imp. | Average | Important | Most.Imp. | Group/Sub Group | WAS Avg SD CV | N % | N % | N % | N % | N % | ---|---|---|---|---|---|---| | | | | | | | City | | | | | | | 1.Ludhiana | 1.11 4.11 1.13 27.49 | 12 3.01 | 37 9.27 | 52 13.03 | 93 23.31 | 205 51.38 | 2.Sangrur | 1.18 4.18 1.08 25.84 | 11 2.78 | 29 7.32 | 48 12.12 | 96 24.24 | 212 53.54 |Chi^2=1.33(df:4)
| | | | | | |C=0.04; t=0.978(df:793)
Gender | | | | | | | 1.Male | 1.11 4.11 1.11 27.01 | 17 2.97 | 48 8.38 | 80 13.96 | 138 24.08 | 290 50.61 | 2.Female | 1.24 4.24 1.08 25.47 | 6 2.70 | 18 8.11 | 20 9.01 | 51 22.97 | 127 57.21 |Chi^2=4.58(df:4)
| | | | | | |C=0.08; t=1.493(df:793)
Education Level | | | | | | | 1.Primary | 0.97 3.97 1.11 27.96 | 3 2.80 | 11 10.28 | 17 15.89 | 31 28.97 | 45 42.06 | 2.Under Grad. | 1.09 4.09 1.17 28.61 | 8 3.96 | 20 9.90 | 23 11.39 | 46 22.77 | 105 51.98 | 3.Graduate | 1.20 4.20 1.04 24.76 | 6 2.34 | 15 5.86 | 37 14.45 | 61 23.83 | 137 53.52 | 4.Post Grad. | 1.21 4.21 1.10 26.13 | 6 2.61 | 20 8.70 | 23 10.00 | 51 22.17 | 130 56.52 |Chi^2=11.77(df:12)
| | | | | | |C=0.12; F=1.57(df:3, 791)
Occupation | | | | | | | 1.Service | 1.16 4.16 1.10 26.44 | 9 3.00 | 22 7.33 | 40 13.33 | 69 23.00 | 160 53.33 | 2.Business | 1.13 4.13 1.14 27.60 | 11 4.31 | 20 7.84 | 25 9.80 | 67 26.27 | 132 51.76 | 3.Student | 0.99 3.99 1.19 29.82 | 2 2.82 | 8 11.27 | 15 21.13 | 10 14.08 | 36 50.70 | 4.Other | 1.20 4.20 1.02 24.29 | 1 0.59 | 16 9.47 | 20 11.83 | 43 25.44 | 89 52.66 |Chi^2=16.07(df:12)
| | | | | | |C=0.14; F=0.67(df:3, 791)
Income Level | | | | | | | 1.Up to 10 Th. | 0.96 3.96 1.22 30.81 | 5 3.09 | 24 14.81 | 22 13.58 | 32 19.75 | 79 48.77 | 2. 10-25 | 1.20 4.20 1.04 24.76 | 5 1.80 | 21 7.55 | 36 12.95 | 68 24.46 | 148 53.24 | 3. 25-50 | 1.20 4.20 1.02 24.29 | 5 2.75 | 9 4.95 | 23 12.64 | 52 28.57 | 93 51.10 | 4.Above 50 | 1.17 4.17 1.16 27.82 | 8 4.62 | 12 6.94 | 19 10.98 | 37 21.39 | 97 56.07 |Chi^2=19.09(df:12)
| | | | | | |C=0.15; F=1.89(df:3, 791)
| | | | | | | All Data | 1.15 4.15 1.11 26.75 | 23 2.89 | 66 8.30 | 100 12.58 | 189 23.77 | 417 52.45 | ---
Least Imp.
Not Imp
Average
Imp
Most Imp.
Male
2.97
8.38
13.96
24.08
50.61
Female
2.7
8.11
9.01
22.97
57.21
V
N
.
1
(2011),
I
N
.
7
(D
)
ISSN
2231-5756
CHART 5.5.2 FEMALE IMPORTANCE RATING CRITERIA FOR MOBILE FEATURES
Rate the importance: Brand of mobile?
---
| Summary | Least Imp. | Not Imp. | Average | Important | Most.Imp. | Group/Sub Group | WAS Avg SD CV | N % | N % | N % | N % | N % | ---|---|---|---|---|---|---| | | | | | | | City | | | | | | | 1.Ludhiana | 0.98 3.98 1.21 30.40 | 34 8.52 | 13 3.26 | 52 13.03 | 126 31.58 | 174 43.61 | 2.Sangrur | 1.02 4.02 1.26 31.34 | 37 9.34 | 15 3.79 | 42 10.61 | 111 28.03 | 191 48.23 |Chi^2=3.06(df:4)
| | | | | | |C=0.06; t=0.403(df:793)
Gender | | | | | | | 1.Male | 1.02 4.02 1.22 30.35 | 49 8.55 | 22 3.84 | 63 10.99 | 174 30.37 | 265 46.25 | 2.Female | 0.96 3.96 1.26 31.82 | 22 9.91 | 6 2.70 | 31 13.96 | 63 28.38 | 100 45.05 |Chi^2=2.37(df:4)
| | | | | | |C=0.05; t=0.605(df:793)
Education Level | | | | | | | 1.Primary | 0.79 3.79 1.36 35.88 | 15 14.02 | 4 3.74 | 10 9.35 | 37 34.58 | 41 38.32 | 2.Under Grad. | 1.12 4.12 1.14 27.67 | 14 6.93 | 3 1.49 | 27 13.37 | 59 29.21 | 99 49.01 | 3.Graduate | 1.06 4.06 1.22 30.05 | 22 8.59 | 7 2.73 | 29 11.33 | 74 28.91 | 124 48.44 | 4.Post Grad. | 0.93 3.93 1.26 32.06 | 20 8.70 | 14 6.09 | 28 12.17 | 67 29.13 | 101 43.91 |Chi^2=15.50(df:12)
| | | | | | |C=0.14; F=2.03(df:3, 791)
Occupation | | | | | | | 1.Service | 0.98 3.98 1.26 31.66 | 29 9.67 | 12 4.00 | 33 11.00 | 89 29.67 | 137 45.67 | 2.Business | 1.04 4.04 1.21 29.95 | 23 9.02 | 4 1.57 | 30 11.76 | 80 31.37 | 118 46.27 | 3.Student | 0.99 3.99 1.27 31.83 | 6 8.45 | 4 5.63 | 10 14.08 | 16 22.54 | 35 49.30 | 4.Other | 0.99 3.99 1.20 30.08 | 13 7.69 | 8 4.73 | 21 12.43 | 52 30.77 | 75 44.38 |Chi^2=7.38(df:12)
| | | | | | |C=0.10; F=0.14(df:3, 791)
Income Level | | | | | | | 1.Up to 10 Th. | 0.80 3.80 1.35 35.53 | 22 13.58 | 6 3.70 | 17 10.49 | 54 33.33 | 63 38.89 | 2. 10-25 | 1.12 4.12 1.18 28.64 | 19 6.83 | 12 4.32 | 29 10.43 | 76 27.34 | 142 51.08 | 3. 25-50 | 1.08 4.08 1.17 28.68 | 15 8.24 | 4 2.20 | 17 9.34 | 62 34.07 | 84 46.15 | 4.Above 50 | 0.93 3.93 1.24 31.55 | 15 8.67 | 6 3.47 | 31 17.92 | 45 26.01 | 76 43.93 |Chi^2=20.60(df:12)
| | | | | | |C=0.16; F=2.62*(df:3, 791)
| | | | | | | All Data | 1.00 4.00 1.23 30.75 | 71 8.93 | 28 3.52 | 94 11.82 | 237 29.81 | 365 45.91 |
Least Imp.
Not Imp
Average
Imp
Most Imp.
Male
8.55
3.84
10.99
30.37
46.25
Female
9.91
2.7
13.96
28.38
45.05
CHART 6.6.2 FEMALE IMPORTANCE RATING CRITERIA FOR BRAND OF MOBILE
It is understood from the above charts of importance rating scales that mostly male prefers quality as no. 1 acceptable feature in handset with 57.42% & Female
prefers new changes in the features of the mobile handsets as no. 1 with 57.21%. Females gives 54.05% weight age to the quality of hand set & Male gives
50.61% weightage to the features of the mobile handsets..Then it comes to the turn of price for the males with 55.67% & Females are least bothered with price
as they give only 49% weight age to the price feature. Consideration to the Brand of the mobile is given equally by both with 46% &45% by Males & Females
both. Least important feature in mobile handset is its Style.
FACILITIES YOU ARE LOOKING FOR IN THE MOBILE SET
| Mem.Card |Waist pouch | Bluetooth | Ear phones | All/Many |
Group/Sub Group | N % | N % | N % | N % | N % |
---|---|---|---|---|---|
| | | | | |
City | | | | | |
1.Ludhiana | 86 21.55 | 78 19.55 | 49 12.28 | 128 32.08 | 58 14.54 |
2.Sangrur | 96 24.24 | 77 19.44 | 48 12.12 | 118 29.80 | 57 14.39 |Chi^2=0.97(df:4)
| | | | | |C=0.03;
Gender | | | | | |
1.Male | 133 23.21 | 117 20.42 | 72 12.57 | 181 31.59 | 70 12.22 |
2.Female | 49 22.07 | 38 17.12 | 25 11.26 | 65 29.28 | 45 20.27 |Chi^2=8.66(df:4)
| | | | | |C=0.10;
Education Level | | | | | |
1.Primary | 27 25.23 | 23 21.50 | 11 10.28 | 32 29.91 | 14 13.08 |
2.Under Grad. | 50 24.75 | 32 15.84 | 19 9.41 | 66 32.67 | 35 17.33 |
3.Graduate | 54 21.09 | 50 19.53 | 43 16.80 | 77 30.08 | 32 12.50 |
4.Post Grad. | 51 22.17 | 50 21.74 | 24 10.43 | 71 30.87 | 34 14.78 |Chi^2=12.09(df:12)
| | | | | |C=0.12;
Occupation | | | | | |
1.Service | 66 22.00 | 71 23.67 | 29 9.67 | 92 30.67 | 42 14.00 |
2.Business | 64 25.10 | 44 17.25 | 33 12.94 | 79 30.98 | 35 13.73 |
3.Student | 11 15.49 | 10 14.08 | 12 16.90 | 22 30.99 | 16 22.54 |
4.Other | 41 24.26 | 30 17.75 | 23 13.61 | 53 31.36 | 22 13.02 |Chi^2=14.00(df:12)
| | | | | |C=0.13;
Income Level | | | | | |
1.Up to 10 Th. | 39 24.07 | 31 19.14 | 17 10.49 | 51 31.48 | 24 14.81 |
2. 10-25 | 55 19.78 | 54 19.42 | 39 14.03 | 82 29.50 | 48 17.27 |
3. 25-50 | 50 27.47 | 33 18.13 | 19 10.44 | 61 33.52 | 19 10.44 |
4.Above 50 | 38 21.97 | 37 21.39 | 22 12.72 | 52 30.06 | 24 13.87 |Chi^2=9.39(df:12)
| | | | | |C=0.11;
| | | | | |
All Data | 182 22.89 | 155 19.50 | 97 12.20 | 246 30.94 | 115 14.47 |
---
Gender
M. card
Waist Pouch
Bluetooth
Ear ph
All/Many
Male
23.21
20.42
12.57
31.59
12.22
Female
22.07
17.12
11.26
29.28
20.27
V
N
.
1
(2011),
I
N
.
7
(D
)
ISSN
2231-5756
As in the above diagram it is clear that mostly Females like Ear phones more in the sets with 29.28%, memory cards with 23.21%, 3
rdthey need mixed features
with 20.27%, and then comes to the turn of Waist pouch & Bluetooth with 17.12% & 11.26%.
SUMMARY OF THE FINDINGS
•
Indian mobile telephony may be called as “the sun-rise industry” of the Indian economy because of outstanding performance on various parameters.
•
Rate of growth in mobile subscriber base has been substantially higher than growth in population, indicating a rapid proliferation of mobile telephone and
adoption by non-users/first-time users.
•
Lower prices has been witnessed across many industries & competition helped in lowering the prices.
•
The deregulation in telecom industry gave birth to the greatest innovation period in the past 20 years. New technologies, standards, data services, new
devices, CRM solutions and creative bundling have all been the result of competition in telecom industry.
•
Telecom industry is services industry, hence the good quality services to the customer and the customer relationship management is the key and
competition has totally changed the definition of service in Indian telecom industry. The quality of service has improved by leaps and bounds.
•
Today, private players contribute to 64% of the total telecom network of the country, with a major contribution in the cellular segment. Out of the 62
million phones provided in the country for the period 2005-06, 50 million phones provided by private players alone.
CONCLUSION
Mobile phones are especially powerful tools. As a result of the liberalization, privatization, and de-monopolization initiatives taken by the government of India,
the telecom sector is experiencing a historical growth. The trend is expected to continue in the segment, as prices are falling as a result of competition in the
segment. The beneficiaries of the competition are the consumers, who are given a wide variety of services. The future commitment of the customers to
organization depends on perceived trust. The issue of trust is therefore increasingly recognized as a critical success factor in the emerging scenario. Mobile
phones offer greater income from higher value to customers. Improved quality through better monitoring and staff retention. This study also attempts to
broadly concretize some features or attributes, which will enhances the overall acceptance and utility of mobile marketing and advertising. Hence the mobile
users are apparently seeking customization of mobile marketing messages as per their individual requirements, tastes and preferences. Thus the marketing firms
need to combine Mass Customization and Customized marketing i.e. CUSTOMERIZATION
REFERENCES
•
Abernethy, A.M. (1991) ‘Physical and mechanical avoidance of television commercials: an exploratory study of zipping, zapping and leaving’, in Holman, R.
(Ed.): Proceedings of the American Academy of Advertising,
The American Academy of Advertising
, New York, pp.223–231.
•
Aaker JL (1999). “The Malleable Self: The Role of Self-Expression in Persuasion”, J. Mark. Res., 36(1): 45–58.
•
Anderson, R.E. (1973), „Consumer Dissatisfaction: The Effect of Disconfirmed Expectancy on Perceived Product Performance, ‟
Journal of Marketing
Research
, 10(1): 38-44
•
Anand & Hundal, B .S. (2007) Motivators for the purchase of consumer for rural & urban consumers of Punjab: A Case Study.
The ICFAI journal of
Management Research.7.
•
Aker, J. C. (2008), “Does Digital Divide or Provide? The Impact of Cell Phones on Grain Markets in Niger”, Working Paper Number 154, Centre for Global
Development, Washington, USA, October 2008. http://www.cgdev.org/ content/publications/detail/894410/
•
Abraham, Reuben (2007), “Mobile Phones and Economic Development: Evidence from the Fishing Industry in India”,
Information Technology and
International Development,
MIT Press, Volume 4, Number 1, Fall 2007, Pp 5–17.
•
Bhatt M.V. (April 2008), “A Study of Mobile Phone Usage Among the Post Graduate Students
”. Indian Journal of Marketing
. Vol.XXXVIII No.413-17.
•
Bismut (2006) online at http://mpra.ub.uni-muenchen.de/3567/ MPRA Paper No. 3567, posted 07, November 2010.
•
Chris, Kambitsis, “
Telecom advertising in print media
”, 2003.
•
Crosby, L. B., De Vito, R., & Pearson, J. M. (2003). Manage your customers’ perception of quality.
Review of Business, 24,
18-38.
•
Economy Bureau, “Every 12th Indian has a Phone”,
Business Standard,
Feb. 9, 2005, pg. 3.
•
Feick, L., Lee, J. and Lee, J. (2001), “The impact of switching costs on the Consumer Satisfaction-loyalty link: mobile phone service in France”,
Journal of
Services Marketing,
Vol. 15 No. 1, pp. 35-48.
•
Heinonen, Kristina & Strandvik, Tore (2003): Consumer responsiveness to marketing communication in digital channels, FeBR2002 Frontiers of e-Business
Research 2002,ed. M. Hannula, A-M. Järvelin & M. Seppä, pp. 137-152, Tampere University of Technology and University of Tampere
•
Hong SJ, Tam KY (2006). Understanding the adoption of multipurpose information appliances: the case of mobile data services. Information Systems
Research.
•
Hong SJ, Thong JYL, Moon JY, Tam KY (2008). Understanding the behavior of mobile data services consumers. Info. Syst. Front. 10: 431-445.
•
Joo, Young-Hyuck, jong-Jun Jun, and Byung-Do Kim(2002), “Encouraging consumers to pay less for mobile telecommunication services,”
Journal of
Database Far East Journal of Psychology and Business
Vol. 2 No 2, February 2011 81
•
Kaeveney, Susan M. (1995), “Consumer Switching Behavior in service Industries: An Exploratory study,”
Journal of Marketing
, Vol. 59, 71-82.
•
Lee J, Lee J, Feick F (2001). “The impact of the switching costs on the customer satisfaction-loyalty link: mobile phone service in France”. MCB University
Press. J. Serv. Mark., 15(1): 35-48.
•
Li, Hairong, Steven M. Edwards and Joo-Hyun Lee 2002. Measuring the Intrusiveness of Advertisements: Scale Development and Validation.
Journal of
Advertising
, Vol. XXXI, No.2, 37-47
•
Mittal, B., and Lassar, W. M., 1998. Why do customers switch? The dynamics of satisfaction versus loyalty.
The Journal of Services Marketing
12 (3),
177-194.
•
Plamer, A., & O’Neill, M. (2003). The effects of perceptual processes on the measurement of service quality.
Journal of Services Marketing, 17(
3), 254-274.
•
Office of Communications, “Media and Analyze”, Retrieved June 5, 2008 from http://www.ofcom.org.uk/media/news/2007/04/nr_20070403 Page, C.
(2005), Mobile research strategies for a global market, Communication of the ACM, 48(7), pp42-48.
•
Richardson R.M. and Smith S.W. (2007), “The influence of high/low – context culture and power distance on choice of communication media: students’
media choice to communicate with professors in Japan and American,
International Journal of Intercultural Relations
31, pp479-501.
•
Roos, I., Edvardsson, B., and Gusrafsson, A. (2004), „Customer Switching Patterns in Competitive and Non-competitive Service Industries,‟
Journal of
Service Research
, 6(3):256-271
•
Rust, R.T. and Zahorik, A.J. (1993), “Consumer satisfaction, Consumer retention andmarket share
”, Journal of Retailing
, Vol. 69 No. 2, pp. 193-215, 15(2):
113-130.
•
Morgan RM, Hunt SD (1994). “The Commitment – Trust Theory of Relationship marketing”. J. Mark., 58(3) 20–39.
•
Wang, Y. G., & Lo, H. P. (2002). Service quality, customer satisfaction and behavior intentions: Evidence from China’s telecommunication industry.
Inf. 4
(6),
50-60.
•
www.economictimes.com
REQUEST FOR FEEDBACK
Dear Readers
At the very outset, International Journal of Research in Commerce, IT and Management (IJRCM)
acknowledges & appreciates your efforts in showing interest in our present issue under your kind perusal.
I would like to request you to supply your critical comments and suggestions about the material published
in this issue as well as on the journal as a whole, on our E-mails i.e.
or
for further improvements in the interest of research.
If you have any queries please feel free to contact us on our E-mail
.
I am sure that your feedback and deliberations would make future issues better – a result of our joint
effort.
Looking forward an appropriate consideration.
With sincere regards
Thanking you profoundly
Academically yours
Sd/-