An Ant Colony Optimization Algorithm for Network
Vulnerability Analysis
M. Abadi
*and S. Jalili
**Abstract: Intruders often combine exploits against multiple vulnerabilities in order to break into the system. Each attack scenario is a sequence of exploits launched by an intruder that leads to an undesirable state such as access to a database, service disruption, etc. The collection of possible attack scenarios in a computer network can be represented by a directed graph, called network attack graph (NAG). The aim of minimization analysis of network attack graphs is to find a minimum critical set of exploits that completely disconnect the initial nodes and the goal nodes of the graph. In this paper, we present an ant colony optimization algorithm, called AntNAG, for minimization analysis of large-scale network attack graphs. Each ant constructs a critical set of exploits. A local search heuristic has been used to improve the overall performance of the algorithm. The aim is to find a minimum critical set of exploits that must be prevented to guarantee no attack scenario is possible. We compare the performance of the AntNAG with a greedy algorithm for minimization analysis of several large-scale network attack graphs. The results of the experiments show that the AntNAG can be successfully used for minimization analysis of large-scale network attack graphs.
Keywords: Ant Colony Optimization, Metaheuristic, Network Attack Graph, Network Vulnerability Analysis.
1 Introduction1
Our society has become increasingly dependent on computer networks and the trend towards larger networks will continue. Each network host runs different software packages and supports several modes of connectivity. Despite the best efforts of software architects and developers, network hosts inevitably contain a number of vulnerabilities. Hence, it is not feasible for a network administrator to remove all vulnerabilities present in the network hosts. Therefore, the recent focus in security of such networks is on analysis of vulnerabilities globally, finding exploits that are more critical, and preventing them to thwart an intruder.
When evaluating the security of a network, it is rarely enough to consider the presence or absence of isolated vulnerabilities [1]. This is because intruders often combine exploits against multiple vulnerabilities in order to reach their goals. For example, an intruder might exploit the vulnerability of a particular version of ftp to overwrite the .rhosts file on a victim host. In the
Iranian Journal of Electrical & Electronic Engineering, 2006. * M. Abadi is a PhD student at the Department of Computer Engineering, Tarbiat Modares University, Tehran 14115-143, Iran. ** S. Jalili is with the Department of Computer Engineering, Tarbiat Modares University, Tehran 14115-143, Iran.
E-mail:[email protected], [email protected].
next step, the intruder could remotely log in to the victim. In a subsequent step, the intruder could use the victim host as a base to launch another exploit on a new victim, and so on.
Dacier et al. [2] propose the concept of privilege graphs. Each node in the privilege graph represents a set of privileges owned by a user or a set of users. Edges represent vulnerabilities that can be exploited. Privilege graphs are then explored to construct attack state graphs, which represent different ways in which an intruder can reach a certain goal, such as root privilege on a host.
Phillips and Swiler [3] propose the concept of attack graphs in a more general way, where each node represents a possible attack state. Edges represent a change of state caused by a single action taken by the intruder.
Sheyner et al. [4] use a modified version of the model checker NuSMV [5] to produce attack graphs.
Ammann et al. [6] present a scalable attack graph representation. These attack graphs are essentially similar to [3], where any path in the graph from an initial node to a goal node shows a sequence of exploits that an intruder can launch to reach his goal.
Noel et al. [7, 8] present a number of techniques for managing network attack graph complexity through visualization.
The aim of minimization analysis of network attack graphs is to find a minimum critical set of exploits that must be prevented to guarantee no attack scenario is possible. Sheyner et al.[4] and Jha et al. [9, 10] show this problem is in fact NP-hard. They propose a greedy algorithm that can find an approximately-optimal set of exploits, which must be prevented to thwart an intruder. Ant Colony Optimization (ACO) [11, 12] is a metaheuristic method that is inspired by the behavior of real ants. The underlying idea is that by using very simple means of communications, a group of ants is able to find shortest paths between the nest and the food sources [13]. Along the way, ants leave a chemical substance called pheromone. If no pheromone trails are available, ants move essentially at random, but in the presence of pheromone, they have a tendency to follow the trail. In fact, ants probabilistically prefer paths that are marked by strong pheromone concentrations. Choices between different paths occur when several paths intersect. Then, ants choose the path to follow by a probabilistic decision biased by the amount of pheromone. Because ants in turn leave pheromone on the path they are following, this behavior results in a self-reinforcing process leading to the formation of paths marked by strong pheromone concentrations [14]. This behavior also enables ants to find shortest paths between the nest and the food sources.
ACO has been successfully applied to a large number of combinatorial optimization problems such as the traveling salesman problem [15], scheduling problems [16], and routing problems in telecommunication networks [17].
While it is currently possible to generate very large and complex network attack graphs, relatively little work has been done to analyze them.
In this paper, we present an ant colony optimization algorithm, called AntNAG, for minimization analysis of large-scale network attack graphs. A local search heuristic has been used to improve the overall performance of the algorithm. The aim is to find a minimum critical set of exploits that completely disconnect the initial nodes and the goal nodes of the graph. We also compare the performance of this algorithm with the greedy algorithm proposed by Sheyner et al. [4] and Jha et al. [9, 10] for minimization analysis of a sample network attack graph and several large-scale network attack graphs.
The remainder of this paper is organized as follows: Section 2 introduces our network security model. Section 3 describes network attack graphs. Section 4 presents AntNAG, an ant colony optimization algorithm for minimization analysis of large-scale network attack graphs. Section 5 reports the experimental results. Section 6 discusses the time complexity of the AntNAG with and without the local search heuristic, and finally Section 7 draws some conclusions.
2 Network Security Model
Our network security model is a tuple (S, H, Nc, T, E, R), where S is a set of services, H is a set of network hosts, Ncis a relation expressing connectivities
between network hosts, T is a relation expressing trust relationships between network hosts, E is a set of individual known exploits that intruder can use to construct attack scenarios, and Ris a model of intruder. Services
Each service s∈S is a pair (svn,p), where svn is the service name and p is the port on which the service is listening.
Network Hosts
Each network host h∈H is a tuple ( id, svcs, plvl, vuls), where id is the unique host identifier, svcs is a set of services running on the host, plvl is the level of privilege that the intruder has on the host, and vuls is a set of vulnerable components available on the host. Network Connectivities
Network connectivities are modeled as a relation
P H H
Nc⊆ × × , where P is a set of port numbers.
Each network connectivity c∈Nc is a triple (hs, ht,
p), where hs is the source network host, ht is the
target network host, and p is the target port number. It is important to note that the connectivity relation incorporates the network elements such as firewalls that restrict the ability of one host to connect to another. Trust Relationships
Trust relationships are modeled as a relation
H H
T⊆ × , where T(ht,hs) indicates that a user can
log in from the network host hs to the network host ht
without authentication. Exploits
Each exploit e∈E is a tuple (pre,hs,ht, post ), where
pre is a list of conditions that must hold before launching the exploit, hs is the network host from
which the exploit is launched, ht is the network host
targeted by the exploit, and post specifies the effects of exploit on the network.
To prevent an exploit, the security analyst may change the firewall configuration or patch the vulnerabilities that made this exploit possible. An exploit e∈E is inevitable if its prevention is not feasible or incurs high cost. The set of inevitable exploits is denoted by I. Intruder
The intruder has some information about the target network, such as known vulnerabilities, user passwords, etc.
3 Minimization Analysis
Let E be the set of exploits. A network attack graph is a tuple G=(V,A,V0,Vf,L), where V is the set of nodes, A is the set of directed edges, V0 ⊆V is the set of
initial nodes, Vf ⊆V is the set of goal nodes, and E
A :
L → is a labeling function where L(a)=e if and
only if an edge a=(v,v′) corresponds to an exploit e . A path π in G is a sequence of nodes v1,v2,...,vm,
such that vi∈V and (vi,vi+1)∈A, where 1≤i<m.
The label of path π is a subset of the set of exploits E. Each attack scenario corresponds to a complete path that starts from an initial node and ends in a goal node. Let E=
{
e1,e2,...,en}
be the set of exploits, I be theset of inevitable exploits, and S=
{
S1,S2,...,Sl}
be theset of attack scenarios represented by the network attack graph G. The attack scenario Sj∈S is hit by the exploit ei∈E if ei∈Sj.
For each exploit ei∈E, we define the total hit value )
(e
hvt i to be the number of attack scenarios that are hit
by e . i
{
j i j}
i
t(e) S S|e S
hv = ∈ ∈ (1)
Let U⊆E be a subset of exploits and hs(U) be the set of attack scenarios hit by some exploits of U.
{
S S|e S forsomee U}
hs(U)= j∈ i∈ j i∈ (2)
An exploit e is i redundant with respect to U if
hs(U) }) {e \
hs(U i = .
A subset of exploits C⊆E\I is critical if and only if all attack scenarios are hit by some exploits of it. Equivalently, C is critical if and only if every complete path from an initial node to a goal node of the network attack graph has at least one edge labeled with an exploit ei∈C. A critical set of exploits is minimal if it contains no redundant exploit.
A critical set of exploits C is minimum if there is no critical set of exploits C′ such that C′ < C . In general, there can be multiple minimum critical set of exploits. We define the cardinality of a critical set of exploits C to be the number of exploits of C.
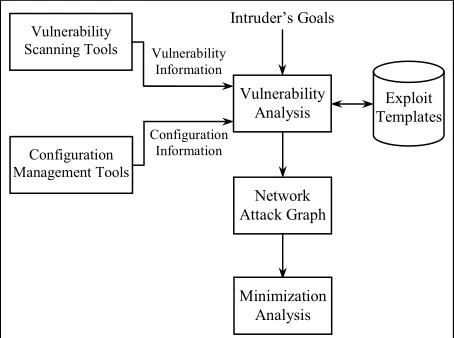
A typical process for finding a minimum critical set of exploits is shown in Fig. 1.
Fig. 1 Minimization analysis of network attack graphs.
First, vulnerability scanning tools, such as Nessus [18], determine vulnerabilities of individual network hosts. Using this vulnerability information along with exploit templates, intruder’s goals, and other information about the network, such as connectivity between network hosts, a network attack graph is generated. In this directed graph, each complete path from an initial node to a goal node corresponds to an attack scenario. The minimization analysis of the network attack graph determines a minimum critical set of exploits that must be prevented to guarantee no attack scenario is possible.
4 AntNAG
In this section, we present AntNAG, an ant colony optimization algorithm for minimization analysis of large-scale network attack graphs.
Each ant incrementally constructs a critical set of exploits. To each exploit ei is associated a pheromone
trail τi that indicates the desirability of including that
exploit into an ant’s solution.
Fig. 2 shows the pseudo-code of the AntNAG algorithm. The first step is to set parameters and initialize pheromone trails. Then repeated iterations of the algorithm are run until some termination condition is met (e.g., a maximum number of iterations is reached). Within each iteration, each ant starts with an empty set and constructs a critical set of exploits by incrementally adding exploits until all attack scenarios are hit. The critical sets of exploits constructed by ants may contain redundant exploits, which are eliminated. After that, the iteration-best solution is improved by a local search heuristic. Finally, the pheromone trails are updated using a global updating rule.
4.1 Solution Construction
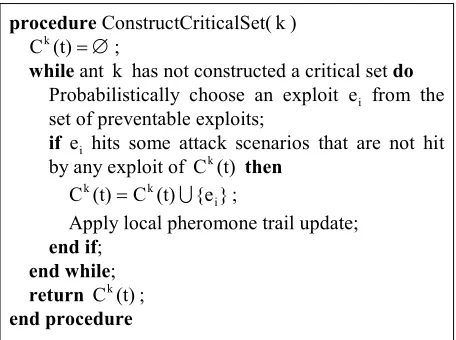
Each ant incrementally constructs a critical set of exploits using the algorithm shown in Fig. 3. At each construction step during iteration t, each ant k chooses an exploit from the set of preventable exploits to add to the partial solution Ck(t). The probability with which ant k chooses an exploit ei is as follows [12]:
Fig. 2 The AntNAG algorithm.
procedure AntNAG
Set parameters, initialize pheromone trails; while termination condition not met do
for each ant k do
Construct a critical set of exploits Ck(t); Eliminate redundant exploits of Ck(t); end for;
Apply local search heuristic to the iteration-best solution Cib(t);
Apply global pheromone trail update; end while;
endprocedure Exploit
Templates
Minimization Analysis Vulnerability
Analysis Intruder’s Goals
Network Attack Graph Vulnerability
Scanning Tools
Configuration Management Tools
Vulnerability Information
Configuration Information
∉ ∈ =
∑
∈ (t) N e if 0 (t) N e if (t)] [τ (t)] [τ (t) p k i k i (t) N e α j α i k i k j (3)where τi(t) is the amount of pheromone on the exploit
i
e at iteration t and Nk(t)⊆E\I is the set of preventable exploits which ant k has not yet chosen. α is a positive constant used to amplify the influence of pheromone trails. Large values of α give high importance to the pheromone trails on exploits, which may lead to rapid convergence to sub-optimal critical sets of exploits.
Fig. 3 The algorithm for constructing a critical set of exploits.
After choosing the exploit e , it will be added to the i
partial solution Ck(t) if it hits some attack scenarios of S that are not hit by any exploit of Ck(t).
Ants update the pheromone trails while constructing a solution. After adding an exploit e to the partial i
solution of ant k, the pheromone trail τ is updated i
using the local updating rule [12],
0 i
i(t) (1 ξ)τ(t) ξ.τ
τ = − + (4)
where 0≤ξ≤1 is the local evaporation rate and τ is 0
the lower pheromone trail limit. The value of τ is set 0
to be the same as the initial value for the pheromone trails.
The effect of the local updating rule is that each time an ant chooses an exploit, the pheromone trail on the exploit is reduced, so that the exploit becomes less desirable for the following ants. In other words, the local updating rule has the effect of lowering the pheromone trails on visited exploits so that they will be chosen with a lower probability by the other ants in their steps for constructing a critical set of exploits. This allows an increase in the exploration of exploits that have not been visited yet.
The pheromone trails can never fall below τ , because 0
the initial value for them is set to the value of τ and 0
the local updating rule always adds an amount of pheromone greater than or equal to τ . Having a lower 0
pheromone trail limit has the advantage that all exploits have a nonzero probability of being included in a critical set of exploits. This causes the algorithm not to show a premature stagnation behavior (i.e., ants do not follow the same path and hence do not construct the same critical set of exploits.
4.2 Minimal Solutions
The critical set of exploits constructed by an ant may not be minimal. In other words, it may contain redundant exploits, which must be eliminated.
Fig. 4 The algorithm for eliminating redundant exploits.
Let Ck(t)
be the critical set of exploits constructed by an ant k. For each exploit e , we define the i exclusive hit
value hv (e,Ck(t))
i
x to be the number of attack
scenarios that are hit by e , but that are not hit by any i
exploit of C (t)\{ei}
k
.
If an attack scenario is already hit by several other exploits of Ck(t)
, then extra hitting by an exploit (t)
C
e k
i∈ has no relevant effect. Hence, the exploit e i
is called candidate redundant with respect to Ck(t) if 0 (t)) C , (e hv k i
x = . The set of candidate redundant
exploits of Ck(t)
is denoted by Rk(t) .
{
e C (t)|hv (e,C (t)) 0}
(t)R x j k
k j
k = ∈ =
(5)
The exclusive hit value is used to define the selection value sv(e,Ck(t))
i of a candidate redundant exploit
(t) R
e k
i∈ .
∑
∈ = } {e \ (t) C e i k j x k i i k j }) {e \ (t) C , (e hv (t)) C , sv(e (6)A low value of sv(e,Ck(t))
i means that the candidate
redundant exploit e hits attack scenarios that are hit by i
too many other exploits of Ck(t)
, and hence it is a good candidate redundant exploit to be removed from Ck(t)
. procedure EliminateRedundantExploits(Ck(t)
)
{
e C (t)|hv (e,C (t)) 0}
(t) R k j x k j
k = ∈ =
; while Rk(t)≠∅
do Choose e Rk(t)
i∈ such that it has the minimum
selection value sv(e,Ck(t))
i ; } {e \ (t) C (t) C i k k = ;
{
e C (t)|hv (e,C (t)) 0}
(t) R k j x k j
k = ∈ =
; endwhile;
returnCk(t) ; endprocedure procedure ConstructCriticalSet(k )
∅ =
(t)
Ck ;
while ant k has not constructed a critical set do Probabilistically choose an exploit e from the i
set of preventable exploits;
if e hits some attack scenarios that are not hit i by any exploit of Ck(t) then
} {e (t) C (t) C i k
k = ∪
;
Apply local pheromone trail update; end if;
end while; return Ck(t); endprocedure
Accordingly, the selection value is used to evaluate candidate redundant exploits of a critical set of exploits in order to choose a candidate redundant exploit to be removed from it.
In Fig. 4, an algorithm is presented, which can be used to eliminate redundant exploits of Ck(t). The algorithm is based on the idea that it is good to remove an exploit
i
e from Ck(t) if e is a candidate redundant exploit i
and hits attack scenarios that are hit by too many other exploits of Ck(t). Hence, the algorithm removes at each step a candidate redundant exploit that has the minimum selection value. This is repeated until a minimal critical set of exploits is obtained.
4.3 Local Search Heuristic
After the minimal critical sets of exploits are constructed, the iteration-best solution (i.e., the minimal critical set of exploits constructed by the iteration-best ant) is improved by a local search heuristic.
The local search heuristic is based on the following idea. Given the iteration-best solution Cib(t), suppose there is an exploit ej∉Cib(t) such that C (t) {ej}
ib ∪
contains at least two exploits other than e , say j
l
1 i
i,...,e
e , with l≥2 that are redundant. Then }
{e }) e ..., , {e \ (t)
(C i i j
ib
l
1 ∪ is a better critical set of
exploits than Cib(t). The gain of the exploit e with j
respect to Cib(t) is g(ej)=l−1. In this case, we call e j
a candidate dominant exploit.
Fig. 5 The local search heuristic.
As shown in Fig. 5, the local search heuristic starts with the iteration-best solution Cib(t)
and chooses a candidate dominant exploit having the highest gain. Then the chosen candidate dominant exploit is added to
(t) Cib
and the set of redundant exploits are removed from the resulting critical set of exploits. This is repeated until no better critical set of exploits is obtained.
4.4 Global Pheromone Trail Update The last step in an iteration of the AntNAG is the updating of pheromone trails using the following global updating rule:
(t) C e (t) ∆τ ρ. (t) ρ)τ (1 1) (t
τ ib
i ib i i
i + = − + ∀ ∈ (7)
where 0<ρ≤1 is the global evaporation rate, Cib(t) is the minimal critical set of exploits constructed by the iteration-best ant, and ∆τibi (t) is the amount of pheromone deposited by the iteration-best ant on the exploit e at iteration t of the algorithm. i ∆τ (t)
ib i is
defined as follows:
| (t) C | | E | (t)
∆τibi = − ib (8)
It is important to note that in the global updating rule, both evaporation and new pheromone deposit are only applied to the exploits of Cib(t)
. Also, the deposited pheromone is discounted by a factor ρ ; this results in the new pheromone trail being a weighted average between the old pheromone value and the amount of the pheromone deposited. For small values of ρ , the existing pheromone trails on exploits evaporate slowly, while the influence of the iteration-best critical set of exploits is dampened. On the other hand, for large values of ρ , the previous pheromone deposits evaporate rapidly, but the influence of the iteration-best critical set of exploits is emphasized.
5 Experiments
In order to evaluate the performance of the AntNAG, we performed our experiments over a sample network attack graph and several randomly generated large-scale network attack graphs.
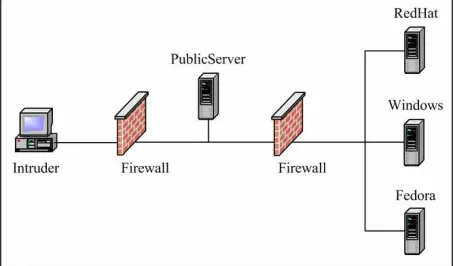
5.1 Sample Network Attack Graph Consider the network shown in Fig. 6. There are three target hosts called RedHat, Windows and Fedora on an internal network, and a host called PublicServer on an isolated demilitarized zone (DMZ) network.
A number of services are running on each of the hosts of RedHat, Windows, Fedora, and PublicServer. Also, each of the above hosts has a number of vulnerabilities. Vulnerability scanning tools, such as Nessus [18], can be used to find the vulnerabilities of each host.
Fig. 6 An example network.
procedure LocalSearch(Cib(t) )
{
e C (t)|g(e ) 0}
(t)
D j
ib j
ib = ∉ >
; while Dib(t)≠∅
do Choose e Dib(t)
i∈ such that it has the highest
gain g(ei); } {e (t) C (t)
C i
ib
ib = ∪
;
Eliminate redundant exploits of Cib(t) ;
{
e C (t)|g(e ) 0}
(t)
D j
ib j
ib = ∉ >
; endwhile;
return Cib(t) ; endprocedure
Different types of services and vulnerabilities available on the network hosts are introduced in Table A.1 of Appendix A.
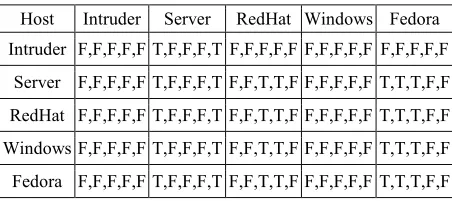
The RedHat host on the internal network is running ftp and ssh services. The Fedora host is running several services: LICQ chat software, Squid web proxy, ftp and a database. The LICQ client lets Linux users exchange text messages over the Internet. The Squid web proxy is a full-featured web proxy cache. It stores requested Internet objects on a system closer to the requesting site than to the source. Web browsers can then use the local Squid cache as a proxy server, reducing access time as well as bandwidth consumption. The PublicServer host on the DMZ network is running IIS and Exchange services. The connectivity information between the network hosts is shown in Table 1. In this Table, each entry corresponds to a pair of (hs,ht) in which h is s
the source network host and h is the target network t
host. Every entry has five boolean values. These values are ‘T’ if the network host h can connect to the s
network host h on the ports of t http, licq, ftp, ssh,
and smtp, respectively.
The intruder launches his attack starting from a single network host, called Intruder, which lies on the outside network. His goal is to disrupt the database service on the network host Fedora. To achieve this goal, the intruder should gain the root privilege on this network host.
Table 1 Network connectivity information.
Host Intruder Server RedHat Windows Fedora
Intruder F,F,F,F,F T,F,F,F,T F,F,F,F,F F,F,F,F,F F,F,F,F,F
Server F,F,F,F,F T,F,F,F,T F,F,T,T,F F,F,F,F,F T,T,T,F,F
RedHat F,F,F,F,F T,F,F,F,T F,F,T,T,F F,F,F,F,F T,T,T,F,F
Windows F,F,F,F,F T,F,F,F,T F,F,T,T,F F,F,F,F,F T,T,T,F,F
Fedora F,F,F,F,F T,F,F,F,T F,F,T,T,F F,F,F,F,F T,T,T,F,F
There are wdir, fshell, and sshd_bof vulnerabilities on the RedHat host, scripting vulnerability on the Windows host, wdir, fshell, squid_conf, and licq_ivv vulnerabilities on the Fedora host, and iis_bof and exchange_ivv on the PublicServer host. Also, at and xterm programs on the RedHat and Fedora are vulnerable to buffer overflow.
The intruder can use ten generic exploits. In Table B.1 of Appendix B, each generic exploit is represented by its preconditions and postconditions. The description of each generic exploit is given in Table B.2 of Appendix B. More information about each of the exploits is available in the CVE List [19], which is a publicly available list or dictionary of standardized identifiers for common vulnerabilities and exposures.
Among the ten generic exploits shown in Table B.1, the first eight generic exploits require a pair of network hosts while the last two generic exploits require only one network host. Therefore, there are totally (8 * 5 * 4)
+ (2 * 4) = 168 exploits, which the intruder can try. Each attack scenario for the above network consists of a subset of these 168 exploits. For example, consider the following attack scenario:
(1) iis_r2r(Intruder,PublicServer) (2) squid_ps(PublicServer,Fedora) (3) licq_r2u(PublicServer,Fedora) (4) xterm_u2r(Fedora,Fedora)
The intruder first launches the iis_r2r exploit to gain root privilege on the PublicServer host. Then he uses the PublicServer host to launch a port scan via the vulnerable Squid web proxy running on the Fedora host. The scan discovers that it is possible to gain user privilege on the Fedora host with launching the licq_r2u exploit. After that, a simple local buffer overflow gives the intruder root privilege on the Fedora host. The attack graph for the above network consists of 164 attack scenarios. Each attack scenario contains from 4 to 9 exploits.
5.1.1 Experimental Results
We applied the AntNAG for minimization analysis of the above network attack graph. To evaluate the performance of the algorithm, we performed several experiments.
In the first experiment, we assumed that the set of inevitable exploits is empty, i.e., all exploits are preventable. Therefore, the aim was to find a minimum critical set of exploits among 168 exploits. Using the AntNAG, the following minimum critical set of exploits was found:
{
iis_r2r(Intruder,PublicServer),C=
}
) ,
(Intruder PublicServer 2u
exchange_r
In the second experiment, we assumed that the generic exploits iis_r2r, exchange_r2u, and xterm_u2r are inevitable, i.e., the prevention of them is not feasible or incurs high cost. Therefore, the aim was to find a minimum critical set of exploits among 124 exploits. Using the AntNAG, the following minimum critical set of exploits was found:
{
licq_r2u(PublicServer,Fedora),C=
), ,
(RedHat Fedora
licq_r2u
), ,
(PublicServer Windows
script_r2u
), ,
(PublicServer Fedora
ftp_rhosts
}
) , (RedHat Fedora
ftp_rhosts
While using the greedy algorithm proposed by Sheyner et al. [4] and Jha et al. [9, 10], the following minimum critical set of exploits was found:
{
script_r2u(PublicServer,Windows), C=), ,
(Fedora Fedora
at_u2r
), ,
(PublicServer RedHat
sshd_r2u
), ,
(PublicServer RedHat
ftp_rhosts
), ,
(PublicServer Fedora
squid_ps
}
) , (PublicServer Fedora
ftp_rhosts
The second experiment shows the AntNAG can find a critical set of exploits with less cardinality.
In the experiments, the AntNAG parameters were set to 1
τ0 = , α=1, ξ=0.1, and ρ=0.1. The number of
ants was set to m=10 and the maximum number of iterations was set to tm =50.
5.2 Large-Scale Network Attack Graphs A large computer network builds upon multiple platforms, runs different software packages and supports several modes of connectivity. Despite the best efforts of software architects and developers, each network host inevitably contains a number of vulnerabilities. Several factors can make network attack graphs larger so that finding a minimum critical set of exploits becomes more difficult. An obvious factor is the size of the network under analysis. Our society has become increasingly dependent on computer networks and the trend towards larger networks will continue. For example, there are enterprises today consisting of tens of thousands of network hosts. Also, less secure networks clearly have larger network attack graphs. Each network host might have several exploitable vulnerabilities. When considered across a large enterprise, network attack graphs become potentially large [20].
Table 2 Large-scale network attack graphs.
Network Attack Graph
Cardinality of the Set of Exploits (n)
Cardinality of the Set of Attack
Scenarios (l)
Average Cardinality of Attack Scenarios
1
NAG 100 1000 5.93
2
NAG 200 2000 6.01
3
NAG 400 4000 5.99
4
NAG 400 6000 5.99
5
NAG 800 8000 6.01
6
NAG 800 10000 6.04
7
NAG 100 1000 7.56
8
NAG 200 2000 7.55
9
NAG 400 4000 7.52
10
NAG 400 6000 7.48
11
NAG 800 8000 7.48
12
NAG 800 10000 7.50
In order to further evaluate the performance of the AntNAG, we randomly generated 12 large-scale network attack graphs, denoted by NAG1, NAG2, ...,
12
NAG . For each network attack graph, we considered
different values for the cardinalities of E and S, where E is the set of known exploits and S is the set of attack scenarios represented by the network attack graph. In NAG1, ..., NAG6, attack scenarios contain
from 3 to 9 exploits while in NAG7, ..., NAG12, attack
scenarios contain from 3 to 12 exploits.
Table 2 shows the cardinality of the set of known exploits, the cardinality of the set of attack scenarios, and the average cardinality of attack scenarios for each generated network attack graph.
5.2.1 Experimental Results
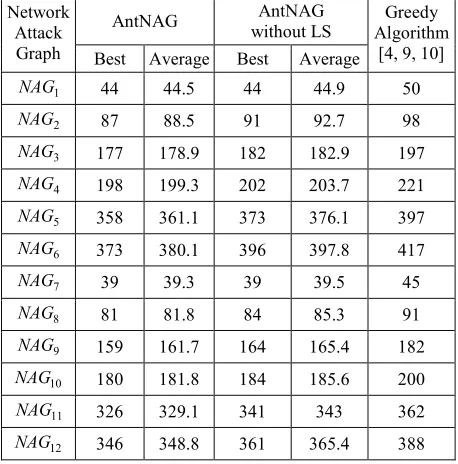
We applied the AntNAG for minimization analysis of the above large-scale network attack graphs. We performed 10 runs of the algorithm with different random seeds and reported the best cardinality and the average cardinality of critical sets of exploits obtained from these 10 runs. We also applied the greedy algorithm proposed by Sheyner et al. [4] and Jha et al. [9, 10] for minimization analysis of the above network attack graphs.
As shown in Table 3, the AntNAG outperforms the greedy algorithm and finds critical sets of exploits with less cardinality. Also, the AntNAG performs significantly better than the AntNAG without the local search heuristic. On average, the cardinality of critical sets of exploits found by the AntNAG and the AntNAG without the local search heuristic are, respectively, 9.98% and 7.20% less than the cardinality of critical sets of exploits found by the greedy algorithm.
Table 3 Cardinality of critical set of exploits found by the AntNAG and the greedy algorithm.
AntNAG AntNAG
without LS Network
Attack
Graph Best Average Best Average
Greedy Algorithm
[4, 9, 10]
1
NAG 44 44.5 44 44.9 50
2
NAG 87 88.5 91 92.7 98
3
NAG 177 178.9 182 182.9 197
4
NAG 198 199.3 202 203.7 221
5
NAG 358 361.1 373 376.1 397
6
NAG 373 380.1 396 397.8 417
7
NAG 39 39.3 39 39.5 45
8
NAG 81 81.8 84 85.3 91
9
NAG 159 161.7 164 165.4 182
10
NAG 180 181.8 184 185.6 200
11
NAG 326 329.1 341 343 362
12
NAG 346 348.8 361 365.4 388
In the experiments, the AntNAG parameters were set to 1
τ0 = , α=1, and ξ=0.1. The number of ants was set
to m=15 and the maximum number of iterations was set to tm =100. For minimization analysis of NAG1
and NAG7, ρ was set to 0.1, for minimization analysis
of NAG2, NAG3, NAG4, NAG8, NAG9 and NAG10,
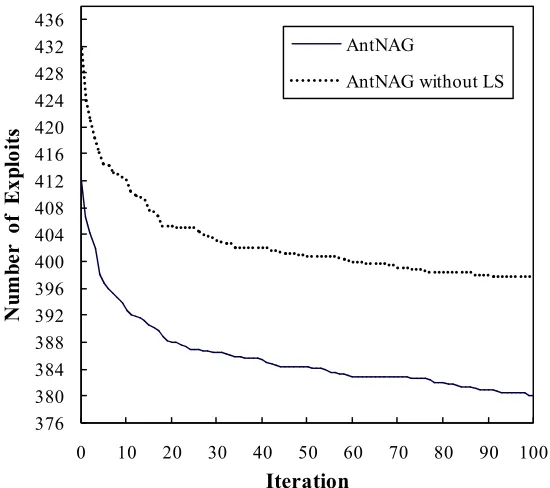
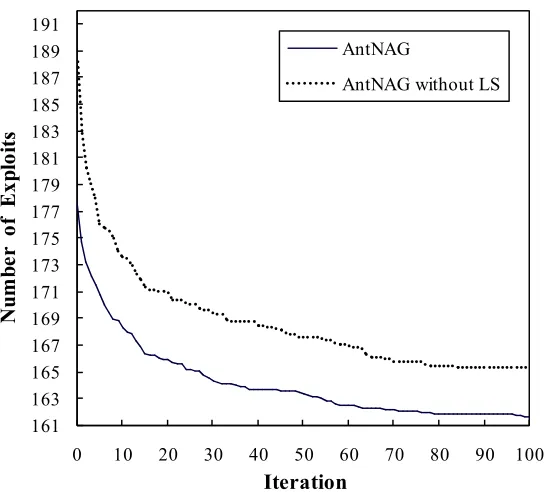
ρ was set to 0.05, and for minimization analysis of the other network attack graphs, ρ was set to 0.025. Figures 7 to 10 show the progress of the average cardinality of the global-best solution (i.e., the best critical set of exploits found from the first iteration of the algorithm), obtained from 10 runs of the AntNAG and 10 runs of the AntNAG without the local search
heuristic for minimization analysis of NAG4, NAG6, 9
NAG , and NAG11, respectively. The cardinality of the
global-best solution is expected to be as small as possible. As the figures show, the local search heuristic is essential for the construction of high-quality critical sets of exploits. This is because after improving the iteration-best solution by the local search heuristic, pheromone trails are updated on the exploits of the locally optimized solution.
197 199 201 203 205 207 209 211 213 215 217 219 221 223 225 227
0 10 20 30 40 50 60 70 80 90 100
N
u
m
b
e
r
o
f
E
x
p
lo
it
s
Iteration
AntNAG
AntNAG without LS
Fig. 7 Progress of the average cardinality of the global-best solution of the AntNAG and the AntNAG without the local search heuristic on NAG4.
376 380 384 388 392 396 400 404 408 412 416 420 424 428 432 436
0 10 20 30 40 50 60 70 80 90 100
N
u
m
b
e
r
o
f
E
x
p
lo
it
s
Iteration
AntNAGAntNAG without LS
Fig. 8 Progress of the average cardinality of the global-best solution of the AntNAG and the AntNAG without the local search heuristic on NAG6.
161 163 165 167 169 171 173 175 177 179 181 183 185 187 189 191
0 10 20 30 40 50 60 70 80 90 100
N
u
m
b
e
r
o
f
E
x
p
lo
it
s
Iteration
AntNAG
AntNAG without LS
Fig. 9 Progress of the average cardinality of the global-best solution of the AntNAG and the AntNAG without the local search heuristic on NAG9.
326 330 334 338 342 346 350 354 358 362 366 370 374 378 382 386
0 10 20 30 40 50 60 70 80 90 100
N
u
m
b
e
r
o
f
E
x
p
lo
it
s
Iteration
AntNAGAntNAG without LS
Fig. 10 Progress of the average cardinality of the global-best solution of the AntNAG and the AntNAG without the local search heuristic on NAG11.
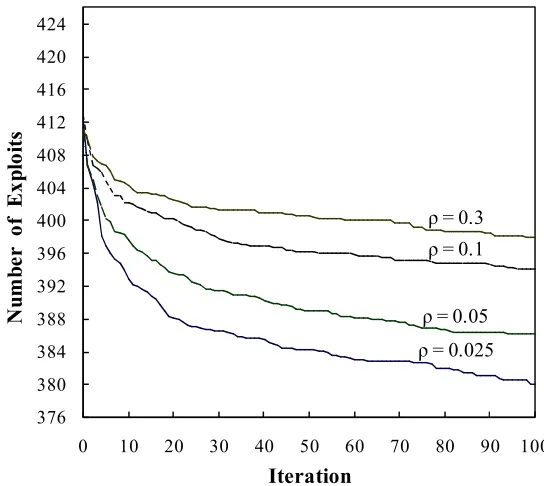
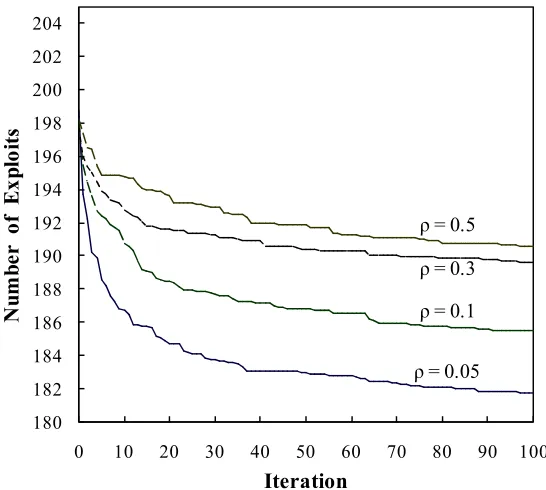
Figures 11 to 14 show the effect of the different values of the global evaporation rate, ρ , on the performance of the AntNAG. The results were obtained from 10 runs of the AntNAG for minimization analysis of NAG3,
6
NAG , NAG10, and NAG11. The figures suggest that by
decreasing the value of the global evaporation rate ρ , the average cardinality of the global-best solution will decrease. For small values of ρ , the existing pheromone trails on exploits evaporate slowly, while the influence of the iteration-best solution is dampened.
176 178 180 182 184 186 188 190 192 194 196 198 200
0 10 20 30 40 50 60 70 80 90 100
N
u
m
b
e
r
o
f
E
x
p
lo
it
s
Iteration
ρ = 0.05 ρ = 0.1 ρ = 0.3 ρ = 0.5
Fig. 11 Effect of the global evaporation rate on the performance of the AntNAG on NAG3.
376 380 384 388 392 396 400 404 408 412 416 420 424
0 10 20 30 40 50 60 70 80 90 100
N
u
m
b
e
r
o
f
Ex
p
lo
it
s
Iteration
ρ = 0.025 ρ = 0.05
ρ = 0.1 ρ = 0.3
Fig. 12 Effect of the global evaporation rate on the performance of the AntNAG on NAG6.
180 182 184 186 188 190 192 194 196 198 200 202 204
0 10 20 30 40 50 60 70 80 90 100
N
u
m
b
e
r
o
f
E
x
p
lo
it
s
Iteration
ρ = 0.05 ρ = 0.1 ρ = 0.5
ρ = 0.3
Fig. 13 Effect of the global evaporation rate on the performance of the AntNAG on NAG10.
326 330 334 338 342 346 350 354 358 362 366 370 374
0 10 20 30 40 50 60 70 80 90 100
N
u
m
b
e
r
o
f
E
x
p
lo
it
s
Iteration
ρ = 0.025 ρ = 0.05
ρ = 0.1 ρ = 0.3
Fig. 14 Effect of the global evaporation rate on the performance of the AntNAG on NAG11.
It should be noted that the best value of ρ is different for network attack graphs with different scales. This is because, as defined in Eq. (8), the amount of pheromone deposited by the iteration-best ant is obtained as a function of the cardinality of the set of exploits. The larger the cardinality of the set of exploits, the lower the value of ρ is chosen.
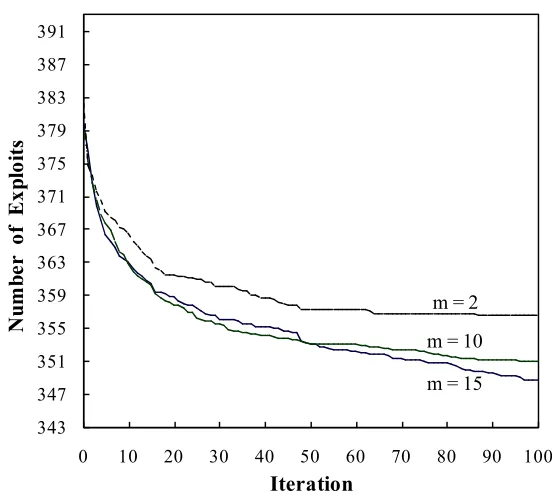
Figures 15 and 16 show the effect of the number of ants,
m, on the performance of the AntNAG, obtained from 10 runs of the AntNAG for minimization analysis of
4
NAG and NAG12. As the figures show, when using a
very small number of ants, the algorithm shows a premature stagnation behavior. This is because the fewer the number of ants, the less the exploration ability of the algorithm, and consequently the less information about the search space is available to all ants.
197 199 201 203 205 207 209 211 213 215 217 219 221
0 10 20 30 40 50 60 70 80 90 100
N
u
m
b
e
r
o
f
E
x
p
lo
it
s
Iteration
m = 15 m = 10 m = 2
Fig. 15 Effect of the number of ants on the performance of the AntNAG on NAG4.
343 347 351 355 359 363 367 371 375 379 383 387 391
0 10 20 30 40 50 60 70 80 90 100
N
u
m
b
e
r
o
f
Ex
p
lo
it
s
Iteration
m = 15 m = 10 m = 2
Fig. 16 Effect of the number of ants on the performance of the AntNAG on NAG12.
6 Time Complexity
Let m be the number of ants and tm be the maximum
number of iterations. At each iteration t of the AntNAG, each ant k starts with an empty set and constructs a critical set of exploits Ck(t) by incrementally adding exploits until all attack scenarios are hit. The construction of Ck(t) takes O(n⋅l) time, where n is the cardinality of the set of preventable exploits and l is the cardinality of the set of attack scenarios. The redundant exploits of Ck(t) are then eliminated using the algorithm in Fig. 4, which runs in
l)
O(n2⋅ time. After that, the iteration-best solution
(t)
Cib is improved by the local search heuristic in Fig. 5, which runs in O(n3⋅l) time. Finally, the pheromone trails are updated using the global updating rule, which takes O(n) time. The overall time complexity of the AntNAG is therefore O(tm⋅n3⋅l).
Strictly speaking, it is O(tm⋅n2⋅l⋅(n+m)), but we
usually set m to a small value. Hence, the time complexity can be simplified to O(tm⋅n3⋅l). Similarly,
the overall time complexity of the AntNAG without the local search heuristic is O(tm⋅m⋅n2⋅l). It should be
noted that the time complexity of the greedy algorithm proposed by Sheyner et al. [4] and Jha et al. [9, 10] is
l)
O(n2⋅ .
7 Conclusions
Each network attack graph represents the collection of possible attack scenarios in a computer network. Each attack scenario is a sequence of exploits that leads to an undesirable state. An example of an undesirable state is one that the intruder gains root privilege on a critical network host. The aim of minimization analysis of a network attack graph is to find a minimum critical set of exploits, which must be prevented to thwart an intruder. This problem is in fact NP-hard.
In this paper, we presented an ant colony optimization algorithm, called AntNAG, for minimization analysis of network attack graphs. We reported the results of applying this algorithm for minimization analysis of a sample network attack graph and 12 large-scale network attack graphs. We also applied the greedy algorithm proposed by Sheyner et al. [4] and Jha et al. [9, 10] for minimization analysis of the above network attack graphs. On average, the cardinality of critical sets of exploits found by the AntNAG and the AntNAG without the local search heuristic were, respectively, 9.98% and 7.20% less than the cardinality of critical sets of exploits found by the greedy algorithm. The results of experiments show that the AntNAG performs significantly better than the AntNAG without the local search heuristic and finds a critical set of exploits with less cardinality. This shows the significance of the local search heuristic in the AntNAG.
Acknowledgments
This work was supported in part by ITRC.
References
[1] Abadi M. and Jalili S., “Automatic discovery of network attack scenarios using SPIN model checker”, In Proceedings of the International Symposium on Telecommunications, pp. 81-86, Shiraz, Iran, September 2005.
[2] Dacier M., Deswarte Y., and Kaâniche M., “Quantitative assessment of operational security: Models and tools”, Technical Report, LAAS Research Report 96493, Laboratory for Analysis and Architecture of Systems, May 1996.
[3] Phillips C. and Swiler L. P., “A graph-based system for network-vulnerability analysis”, In Proceedings of the 1998 Workshop on New Security Paradigms, pp. 71-79, Charlottesville, VA, USA, September 1998.
[4] Sheyner O., Haines J., Jha S., Lippmann R., and Wing J. M., “Automated generation and analysis of attack graphs”, In Proceedings of the 2002 IEEE Symposium on Security and Privacy, pp.
273-284, Berkeley, CA, USA, May 2002.
[5] NuSMV. “NuSMV: A New Symbolic Model Checker”. http://afrodite.itc.it:1024/nusmv/. [6] Ammann P., Wijesekera D., and Kaushik S.,
“Scalable, graph-based network vulnerability analysis”, In Proceedings of the 9th ACM Conference on Computer and Communications Security, pp. 217-224, Washington, DC, USA, November 2002.
[7] Noel S., Jacobs M., Kalapa P., and Jajodia S., “Multiple coordinated views for network attack graphs”, In Proceedings of the IEEE Workshop on Visualization for Computer Security (VizSEC 2005), pp. 99-106, Minneapolis, MN, USA, October 2005.
[8] Noel S. and Jajodia S., “Understanding complex network attack graphs through clustered adjacency matrices”, In Proceedings of the 21st Annual Computer Security Applications Conference (ACSAC 2005), pp. 160-169, Tucson, Arizona, USA, December 2005.
[9] Jha S., Sheyner O., and Wing J. M., “Minimization and reliability analysis of attack graphs”, Technical Report, School of Computer Science, Carnegie Mellon University, February 2002.
[10] Jha S., Sheyner O., and Wing J. M., “Two formal analyses of attack graphs”, In Proceedings of the 15th IEEE Computer Security Foundations Workshop, pp. 49-63, Cape Breton, Nova Scotia, Canada, June 2002.
[11] Dorigo M. and Di Caro G., “The ant colony optimization meta-heuristic”, In D. Corne, M. Dorigo, and F. Glover (Eds.), New Ideas in Optimization, pp. 11-32, McGraw Hill, London, UK, 1999.
[12] Dorigo M. and Stützle T., Ant Colony Optimization, MIT Press, Cambridge, MA, USA, 2004.
[13] Dorigo M., Di Caro G., and Gambardella L. M., “Ant algorithms for discrete optimization”, Artificial Life, Vol. 5, No. 2, pp. 137-172, 1999. [14] Dorigo M. and Stützle T., “The ant colony
optimization metaheuristic: Algorithms, applications and advances”, In F. Glover and G.
Kochenberger (Eds.), Handbook of
Metaheuristics, Vol. 57, pp. 251-285, Kluwer Academic Publishers, Norwell, MA, USA, 2002. [15] Stützle T. and Dorigo M., “ACO algorithms for
the traveling salesman problem”, In K. Miettinen et al. (Eds.), Evolutionary Algorithms in Engineering and Computer Science, pp. 163-183, John Wiley & Sons, New York, NY, USA, 1999. [16] Merkle D., Middendorf M., and Schmeck H.,
“Ant colony optimization for resource constrained project scheduling”, In Proceedings of the Genetic and Evolutionary Computation Conference (GECCO 2000), pp. 893-900, Las
Vegas, NV, USA, July 2000.
[17] Di Caro G. and Dorigo M., “AntNet: Distributed stigmergetic control for communications networks”, Journal of Artificial Intelligence Research (JAIR), Vol. 9, pp. 317-365, 1998. [18] Deraison R., “Nessus Vulnerability Scanner”.
http://www.nessus.org/.
[19] CVE List, “CVE: Common Vulnerabilities and Exposures”. http://cve.mitre.org/.
[20] Ammann P., Pamula J., Ritchey R., and Street J., “A host-based approach to network attack chaining analysis”, In Proceedings of the 2005 Annual Computer Security Applications Conference (ACSAC 2005), pp. 72-84, Tucson, AZ, USA, December 2005.
Appendix A. Description of Vulnerabilities
Table A.1 Types of services and vulnerabilities running on the network hosts.
) (h
iis_bof IIS web server has buffer overflow
vulnerability on host h
) (h vv
exchange_i Exchange mail server has input validation vulnerability on host h
) (h
squid_conf Squid web proxy is misconfigured on
host h
) (h
licq_ivv LICQ client has input validation
vulnerability on host h
) (h
sshd_bof sshd server has buffer overflow
vulnerability on host h
) (h
scripting HTML scripting is enabled on host h
) (h
ftp ftp service is running on host h
) (h
wdir ftp home directory is writable on host h
) (h
fshell ftp user has executable shell on host h
) (h
ssh ssh service is running on host h
) (h
xterm_bof xterm program has buffer overflow
vulnerability on host h
) (h
at_bof atvulnerability on host program has hbuffer overflow
) (h
database database service is running on host h
Appendix B. Description of Exploits
Table B.1 Exploit templates.
Exploit Preconditions Postconditions
) , (hs ht iis_r2r
) (ht iis_bof
) , , (h h http
C s t
user ) (hs ≥ plvl
root ) (ht < plvl
) (ht iis ¬
root : ) (ht = plvl
) , (hs ht 2u exchange_r
) (ht vv exchange_i
) , , (h h smtp
C s t
user ) (hs ≥ plvl
none ) (ht = plvl
user : ) (ht = plvl
) , (hs ht squid_ps
) (ht squid_conf scan ¬ ) , , (h h http
C s t
user ) (hs ≥ plvl
scan
) , (hs ht licq_r2u
) (ht licq_ivv scan
) , , (h h licq
C s t
user ) (hs ≥ plvl
none ) (ht = plvl
user : ) (ht = plvl
) , (hs ht script_r2u
) (ht scripting
) , , (h h http
C t s
user ) (hs ≥ plvl
none ) (ht = plvl
user : ) (ht = plvl
) , (hs ht sshd_r2r
) (ht sshd_bof
) , , (h h ssh
C s t
user ) (hs ≥ plvl
root ) (ht < plvl
) (ht ssh ¬
root : ) (ht = plvl
) , (hs ht ftp_rhosts
) (ht ftp
) (ht wdir
) (ht fshell
) , (ht hs T ¬
) , , (h h ftp
C s t
user ) (hs ≥ plvl
) , (ht hs T
) , (hs ht rsh_r2u
) , (ht hs T
user ) (hs ≥ plvl
none ) (ht = plvl
user : ) (ht = plvl
) , (ht ht
xterm_u2r xterm_bof(ht)
user ) (ht =
plvl plvl(ht):=root
) , (ht ht
at_u2r at_bof(ht)
user ) (ht =
plvl plvl(ht):=root
Table B.2 Description of generic exploits. Exploit Description
iis_r2r
Buffer overflow vulnerability in the IIS web server allows remote intruders to gain root shell on the target network host
2u exchange_r
The OLE component in the Microsoft Exchange mail server does not properly validate the lengths of messages for certain OLE data, which allows remote intruders toexecute arbitrary code
squid_ps
The intruder can use a misconfigured Squid web proxy to conduct unauthorized activities such as port scanning
licq_r2u
The intruder can send a specially crafted URL to the LICQ client to execute arbitrary commands on the target network host
script_r2u
Microsoft Internet Explorer allows remote intruders to execute arbitrary code via malformed Type and Content-Disposition header fields that cause the application for the spoofed file type to pass the file back to the operating system for handling rather than raise an error message
sshd_r2r
Buffer overflow vulnerability in the sshd server allows remote intruders to gain root shell on the target network host
ftp_rhosts
Using ftp vulnerability, the intruder creates a .rhosts file in the ftp home directory, creating a remote login trust relationship between his network host and the target network host
rsh_r2u
Using an existing remote login trust relationship between two hosts, the intruder logs in from one machine to another, getting a user shell without supplying a password
xterm_u2r
Buffer overflow vulnerability in the xterm program allows local users to gain root shell on the target network host
at_u2r
Buffer overflow vulnerability in the at program allows local users to gain root shell on the target network host
Mahdi Abadi is a Ph.D. student of computer engineering at Tarbiat Modares University. He received the M.Sc. degree in software engineering from that university in 2001, and the B.Sc. degree in software engineering from Ferdowsi University of Mashhad in 1998. His main research interests are network security, intrusion detection, evolutionary algorithms, and data mining. Currently, Mahdi Abadi works on his Ph.D. thesis on network vulnerability analysis.
Saeed Jalili received the Ph.D. degree from Bradford University in 1991 and the M.Sc. degree in computer science from Sharif University of Technology in 1979. Since 1992, he has been assistant professor at the Tarbiat Modares University. His main research interests are machine learning, intrusion detection, security protocol verification, and software runtime verification.