DECREASE THE OUTLET WATER TEMPERATURE
OF CROSS FLOW COOLING TOWER
*R.Immanual, **S.Rajakumar, ***B.Ragupathi, ***S.P.Ramkumar,
*PG student, ** Assistant Professor Department of Mechanical Engineering,
Regional campus, Anna University Tirunelveli Region, Tirunelveli, India ***UG student, Department of Mechanical Engineering,
Government college of Engineering, Tirunelveli Tirunelveli, India
ABSTRACT
In this paper two methods developed to reduce the outlet water temperature of the cross flow cooling tower in DCW limited. Due to reduction of the outlet water temperature the cooling range will be increased and it also leads to the increase the efficiency of the overall power plant. The first method deals with the water path cooling. The decrease in the outlet water temperature by using water path cooling is proved by the conventional heat transfer formulae. The second method deals with the decrease the liquid to gas flow ratio(L/G) by increasing the air velocity with the help of cylinder blocks near the louvers of cooling tower. Decrease in the outlet water temperature by using decrease the L/G ratio proved by the combination of literature review and CFD analysis of air flow.
Keywords: cross flow cooling tower, L/G ratio, CFD analysis, cooling range, water path cooling
INTRODUCTION
assembled air inlet pipe cooling tower models have not obtained any performance enhancement. From the literature survey RNG K-ε model is suitable for turbulence analysis. ANSYS commercial package give good results on finest element Engineering application.
WATER PATH COOLING
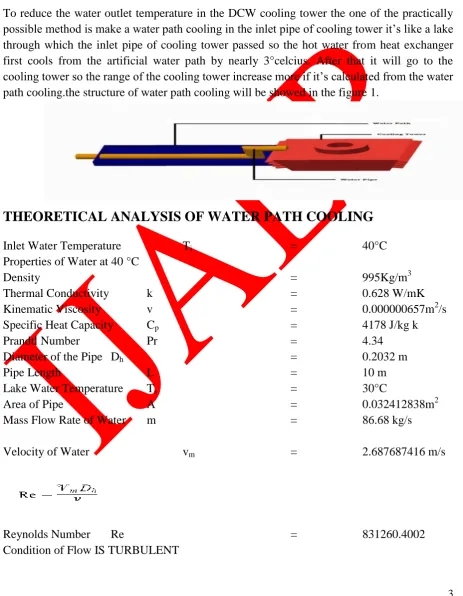
To reduce the water outlet temperature in the DCW cooling tower the one of the practically possible method is make a water path cooling in the inlet pipe of cooling tower it’s like a lake through which the inlet pipe of cooling tower passed so the hot water from heat exchanger first cools from the artificial water path by nearly 3°celcius. After that it will go to the cooling tower so the range of the cooling tower increase more if it’s calculated from the water path cooling.the structure of water path cooling will be showed in the figure 1.
Figure 1 Figure 1
THEORETICAL ANALYSIS OF WATER PATH COOLING
Inlet Water Temperature Ti = 40°C
Properties of Water at 40 °C
Density = 995Kg/m3
Thermal Conductivity k = 0.628 W/mK
Kinematic Viscosity v = 0.000000657m2/s
Specific Heat Capacity Cp = 4178 J/kg k
Prandtl Number Pr = 4.34
Diameter of the Pipe Dh = 0.2032 m
Pipe Length L = 10 m
Lake Water Temperature Ts = 30°C
Area of Pipe A = 0.032412838m2
Mass Flow Rate of Water m = 86.68 kg/s
Velocity of Water vm = 2.687687416 m/s
Reynolds Number Re = 831260.4002
Entry Length = 2.032 m Fully Developed Flow
Nusselt Number Nu = 2251.714899
Heat Transfer Coefficient h = 6959.04014
W/m2K
Surface Area of Pipe As = 3.19024m2
Exit Water Temperature Te = 37.8°C
Due to this, the hot water enters to the cooling tower will reduced to low temperature. So this will be satisfies the main object to reduce the inlet water temperature. According to theoretical analysis nearly 3°C will be reduced at the cooling tower inlet water.
For L/G ratio = 1
INCREASE THE AIR VELOCITY BY SPERICAL BLOCKS
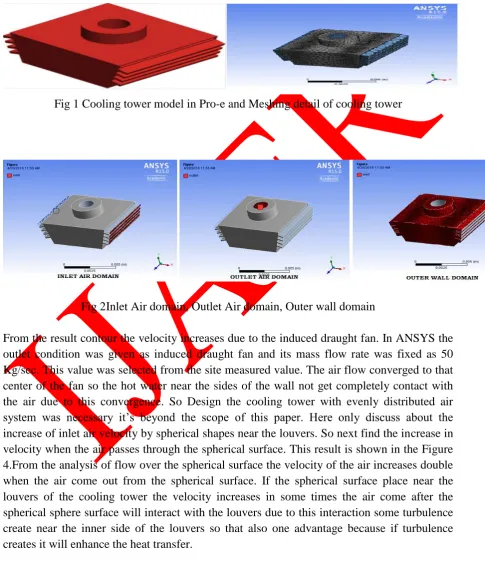
Another practical approach to reduce the outlet water temperature is to increase the air velocity at inlet this will leads to increase the L/G ratio if the L/G ratio increases the outlet water temperature decreases. To increase the air velocity place some spherical blocks inline near the cooling tower louvers this will increase the velocity may be increase the turbulence. The increase in the velocity will be measured from outlet because in DCW cooling tower it have induced fan to sucks the air. So at first using the CFD analyses to find the outlet velocity present case. Then check whether the outlet velocity increases or not for the presence of spherical blocks.
CFD ANALYSIS
define. Here there are two domain are define. Domain 1is for wall. The domain 2 is airs domain. In boundary condition the inlet air velocity3m/s, outlet air massflowrate50kg/sec, Post processor result for normal wind flow through cooling tower of ANSYS is shown in Fig 3below.
Fig 1 Cooling tower model in Pro-e and Meshing detail of cooling tower
Fig 2Inlet Air domain, Outlet Air domain, Outer wall domain
Figure 3 Normal wind flows through cooling tower, wind flow over the spherical surface
RESULTS
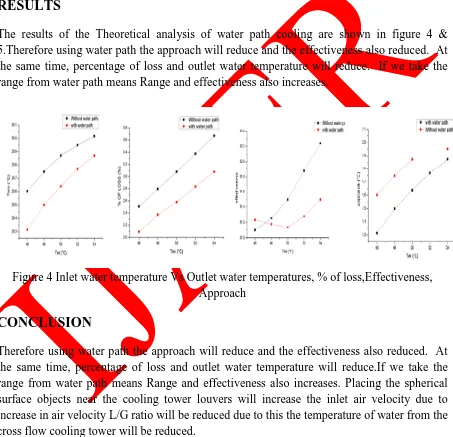
The results of the Theoretical analysis of water path cooling are shown in figure 4 & 5.Therefore using water path the approach will reduce and the effectiveness also reduced. At the same time, percentage of loss and outlet water temperature will reduce. If we take the range from water path means Range and effectiveness also increases.
Figure 4 Inlet water temperature Vs Outlet water temperatures, % of loss,Effectiveness, Approach
CONCLUSION
Therefore using water path the approach will reduce and the effectiveness also reduced. At the same time, percentage of loss and outlet water temperature will reduce.If we take the range from water path means Range and effectiveness also increases. Placing the spherical surface objects near the cooling tower louvers will increase the inlet air velocity due to increase in air velocity L/G ratio will be reduced due to this the temperature of water from the cross flow cooling tower will be reduced.
REFERENCES
[02] R. Shakeri, E. Hajidavalloo, M. A. Mehrabian,“Thermal performance of cross flow cooling towers in variable wet bulb temperature”, International Journal of Energy
Conversion and Management,vol. 51, no. 6, pp. 1298-1303, 2010.J. Clerk Maxwell, A
Treatise on Electricity and Magnetism, 3rd ed., vol. 2. Oxford: Clarendon, 1892, pp.68–73.
[03] T. Mahmud, Md. K. Islam,B.Salam, “Experimental study of forced draft cross flow wet cooling tower using splash type fill”, International conference on MechEng and Renewable Energy (ICMERE)2013.
[04] Pushpa B. S, VasantVaze, P. T. Nimbalkar, “Performance Evaluation Of Cooling
Tower In Thermal Power Plant - A Case Study Of Rtps,Karnataka”, International
Journal Of Engineering And Advanced Technology , vol.4, no.2, pp.110-114,December 2014.
[05] Kanteyya a and Kiran Kumar Rokhade, “ Performance Analysis for Natural Draught cooling tower and Chimney through Numerical Simulation” Karnataka, vol.4, Issue 3, pp.1040-1045, March 2015.
[06] H.Irtaza, S. Ahmadand T.pandey,”2D study of wind forces around multiple cooling towers using computational fluid dynamics”Aligarh , Vol.3,No.6, pp 116-134,2011. [07] Alok sing and SPS Rajput “Application of CFD in natural draft wet cooling tower
flow”Bhopal,Vol.2,Issue1,pp.1050-1056 Jan-Feb 2012.
[08] Prof.Yogeshparkthi,DilipVaghela and Jitendraprajapati”CFD analysis of Induced draught flow cooling tower “ Volume 3,Issue3,Marchpp 791-793,2013.
[09] S.ParimalaMurugaveni and P. Mohamed shameer,”Analysis of forced draught cooling
tower performance using ANSYS FLUENT software “,Coimbatore , Vol.4,Issue4,pp 217-229 Apr-2015.
[10] AnkitRameshraoThakre , AkashDipakKewate and ponraj K.Bhoyar,”Thermal and