Do International Migration and Remittances Reduce
Poverty in Developing Countries?
RICHARD H. ADAMS JR. and JOHN PAGE
*World Bank, Washington, DC, USA
Summary.—Few studies have examined the impact of international migration and remittances on poverty in the developing world. This paper fills this lacuna by constructing and analyzing a new data set on international migration, remittances, inequality, and poverty from 71 developing coun-tries. The results show that both international migration and remittances significantly reduce the level, depth, and severity of poverty in the developing world. After instrumenting for the possible endogeneity of international migration, and controlling for various factors, results suggest that, on average, a 10% increase in the share of international migrants in a country’s population will lead to a 2.1% decline in the share of people living on less than $1.00 per person per day. After instrumen-ting for the possible endogeneity of international remittances, a similar 10% increase in per capita official international remittances will lead to a 3.5% decline in the share of people living in poverty.
Ó2005 Elsevier Ltd. All rights reserved.
Key words— international migration, remittances, poverty
1. INTRODUCTION
International migration is one of the most important factors affecting economic relations between developed and developing countries in the 21st century. At the start of the century, it was estimated that about 175 million peo-ple—roughly 3% of the world population— lived and worked outside the country of their birth (United Nations, 2002). The international remittances sent back home by these migrant workers have a profound impact on the devel-oping countries of Asia, Africa, Latin America, and the Middle East. According to Global Development Finance(World Bank, 2004), offi-cial international remittances sent home by migrant workers represent the second most important source of external funding in devel-oping countries.1 Official international remit-tances now total $93 billion per year (Ratha, 2004) and are about twice as large as the level of official aid-related inflows to developing countries.2
Despite the ever-increasing size of official international remittances, very little attention has been paid to analyzing the poverty impact of these financial transfers on developing coun-tries. While a small handful of studies have
examined the impact of international remit-tances on poverty in specific village or country settings,3 we are not aware of any studies which examine the impact of international rem-sittances on poverty in a broad range of devel-oping countries.
Two factors seem to be responsible: The first is a lack of poverty data; it is quite difficult to estimate accurate and meaningful poverty headcounts in a broad and diverse range of developing countries. The second factor relates to the nature of data on international migration and remittances. Not only do few developing countries publish records on migration flows, but also many developed countries which do keep records on migration tend to undercount the large number of illegal migrants living with-in their borders. At the same time, the available data on international remittances do not
* Work on this paper was funded by a World Bank Small Research Grant (2003–04). For helpful comments on earlier drafts, we would like to thank Francois Bourguignon, Maurice Schiff, and four anonymous re-viewers. We would also like to thank Kalpana Mehra for fine research assistance. Final revision accepted: May 6, 2005.
World DevelopmentVol. 33, No. 10, pp. 1645–1669, 2005
Ó2005 Elsevier Ltd. All rights reserved Printed in Great Britain 0305-750X/$ - see front matter doi:10.1016/j.worlddev.2005.05.004
www.elsevier.com/locate/worlddev
include the large (and unknown) sum of remit-tance monies which are transmitted through informal, unofficial channels. As a result of these data problems, many key questions re-main unanswered. Exactly what is the effect of international migration on poverty in the devel-oping world? How do the official remittances sent home by international migrants affect the level, depth, and severity of poverty in the developing world?
This paper proposes to answer these, and sim-ilar, questions using a new data set composed of 71 developing countries. This data set includes all those low- and middle-income developing countries for which reasonable information on poverty, inequality, international migration, and remittances could be assembled. It includes countries drawn from each major region of the developing world: Latin America and the Carib-bean, Middle East and North Africa, Europe and Central Asia, East Asia, South Asia, and Sub-Saharan Africa.
The balance of this paper is organized as fol-lows. Section2 sets the stage by reviewing the findings of recent village- or country-level stud-ies on the relationship between international migration, remittances, inequality, and poverty. Section 3 presents the new data set and de-scribes how these data are used to calculate the relevant migration, remittances, and pov-erty variables. Section 4 uses the new data to econometrically estimate the impact of two variables—international migration and remit-tances—on poverty in the developing world. This part finds that both international migra-tion and remittances reduce the level, depth, and severity of poverty in the developing world. However, it is possible that these variables may be endogenous to poverty: that is, international migration and remittances may reduce poverty in the developing world, but poverty in the developing world may also affect the number of international migrants being produced and the level of remittances being received. For this reason, Section5employs an instrumental vari-ables strategy to isolate the overall effect of these two variables on poverty. The main instruments employed in this section are dis-tance between remitdis-tance-sending and
-receiv-ing countries, level of education, and
government stability. Using these three vari-ables as instruments, the paper finds that instrumented international migration and remittances still reduce the level, depth, and severity of poverty in developing countries. The final section of the paper, Section 6,
sum-marizes the findings and presents policy impli-cations.
2. RECENT STUDIES ON INTERNATIONAL MIGRATION, REMITTANCES, AND POVERTY There is little agreement and scant informa-tion in the literature concerning the impact of international migration and remittances on poverty.Stahl, for example, writes that ‘‘migra-tion, particularly international migra‘‘migra-tion, can be an expensive venture. Clearly, it is going to be the better-off households which will be more capable of (producing international migrants) (1982, p. 883).’’ Similarly, Lipton, in a study of 40 villages in India that focuses more on internal than international migration, found that ‘‘migration increases intra-rural inequali-ties . . .because better-off migrants are Ôpulled’ toward fairly firm prospects of a job (in a city or abroad), whereas the poor are Ôpushed’ by rural poverty and labor-replacing methods (1980, p. 227).’’
Other analysts, however, suggest that the poor can and do benefit from international migration and remittances. For example,Stark and Taylorfind that in rural Mexico ‘‘relatively deprived’’ households are more likely to engage in international migration than are ‘‘better-off’’ households (1989, pp. 12–14). In a similar vein,
Adamsfinds that in rural Egypt, the number of poor households declines by 9.8% when house-hold income includes international remittances, and that remittances account for 14.7% of total income of poor households (1991, pp. 73–74).
While the findings of these past studies are instructive, their conclusions are of limited use-fulness due to a small sample size. For instance, the findings of Stark and Taylor are based on 61 households from two Mexican villages while those of Adams are based on 1,000 households from three Egyptian villages. Clearly, there is a need to extend the scope of these studies to see if their findings hold for a larger and broader collection of developing countries.
3. NEW DATA ON INTERNATIONAL MIGRATION, REMITTANCES, INEQUALITY, AND POVERTY Our evaluation of the impact of international migration and remittances on poverty in devel-oping countries is based on a new data set that
includes information on international migra-tion, remittances, inequality, and poverty for 71 ‘‘low-income and middle-income’’ develop-ing countries.4 These countries were selected because it was possible to find relevant migra-tion, remittances, inequality, and poverty data for all of these countries since the year 1980.5 Since it was not easy to assemble this data set, and data problems still plague this (and all other) studies on international migration and remittances, it is useful to spell out how this information was assembled.
In the case of migration, few, if any, of the major labor-exporting countries publish accu-rate records on the number of international mi-grants that they produce. It is therefore necessary to estimate migration stocks and flows by using data collected by the main labor-receiving countries. For the purposes of this paper, the main labor-receiving countries (re-gions) include two: United States and the Organization for Economic Cooperation and Development (OECD) (Europe), excluding North America and Asia.6 Unfortunately, no data are available on the amount of migration to the third and fourth most important labor-receiving regions in the world, the Arab Gulf and South Africa.
Because of their importance to labor-export-ing countries, remittance flows tend to be the best measured aspect of the migration experi-ence. For instance, the International Monetary Fund (IMF) keeps annual records of the amount of worker remittances received by each labor-exporting country.7 However, as noted above, the IMF only reports data on official
worker remittance flows, that is, remittance monies which are transmitted through official banking channels. Since a large (and unknown) proportion of remittance monies is transmitted through private, unrecorded channels, the level of remittances recorded by the IMF underesti-mates the actual flow of remittance monies returning to labor-exporting countries.
Finally, with respect to poverty, many devel-oping countries—especially the smaller popula-tion countries—have not conducted the type of nationally representative household budget sur-veys that are needed to estimate poverty. For example, of the 157 developing countries classi-fied as low- or middle-income by the World Bank,8only 81 countries (52%) have published the results of any household budget survey. Of these 81 developing countries, missing data on income inequality reduced the size of the data set used in this paper to 71 countries.9
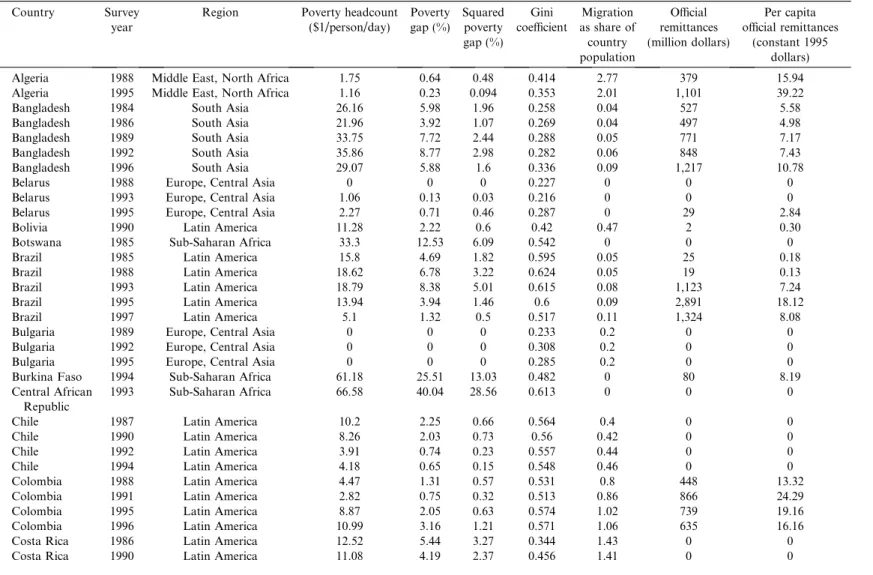
Table 9gives the countries, regions, poverty, inequality, migration, and remittances indica-tors included in the new data set. The data set includes a total of 184 observations; an obser-vation is any point in time for which data on in-come, poverty and inequality exist. The data set is notable in that it includes 36 observations (from 18 countries) in Sub-Saharan Africa, a region for which migration, remittances and poverty data are relatively rare. It also includes observations from countries in all other regions of the developing world.
Table 9 reports three different poverty mea-sures: The first, the poverty headcount index, set at $1 per person per day, measures the per-cent of the population living beneath that pov-erty line at the time of the survey.10However, the headcount index ignores the ‘‘depth of pov-erty,’’ that is, the amount by which the average expenditures (income) of the poor fall short of the poverty line. 11 We therefore also report the poverty gap index, which measures in per-centage terms how far the average expenditures (income) of the poor fall short of the poverty line. For instance, a poverty gap of 10% means that the average poor person’s expenditures (in-come) are 90% of the poverty line. The third poverty measure—the squared poverty gap index—indicates the severity of poverty. The squared poverty gap index possesses useful ana-lytical properties, because it is sensitive to changes in distribution among the poor.12
To measure inequality,Table 9uses the Gini coefficient. In the table, this measure is normal-ized by household size and the distributions are weighted by household size so that a given quintile (such as the lowest quintile) has the same share of population as other quintiles across the sample.
The remaining variables inTable 9 —interna-tional migration as share of country population and per capita official international remit-tances—are of key importance to this study. Since these two variables must be estimated using some rather heroic assumptions, it is cru-cial to discuss each variable in turn.
In the absence of detailed records on interna-tional migration in the labor-exporting coun-tries, the migration variable in this study is estimated by combining data from the two main labor-receiving regions of the world: the United States and OECD (Europe). Specifi-cally, the migration variable is constructed using three steps. The first step uses data from the 1990 and 2000 US Population Censuses
on the ‘‘place of birth for the foreign-born
population.’’ While these data are disaggre-gated by country of birth for about 50 different labor-exporting countries, it is not at all clear whether all of these ‘‘foreign-born’’ people are, in fact international migrants. For exam-ple, a person born in Mexico and brought to the United States as an infant would probably not consider himself as a migrant. Moreover, it is also not clear how many of those who enter the United States illegally are, in fact, included in the ‘‘foreign-born’’ population figures. As some observers have suggested, the US Census data may be grossly undercounting the actual migrant population that is living—legally or illegally—in the United States.13
The second step in calculating the migration variable is to estimate the number of ‘‘for-eign-born’’ living in the OECD (Europe), excluding North America and Asia.14 Unfor-tunately, the OECD (Europe) data are not as detailed as the US Census data, and differ from the US data in several key ways. Most basi-cally, the OECD (Europe) data use a different way of classifying immigrants. Since US-born children of immigrants have US citizenship, the United States defines an immigrant as a person who was born abroad to non-US citi-zens. Most OECD (Europe) countries, how-ever, follow an ethnicity-based definition of immigration status. This method classifies a person on the basis of the ethnicity of the par-ent, rather than on place of birth. Thus, a child of Turkish parents born in Germany is typically classified as an immigrant. This different way of classifying immigrants has the net effect of increasing the stock of immigrants in any par-ticular OECD (Europe) country, and perhaps biasing our estimates by including a number of ‘‘migrants’’ who were actually born, raised, and educated in that OECD (Europe) country. Another key difference between the OECD (Europe) data and the US data has to do with the number of labor-exporting countries re-corded. While the US Census data can be used to count the number of ‘‘foreign-born’’ (or mi-grants) from about 50 different countries, the OECD (Europe) data only record the number of ‘‘foreign-born’’ (or migrants) in each Euro-pean country coming from 10 or 15 countries. While this is not a significant problem for large-labor-exporting countries (like Turkey), which send many migrants to Europe, it is a problem for smaller labor-exporting countries, such as Brazil or Sri Lanka, where the actual number of migrants to any particular European country might not be recorded at all.
The final step in calculating the migration variable is to take the sum of the ‘‘foreign born’’ from each labor-exporting country that are living in either the United States or the OECD (Europe), and divide this sum by the population of each developing country. These ‘‘migration as share of country population’’ fig-ures are the ones which appear inTable 9. In all likelihood, these figures seriously underestimate the actual number of international migrants produced by any given labor-exporting coun-try, because they do not include the large num-ber of illegal migrants working in the United States and OECD (Europe). These figures also do not count the unknown number of interna-tional migrants working in other labor-receiv-ing regions (like the Arab Gulf).
The process of defining the remittances vari-able inTable 9is more straightforward, but it also involves one heroic assumption. All remit-tance data come from the IMF,Balance of Pay-ments Statistics Yearbook. As noted above, the main problem with these data is that they count only remittance monies which enter through official, banking channels; they do not include the large (and unknown) amount of remittance monies which are sent home through private, unofficial channels. For example, in one major labor-exporting country—Egypt—it has been estimated that unofficial remittances amount to between one-third and one-half of total remittances.15For this reason, it is likely that the ‘‘official remittance’’ figures reported in
Table 9are gross underestimates of the actual level of total remittances (official and unofficial) entering each labor-exporting country.
4. INTERNATIONAL MIGRATION, REMITTANCES, AND POVERTY:
OLS RESULTS
In this section, we use the crosscountry data to analyze how international migration and remittances affect poverty in the developing world. Using the basic growth–poverty model suggested by Ravallion (1997) and Ravallion and Chen (1997), the relationship that we want to estimate can be written as
logPit ¼aiþb1loglitþb2logðgitÞ
þb3logðxitÞ þit
ði¼1;. . .;N; t¼1;. . .;TiÞ; ð1Þ
wherePis the measure of poverty in countryi
at timet,aiis a fixed effect reflecting time
ences between countries,b1is the ‘‘growth elas-ticity of poverty’’ with respect to mean per ca-pita income given by l, b2 is the elasticity of
poverty with respect to income inequality given by the Gini coefficient,g,b3is the elasticity of
poverty with respect to variable x (such as international migration or remittances) and is an error term that includes errors in the pov-erty measure.
Eqn.(1)represents the basic model of poverty determination used by a host of researchers.16 The model assumes that economic growth—as measured by increases in mean per capita in-come—will reduce poverty. The relationship be-tween poverty and the income variable is therefore expected to be negative and signifi-cant. The model also assumes that the level of income inequality affects poverty reduction. Since past work has shown that a given rate of economic growth reduces poverty more in low-inequality countries, as opposed to high-inequality countries,17 the income inequality variable is expected to be positive and signifi-cant. The innovation in this study is to intro-duce into Eqn. (1) a variable measuring the level of international migration or remittances. Controlling for income and its distribution, we test the hypothesis that countries producing more international migrants or receiving more international remittances will have less poverty. The income variable in Eqn.(1)can be mea-sured in two different ways: (1) per capita GDP, in purchasing power parity (PPP) units, as mea-sured from national accounts data; and (2) per capita survey mean income (expenditure), as calculated from household budget surveys done in the various developing countries. AsDeaton (2001) and others have shown,18 these two measures of income typically do not agree. In-come (expenditure) as measured by household surveys is calculated from the responses of indi-vidual households. However, income as mea-sured by GDP data comes from the national accounts, which measure household income as a residual item, so that errors and omission elsewhere in the accounts automatically affect the calculation of household income (expendi-ture). Since the national accounts data also in-clude many items (such as the expenditures of nonprofit organizations and the imputed rent of owner-occupied dwellings) which are not in-cluded in the household surveys, it is little won-der that the two measures of income do not correspond.
For the purposes of this study, we will esti-mate Eqn.(1)using both measures of income.
It should be noted that neither measure of in-come includes international remittance inin-come. The GDP data from national accounts should not include remittance income from abroad, and our experience with household budget sur-veys suggests that most of these sursur-veys do not adequately capture international remittance in-come because they do not include questions on remittances.19
Other researchers have often estimated Eqn.
(1)in first differences, in order to deal with pos-sible correlation problems between the vari-ables, since the dependent and independent variables are drawn from the same single source of data (household budget surveys).20In this study, however, we will estimate Eqn.(1)as a level equation since the dependent and indepen-dent variables come from different sources of data: the dependent variable being drawn from household budget surveys and the independent variables (for GDP, international migration, and international remittances) from various other sources.21
We will also estimate Eqn. (1) using the two measures of international migration and remittances developed in the last section: inter-national migration as a share of country popu-lation and per capita official international remittances received by a developing country. Given all of the problems involved in construct-ing these two variables, as well as the fact that a number of the countries still have missing/ incomplete migration or remittance data, it is not surprising that these two measures are not highly correlated in the data set (simple correla-tion of 0.579). Moreover, it is likely that a size-able share of international migrants may migrate, but not remit. For all of these reasons, it seems useful to use each of these measures to test the robustness of our findings regarding the impact of international migration and remit-tances on poverty in the developing world.
Using the international migration data, the OLS estimates of Eqn. (1) are presented in
Tables 1 (using per capita GDP) and 2(using survey mean income). To control for fixed effects by geographic region of the world, five regional dummy variables are added to the model.22In each table, results are shown first without, and then with, regional dummies. Since all of the variables are estimated in log terms, the results can be interpreted as elasticities of poverty with respect to the relevant variable.
InTables 1 and 2, the coefficients for both of the income variables—per capita GDP and
sur-vey mean income—are of the expected
Table 1. OLS estimates of the effects of international migration on poverty, estimated using per capita GDP
Variable Dependent variable = poverty headcount ($1.08/person/day)
Dependent variable = poverty gap Dependent variable = squared poverty gap
(1) (2) (3) (4) (5) (6)
Per capita GDP (constant 1995 dollars) 1.177 (8.84)**
1.003 (6.48)**
1.343 (8.82)**
1.295 (6.43)**
1.417 (7.51)**
1.399 (5.72)** Gini coefficient 3.396 (6.88)** 2.502 (4.90)** 4.170 (7.39)** 3.195 (4.81)** 4.600 (6.93)** 2.926 (3.61)** International migration (share of
migrants
in country population)
0.155 (2.49)**
0.085 (1.52) 0.120 (1.68) 0.101 (1.38) 0.023 (0.27) 0.015 (0.17)
East Asia 0.402 (0.98) 0.109 (0.20) 0.496 (0.76)
Europe, Central Asia 0.959 (1.87) 0.459 (0.69) 0.356 (0.44)
Latin America 0.257 (0.59) 0.581 (1.02) 0.677 (0.97)
Middle East, North Africa 1.691 (3.65)** 1.291 (2.14)* 1.638 (2.18)*
South Asia 0.468 (1.33) 0.347 (0.76) 0.180 (0.29)
Constant 13.550 (10.94)** 11.556 (10.18)** 14.089 (9.96)** 12.733 (8.63)** 14.022 (8.03)** 12.416 (6.81)**
N 109 108 109 108 100 100
AdjR2 0.493 0.694 0.481 0.594 0.399 0.504
F-statistic 36.11 31.39 34.41 20.59 22.91 13.59
Notes: All variables expressed in logs.T-ratios shown in parentheses. Number of observations reduced in the table because of missing values. SeeTable 9for countries and survey dates.
*
Significant at the 0.10 level.
**Significant at the 0.05 level.
1650
WORLD
DEVELO
Table 2. OLS estimates of the effect of international migration on poverty, estimated using survey mean income
Variable Dependent variable = poverty headcount
Dependent variable = poverty gap Dependent variable = squared poverty gap
(1) (2) (3) (4) (5) (6)
Per capita survey mean income 2.336 (16.85)**
1.942 (12.00)**
2.623 (15.24)**
2.437 (11.89)**
2.659 (11.49)**
2.699 (10.19)** Gini coefficient 4.025 (12.08)** 3.060 (7.68)** 4.798 (11.60)** 3.678 (7.30)** 5.002 (9.29)** 3.675 (5.64)** International migration (share of
migrants in country population)
0.188 (4.48)**
0.136 (3.12)**
0.153 (2.93)**
0.143 (2.59)*
0.048 (0.69) 0.086 (1.19)
East Asia 0.423 (1.50) 0.962 (2.69)**
1.609 (3.53)**
Europe, Central Asia 1.046 (2.98) 0.674 (1.52) 0.445 (0.78)
Latin America 0.147 (0.50) 0.037 (0.10) 0.157 (0.33)
Middle East, North Africa 1.322 (3.77)**
1.268 (2.86)**
1.191 (2.08)*
South Asia 0.054 (0.20) 0.344 (0.99) 0.775 (1.61)
Constant 22.530 (19.09)** 19.214 (15.30)** 23.915 (16.32)** 21.943 (13.81)** 23.436 (11.98)** 22.960 (11.17)**
N 106 106 106 106 100 100
AdjR2 0.766 0.817 0.722 0.773 0.598 0.685
F-statistic 116.09 59.71 92.00 45.89 50.11 27.93
Notes: All variables expressed in logs.T-ratios shown in parentheses. Number of observations reduced in table because of missing values. SeeTable 9for countries and survey dates.
*
Significant at the 0.10 level.
**Significant at the 0.05 level.
INTERNAT
IONAL
MIGRATIO
N
AND
REMIT
TANCES
(negative) sign and statistically significant in all cases. In both tables, the poverty elasticities with respect to income inequality (Gini coeffi-cient) are also of the expected (positive) sign, and their magnitude is consistent with other re-cent analyses of poverty reduction (Adams, 2004; Ravallion, 1997). However, the results for the model as a whole are better and more precise in Table 2 using survey mean income: theR2measures increase from the 0.4–0.7 range to 0.6–0.8. For this reason, we will focus on
Table 2.
When the dependent variable in Table 2 is poverty headcount or poverty gap, the results for the international migration variable are negative and statistically significant. However, when the dependent variable is squared poverty gap, the international migration variable is not significant. For the poverty headcount mea-sure, the estimates suggest that, on average, a 10% increase in the share of international mi-grants in a country’s population will lead to a 1.4% decline in the share of people living on less than $1.00 per person per day.
Tables 3(using per capita GDP) and4(using survey mean income) show the results when Eqn.(1)is estimated using international remit-tances data. Since the results for the model are better and more precise inTable 4using survey mean income, we will focus on these results.
The remittance variable inTable 4—per capita official international remittances—has a nega-tive and statistically significant impact on each of the three poverty measures: headcount, pov-erty gap, and squared povpov-erty gap. Estimates for the poverty headcount measure suggest that, on average, a 10% increase in per capita official international remittances will lead to a 1.8% decline in the share of people living in poverty. Table 4 shows that remittances will have a slightly larger impact on poverty reduc-tion when poverty is measured by the more sen-sitive poverty measures: poverty gap and squared poverty gap.
5. OFFICIAL INTERNATIONAL REMITTANCES AND POVERTY:
IV RESULTS
As noted at the outset, one possible problem with Eqn.(1)is that it assumes that all of the right-hand side variables in the model—includ-ing international migration and remittances— are exogenous to poverty. However, it is possible that these two variables may be
endo-genous to poverty. Reverse causality may be taking place: international migration and remittances may be reducing poverty, but pov-erty may also be affecting the share of migrants being produced and the level of international remittances being received. Without accounting for this reverse causality, all of the estimated coefficients inTables 1–4may be biased.
One way of accounting for possible endoge-nous regressors is to pursue an instrumental variables approach. This is the strategy adopted in this section.
In our data set, there are three possible instruments for the international migration and remittances variables. The first instrument is distance (miles) between the remittance-send-ing area (United States, OECD (Europe), or the Persian Gulf) and the remittance-receiving country.23 This variable seems like a good instrument because various studies of the deter-minants of international migration have found that distance between labor-receiving and— exporting countries is usually negatively and significantly related to the level of international migration. For example, in a study of migration rates to the United States from 81 developing countries, Hatton and Williamson (2003, p. 11) find that distance from the United States is negatively and significantly related to the level of international migration from that country.24 A second instrument for the international migration and remittances vari-ables is education, specifically, the percent of the population over age 25 that have completed secondary education in a developing country. This variable seems useful because human cap-ital theory generally suggests that education is positively related with international migration (and presumably international remittances) be-cause educated people typically enjoy greater employment and income-earning opportunities in labor-receiving countries.25While new emerg-ing research suggests that international mi-grants may not always be positively selected with respect to education,26education still seems to play an important role in the decision to mi-grate. The final instrument that can be used is government stability,27which is a measure of the level of political stability in each country. The expected outcome of this variable is not straightforward. Holding other factors con-stant, we would expect that countries with more unstable governments would produce larger numbers of international migrants. However, whether or not these increased numbers of migrants will produce larger levels of
Table 3. OLS estimates of the effects of official international remittances on poverty, estimated using per capita GDP
Variable Dependent variable = poverty headcount ($1.08/person/day)
Dependent variable = poverty gap Dependent variable = squared poverty gap
(1) (2) (3) (4) (5) (6)
Per capita GDP (constant 1995 dollars) 1.129 (7.78)**
0.852 (6.19)**
1.273 (7.80)**
0.961 (5.27)**
1.228 (6.43)**
0.929 (4.22)** Gini coefficient 2.959 (5.48)** 1.882 (3.91)** 4.266 (7.02)** 3.184 (5.00)** 4.786 (7.33)** 3.271 (4.44)** Per capita official international
remittances
0.119 (1.98)* 0.077 (1.70)* 0.208 (3.09)** 0.209 (3.45)** 0.215 (2.82)** 0.164 (2.02)**
East Asia 0.065 (0.19) 0.306 (0.68) 0.991 (1.95)*
Europe, Central Asia 1.928 (5.29)** 2.198 (4.55)** 1.826 (3.30)**
Latin America 0.147 (0.47) 0.128 (0.31) 0.314 (0.65)
Middle East, North Africa 2.099 (6.23)** 1.748 (3.92)** 2.101 (3.69)**
South Asia 0.077 (0.26) 0.165 (0.42) 0.384 (0.78)
Constant 13.059 (10.08)** 10.575 (10.55)** 14.095 (9.67)** 11.437 (8.61)** 13.365 (8.01)** 10.567 (6.51)**
N 100 99 100 99 89 89
AdjR2 0.427 0.744 0.480 0.679 0.484 0.606
F-statistic 25.66 36.70 31.49 26.89 28.58 17.92
Notes: All variables expressed in logs.T-ratios shown in parentheses. Number of observations reduced in the table because of missing values. SeeTable 9for countries and survey dates.
*
Significant at the 0.10 level.
**Significant at the 0.05 level.
INTERNAT
IONAL
MIGRATIO
N
AND
REMIT
TANCES
Table 4. OLS estimates of the effect of official international remittances on poverty, estimated using survey mean income
Variable Dependent variable = poverty headcount ($1.08/person/day)
Dependent variable = poverty gap Dependent variable = squared poverty gap
(1) (2) (3) (4) (5) (6)
Per capita survey mean income 2.242 (15.48)**
1.605 (10.47)**
2.593 (14.29)**
2.005 (9.16)**
2.394 (11.74)**
2.059 (8.44)** Gini coefficient 3.646 (10.42)** 2.752 (7.34)** 5.029 (11.47)** 4.095 (7.66)** 5.361 (11.23)** 4.398 (7.29)** Per capita official international
remittances
0.163 (3.88)**
0.176 (4.48)**
0.181 (3.44)**
0.208 (3.70)**
0.212 (3.75)**
0.214 (3.40)**
East Asia 0.126 (0.52) 0.549 (1.59) 1.152 (3.03)**
Europe, Central Asia 1.337 (4.69)** 1.365 (3.36)** 0.893 (1.96)*
Latin America 0.044 (0.20) 0.052 (0.16) 0.094 (0.26)
Middle East, North Africa 1.180 (3.83)** 1.091 (2.49)** 1.102 (2.25)*
South Asia 0.348 (1.54) 0.269 (0.84) 0.079 (0.20)
Constant 16.355 (19.05)** 12.863 (15.86)** 17.896 (16.64)** 14.672 (12.69)** 16.461 (13.77)** 14.446 (11.10)**
N 95 95 95 95 88 88
AdjR2 0.762 0.857 0.739 0.797 0.711 0.758
F-statistic 101.25 71.64 89.69 47.25 72.24 35.07
Notes: All variables expressed in logs.T-ratios shown in parentheses. Number of observations reduced in the table because of missing values. SeeTable 9for countries and survey dates.
*
Significant at the 0.10 level.
**Significant at the 0.05 level.
1654
WORLD
DEVELO
tances would depend on the extent to which political instability affects the incentives of mi-grants to remit. Since mimi-grants remit for both altruistic and economic reasons, the net impact of political instability—probably positive for altruistic motives, as migrants seek to cushion their relatives from instability, and probably negative for economic motives to the extent that political instability undermines the invest-ment climate—is ambiguous.
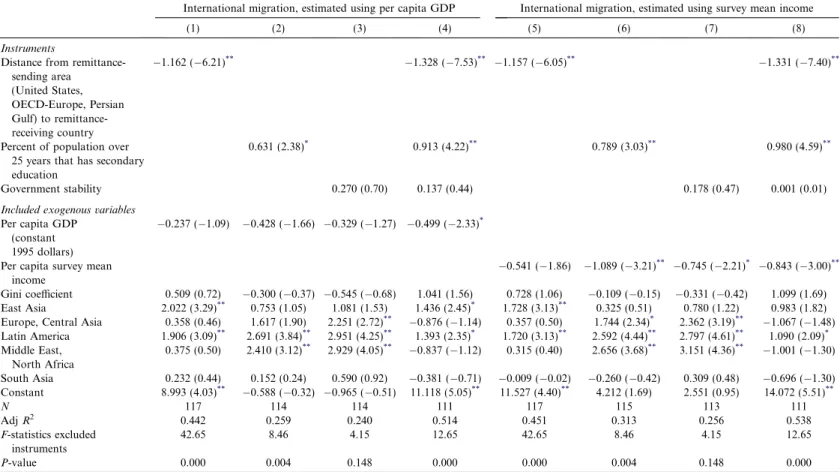
Tables 5 and 6 present the first-stage instru-mental variables regression results when vari-ous combinations of these variables are used to instrument international migration and remittances, respectively. In each table, Eqns. (1)–(4) present the results when the exogenous variables include per capita GDP, and Eqns. (5)–(8) present the results when the exogenous variables include survey mean income.
In both tables, the IV equations containing only the distance variable are arguably the most exogenous and have the single highest predictive power (R2from 0.44 to 0.48). As expected, the distance variable is always negative and highly significant, suggesting that as the distance between remittance-sending and -receiving countries increases, the level of international migration and remittances received falls. When instrumenting for international migration (Table 5), the education variable is positive and highly significant. As hypothesized, this implies that countries with a higher share of educated people also produce more international migrants. The other variable—government stability—is statistically insignificant in both tables, and therefore subject to weak instrument concerns. However, when all three variables are combined together—Eqns. (4) and (8) inTables 5 and 6—thep-values for theF-statistic of the excluded instruments are all less than 0.01 for the prediction of international migration and remittances, while the F-statistics themselves are over 8. When using all three variables as instruments, international migration is pre-dicted somewhat better than official interna-tional remittances, but the F-statistics still show instrument relevance.
Tables 7 and 8 present the second-stage IV results when the international migration and remittance variables are instrumented by all three variables: distance, education, and gov-ernment stability.Table 7shows the IV results for international migration andTable 8shows results for international remittances. Both of these tables are based on survey mean income; results based upon per capita GDP are
simi-lar and available from the authors upon re-quest.
Comparing the OLS and IV estimates for international migration (Tables 2 and 7), we find that the coefficients for the instrumented inter-national migration variable inTable 7are more negative and of greater significance. Comparing the OLS and IV estimates for official interna-tional remittances (Tables 4 and 8) yields similar results. For example, while the IV estimates for the poverty headcount measure suggest that, on average, a 10% increase in per capita official remittances will lead to a 3.5% decline in the share of people living in poverty (Table 8), the OLS estimates suggest that a similar increase in official remittances will lead to only a 1.8% de-cline in the share of poor people (Table 4).
Considered as a whole, the IV results suggest that after instrumenting for the possible endo-geneity of international migration and remit-tances, these two variables still have a negative and statistically significant impact upon pov-erty. Instrumented international migration has a negative and significant impact on two of the three poverty measures (Table 7), while instrumented official international remittances has a negative and significant impact on all three of the poverty measures (Table 8).
InTable 8, the relative magnitudes of the elas-ticity estimates on survey mean income and instrumented official international remittances imply that an increase in international remit-tances has about twice the poverty-reducing im-pact as an increase in other sources of household income. Evaluated at the sample mean, an increase in $1 in instrumented per ca-pita official international remittances (from $17.15 to $18.15) will lead to a 2.04% reduction in the poverty headcount. By comparison, at the sample mean, a $1 increase in per capita survey mean income (from $1,628.60 to $1,629.60) will yield a 0.98% reduction in the poverty head-count.28In other words, dollar for dollar the income remitted by migrants from abroad re-duces poverty much more than income gener-ated by domestic economic activity.
6. CONCLUSIONS AND POLICY IMPLICATIONS
This paper has used a new data set on interna-tional migration, remittances, inequality, and poverty from 71 developing countries to exam-ine the impact of international migration, and remittances on poverty in the developing world.
Table 5.First-stage IV estimates for international migration
International migration, estimated using per capita GDP International migration, estimated using survey mean income
(1) (2) (3) (4) (5) (6) (7) (8)
Instruments
Distance from remittance-sending area
(United States, OECD-Europe, Persian Gulf) to remittance-receiving country
1.162 (6.21)** 1.328 (7.53)** 1.157 (6.05)** 1.331 (7.40)**
Percent of population over 25 years that has secondary education
0.631 (2.38)* 0.913 (4.22)** 0.789 (3.03)** 0.980 (4.59)**
Government stability 0.270 (0.70) 0.137 (0.44) 0.178 (0.47) 0.001 (0.01)
Included exogenous variables
Per capita GDP (constant 1995 dollars)
0.237 (1.09) 0.428 (1.66) 0.329 (1.27) 0.499 (2.33)*
Per capita survey mean income
0.541 (1.86) 1.089 (3.21)** 0.745 (2.21)* 0.843 (3.00)** Gini coefficient 0.509 (0.72) 0.300 (0.37) 0.545 (0.68) 1.041 (1.56) 0.728 (1.06) 0.109 (0.15) 0.331 (0.42) 1.099 (1.69) East Asia 2.022 (3.29)** 0.753 (1.05) 1.081 (1.53) 1.436 (2.45)* 1.728 (3.13)** 0.325 (0.51) 0.780 (1.22) 0.983 (1.82) Europe, Central Asia 0.358 (0.46) 1.617 (1.90) 2.251 (2.72)** 0.876 (1.14) 0.357 (0.50) 1.744 (2.34)* 2.362 (3.19)** 1.067 (1.48) Latin America 1.906 (3.09)** 2.691 (3.84)** 2.951 (4.25)** 1.393 (2.35)* 1.720 (3.13)** 2.592 (4.44)** 2.797 (4.61)** 1.090 (2.09)* Middle East,
North Africa
0.375 (0.50) 2.410 (3.12)** 2.929 (4.05)** 0.837 (1.12) 0.315 (0.40) 2.656 (3.68)** 3.151 (4.36)** 1.001 (1.30) South Asia 0.232 (0.44) 0.152 (0.24) 0.590 (0.92) 0.381 (0.71) 0.009 (0.02) 0.260 (0.42) 0.309 (0.48) 0.696 (1.30) Constant 8.993 (4.03)** 0.588 (0.32) 0.965 (0.51) 11.118 (5.05)** 11.527 (4.40)** 4.212 (1.69) 2.551 (0.95) 14.072 (5.51)**
N 117 114 114 111 117 115 113 111
AdjR2 0.442 0.259 0.240 0.514 0.451 0.313 0.256 0.538
F-statistics excluded instruments
42.65 8.46 4.15 12.65 42.65 8.46 4.15 12.65
P-value 0.000 0.004 0.148 0.000 0.000 0.004 0.148 0.000
Notes: All variables expressed in logs.T-ratios shown in parentheses. Number of observations reduced in the table because of missing values. SeeTable 9for countries and survey dates.
*
Significant at the 0.10 level.
**
Significant at the 0.05 level.
1656
WORLD
DEVELO
Table 6.First-stage IV estimates for official international remittances
Per capita international remittances, estimated using per capita GDP
Per capita international remittances, estimated using survey mean income
(1) (2) (3) (4) (5) (6) (7) (8)
Instruments
Distance from remittance-sending area (United States,
OECD-Europe, Persian Gulf) to remittance-receiving country
1.565 (6.24)** 1.929 (6.25)** 1.191 (4.71)** 1.271 (4.01)**
Percent of population over 25 years that has secondary education
0.232 (0.58) 0.694 (1.95)* 0.071 (0.20) 0.276 (0.76)
Government stability 0.611 (1.12) 0.328 (0.69) 0.414 (0.87) 0.504 (1.10)
Included exogenous variables
Per capita GDP (constant 1995 dollars)
0.505 (1.93) 0.773 (1.74) 0.141 (0.38) 1.358 (3.26)**
Per capita survey mean income 0.440 (1.19) 0.145 (0.31) 0.122 (0.28) 0.611 (1.33)
Gini coefficient 1.272 (1.34) 0.593 (0.46) 0.552 (0.43) 0.264 (0.23) 1.124 (1.22) 0.694 (0.61) 0.994 (0.88) 1.221 (1.13)
East Asia 2.143 (2.97)** 0.660 (0.65) 0.587 (0.66) 3.084 (3.21)** 2.165 (3.29)** 0.763 (0.85) 0.930 (1.31) 2.789 (2.86)**
Europe, Central Asia 2.000 (2.76)** 0.392 (0.33) 0.205 (0.17) 3.164 (2.61)* 1.354 (1.86) 0.210 (0.21) 0.631 (0.66) 1.107 (1.03)
Latin America 0.084 (0.13) 1.528 (1.80) 1.687 (2.05)* 0.303 (0.36) 0.867 (1.54) 1.872 (2.70) 1.923 (3.03)** 1.053 (1.46)
Middle East, North Africa 0.864 (1.05) 2.504 (2.51)* 2.813 (3.35)** 1.742 (1.54) 0.651 (0.72) 3.745 (4.25)** 3.733 (4.64)** 0.873 (0.77)
South Asia 1.378 (2.46)* 1.957 (2.30)* 1.852 (2.31)* 2.054 (2.60)* 1.566 (2.95)** 1.740 (2.35)* 2.150 (3.09)** 2.173 (2.79)**
Constant 10.914 (3.91)** 4.645 (1.42) 0.791 (0.28) 7.598 (2.17)* 7.871 (2.37)* 0.040 (0.01) 0.228 (0.07) 6.713 (1.64)
N 101 91 91 84 97 90 87 83
AdjR2 0.463 0.193 0.177 0.436 0.478 0.305 0.303 0.397
F-statistics excluded instruments 39.42 4.92 4.23 8.90 39.42 4.92 4.23 8.90
P-value 0.000 0.069 0.047 0.000 0.000 0.069 0.047 0.000
Notes: All variables expressed in logs.T-ratios shown in parentheses. Number of observations reduced in the table because of missing values. SeeTable 9for countries and survey dates.
*
Significant at the 0.10 level.
**
Significant at the 0.05 level.
INTERNAT
IONAL
MIGRATIO
N
AND
REMIT
TANCES
Table 7. IV estimates of the effect of international migration on poverty, estimated using survey mean income
Variable Dependent variable = poverty headcount ($1.08/person/day)
Dependent variable = poverty gap Dependent variable = squared poverty gap
(1) (2) (3) (4) (5) (6)
Instrumented endogenous variable
International migration (share of migrants in country population)
0.337 (4.78)** 0.211 (3.06)** 0.230 (2.78)** 0.197 (2.30)* 0.059 (0.56) 0.136 (1.27)
Exogenous regressors
Per capita survey mean income 2.193 (14.56)**
1.956 (11.66)**
2.498 (14.07)**
2.422 (11.58)**
2.575 (10.93)**
2.681 (9.91)** Gini coefficient 3.989 (11.30)** 3.001 (7.45)** 4.723 (11.36)** 3.595 (7.16)** 4.916 (9.09)** 3.583 (5.53)**
East Asia 0.402 (1.36) 1.008 (2.73)**
1.693 (3.60)** Europe, Central Asia 0.926 (2.43)*
0.668 (1.40) 0.485 (0.80)
Latin America 0.012 (0.04) 0.097 (0.23) 0.180 (0.34)
Middle East, North Africa 1.022 (2.57)** 1.115 (2.24)* 1.167 (1.83)
South Asia 0.059 (0.20) 0.415 (1.14) 0.853 (1.70)
Constant 21.448 (16.91)** 19.142 (15.01)** 22.95 (15.36)** 21.739 (13.67)** 22.773 (11.51)** 22.788 (11.06)**
N 101 101 101 101 96 96
AdjR2 0.726 0.802 0.708 0.764 0.589 0.680
F-statistic 96.33 52.33 83.12 41.53 46.38 23.33
Notes: All variables expressed in logs.T-ratios shown in parentheses. Number of observations reduced in the table because of missing values. SeeTable 9for countries and survey dates.
*
Significant at the 0.10 level.
**Significant at the 0.05 level.
1658
WORLD
DEVELO
Table 8. IV estimates of the effects of official international remittances on poverty, estimated using survey mean income
Variable Dependent variable = poverty headcount ($1.08/person/day)
Dependent variable = poverty gap Dependent variable = squared poverty gap
(1) (2) (3) (4) (5) (6)
Instrumented endogenous variable
Per capita official international remittances 0.464 (4.70)**
0.351 (3.55)**
0.421 (3.68)**
0.396 (2.91)**
0.247 (2.31)*
0.283 (2.24)*
Exogenous regressors
Per capita survey mean income 2.00 (9.87)** 1.590 (9.12)** 2.415 (10.31)** 1.986 (8.26)** 2.322 (9.42)** 2.072 (8.32)** Gini coefficient 3.610 (8.14)** 2.950 (6.60)** 5.094 (9.93)** 4.407 (7.15)** 5.351 (10.26)** 4.700 (7.25)**
East Asia 0.230 (0.76) 0.688 (1.65) 1.373 (3.25)**
Europe, Central Asia 1.608 (4.01)** 1.790 (3.23)** 0.929 (1.51)
Latin America 0.021 (0.07) 0.038 (0.09) 0.303 (0.68)
Middle East, North Africa 0.614 (1.24) 0.533 (0.78) 1.026 (1.54)
South Asia 0.443 (1.28) 0.363 (0.76) 0.145 (0.28)
Constant 20.965 (12.79)** 17.271 (12.39)** 23.770 (12.53)** 20.214 (10.51)** 22.041 (11.05)** 20.264 (10.07)**
N 81 81 81 81 75 75
AdjR2 0.642 0.811 0.674 0.756 0.688 0.744
F-statistic 60.26 46.06 60.67 33.11 51.43 27.06
Notes: All variables expressed in logs.T-ratios shown in parentheses. Number of observations reduced in the table because of missing values. SeeTable 9for countries and survey dates.
*Significant at the 0.10 level. **
Significant at the 0.05 level.
INTERNAT
IONAL
MIGRATIO
N
AND
REMIT
TANCES
Three findings and two policy implications emerge.
First, both international migration and remit-tances have a strong, statistically significant im-pact on reducing poverty in the developing world. After instrumenting for the possible endo-geneity of international migration, and con-trolling for level of income, income inequality and geographic region, results for the poverty headcount measure suggest that, on average, a 10% increase in the share of international mi-grants in a country’s population will lead to a 2.1% decline in the share of people living on less than $1.00 per person per day. After instrumen-ting for the possible endogeneity of interna-tional remittances, a similar 10% increase in per capita official international remittances will lead, on average, to a 3.5% decline in the share of people living in poverty. The fact thatboth
international migration and international remit-tances reduce poverty in the developing world is important because data on each of these vari-ables are incomplete and subject to under-reporting in many developing countries. By analyzing samples which include information on each of these variables, we have been able to test the migration–remittances–poverty rela-tionship for the largest number of labor-export-ing countries possible. The results provide strong, robust evidence of the poverty-reducing impact of both international migration and remittances in the developing world.
The second finding relates to endogeneity. Comparing the instrumented and noninstru-mented (OLS) estimates for international migration and remittances in this paper shows that the coefficients for the instrumented vari-ables are larger and more precisely estimated than those for the noninstrumented variables. This suggests that international migration and remittances may be endogenous to poverty: that is, we cannot exclude the hypothesis that variations in poverty in developing countries cause changes in both the share of migrants going to work abroad and in the level of official international remittances sent home. However, our results show that the extent of this endoge-neity bias on poverty is not large in absolute terms: the instrumented results suggest that, on average, a 10% increase in per capita official remittances will lead to a 3.5% decline in the share of people living in poverty, while the non-instrumented (OLS) estimates suggest that a similar increase in official remittances will lead to a 1.8% decline in the share of poor people. More work needs to be done on this topic.
The third finding is more of a plea than a con-clusion. From the standpoint of future work on this topic, more attention needs to be paid to collecting and publishing better data on interna-tional migration and remittances. With respect to international migration, it would be useful if developing countries would start publishing records on the number and destination of their international migrants. In many developing countries, these data are already being collected, but they are not being published. With respect to international remittances, the IMF should make greater efforts to count the amount of remittance monies that are transmitted through informal, unofficial channels. It is possible that poor people, especially poor people from coun-tries located near major labor-receiving regions, are more likely to remit through informal, unof-ficial channels. For this reason, a full and com-plete accounting of the impact of international remittances (official and unofficial) on poverty in the developing world needs more accurate data on the large level of unofficial remittances returning to developing countries.
Our findings point to two policy recommen-dations. With respect to migration, the positive impact of international migration on poverty makes the policy question of ‘‘managing migra-tion’’ assume greater importance in the interna-tional development community. While the international community has paid considerable attention in the past to international move-ments of goods, services, and finance, much less attention has been paid to the international movements of people. The results of this paper suggest that there would be substantial poten-tial benefits to the world’s poor if more interna-tional attention were focused on integrating ‘‘migration policy’’ within the larger global dia-logue on economic development and poverty reduction. With respect to remittances, the international community needs to take efforts to reduce the current high transaction costs of remitting money to labor-exporting countries. At present, high transaction costs resulting from lack of competition, regulation, and/or low levels of financial sector performance in labor-exporting countries act as a type of regres-sive tax on international migrants, who often tend to be poor and to remit small amounts of money with each remittance transaction. Lowering the transactions costs of remittances will help to increase the poverty-reducing im-pact of international remittances and will also encourage a larger share of remittances to flow through formal financial channels.
NOTES 1. Foreign direct investment (FDI) is the most impor-tant source of external funding for developing countries. 2. In addition to the $93 billion per year in interna-tional remittances which return through official banking channels, a large and unrecorded amount of international remittance monies is transmitted through unofficial and informal channels. One recent IMF study (El-Qorchi, Maimbo, & Wilson, 2003) estimated that unofficial transfers of remittances to the developing world currently amount to $10 billion per year. 3. See, for example, Adams (1991, 1993), Taylor (1992), Gustafson and Makonnen (1993), Taylor, Zabin, and Eckhoff (1999), andStark (1991).
4. Low-income and middle-income countries are those which are classified as such by theWorld Bank (2000, pp. 334–335). Low-income countries are those with 1999 GNP per capita $756 or less; middle-income countries are those with 1999 GNP per capita of $756–$9,265. 5. In line with other crossnational studies of poverty, 1980 was selected as a cutoff point because the poverty data prior to that year are far less comprehensive. See, for example, Ravallion and Chen (1997) and Adams (2004).
6. For the purposes of this study, OECD (Europe) includes 21 countries: Austria, Belgium, Czech Republic, Denmark, Finland, France, Germany, Greece, Hungary, Ireland, Italy, Luxemburg, Netherlands, Norway, Po-land, Portugal, Slovak Republic, Spain, Sweden, Swit-zerland, and United Kingdom.
7. IMF records annual flow in international remit-tances in its publication,Balance of Payments Statistics Yearbook(Washington, DC).
8. For a full list of these 157 developing countries, see World Bank (2000, pp. 334–335).
9. For example, China was eliminated from the data set because of missing income inequality data for the country as a whole.
10. To ensure compatibility across countries, all of the poverty lines inTable 9are international poverty lines, set at estimates of $1.08 per person per day in 1993 purchasing power parity (PPP) exchange rates. The PPP exchange rates are used so that $1.08 is worth roughly the same in all countries. PPP values are calculated by pricing a representative bundle of goods in each country
and comparing the local cost of that bundle with the US dollar cost of the same bundle. In calculating PPP values, the comparison of local costs with US costs is done using conversion estimates produced by the World Bank.
11. In this paper the terms ‘‘expenditure’’ and ‘‘in-come’’ are used interchangeably.
12. While a transfer of expenditures from a poor person to a poorer person will not change the headcount index or the poverty gap index, it will decrease the squared poverty gap index.
13. In 2002, the stock of illegal immigrants in the United States was estimated at 9.3 million, or about 26% of the total stock of the ‘‘foreign-born’’ population. See Passel, Capps, and Fix (2004).
14. All of the data on the ‘‘foreign-born’’ population living in the OECD (Europe) comes fromOECD,Trends in International Migration(Paris, various issues). 15. Adams (1991, p. 13).
16. In addition toRavallion (1997)andRavallion and Chen (1997), see Squire (1993), Collier and Dollar (2001), andBhalla (2002).
17. On this point, seeBirdsall and Londono (1997)and Ravallion (1997).
18. See Deaton (2001, pp. 125–147) and Adams (2004).
19. However, in those household surveys where survey mean income is proxied by survey mean expenditure, the income variable may, to some extent, capture the impact of remittances income on household expenditure. 20. See, for example,Ravallion and Chen (1997). 21. When Eqn. (1) is estimated using survey mean income, the dependent and independent variables in the equation are both based on data from household budget surveys.
22. The five regional dummy variables are those for East Asia, Europe and Central Asia, Latin America and the Caribbean, Middle East and North Africa, and South Asia. Sub-Saharan Africa is the omitted regional dummy.
23. In this study, distance between remittance-sending region (United States, OECD (Europe), or Persian Gulf) and remittance-receiving country is measured for each individual developing country as the miles between the borders of that country and the main region from which it receives remittances. For example, for Latin American countries, it is the distance to the United States, for North African countries, it is the distance to OECD (Europe), and for South Asian countries, it is the distance to the Persian Gulf.
24. For other empirical studies of the relationship between distance and international migration, see Kare-mera, Oguledo, and Davis (2000)andVogler and Rotte (2000).
25. See, for example,Harris and Todaro (1970). 26. For example, Mora and Taylor (2005) find that education has no significant effect on the level of international migration from rural Mexico andAdams
(1993)finds similar results for rural Egypt. On this point more generally,Borjas (1999)argues that international migrants will be negatively selected with respect to education in countries with high income inequality.
27. Government stability is measured by ratings pub-lished on a monthly basis by the PRS Group in the
International Country Risk Guide. These ratings for ‘‘government stability’’ have a scale of zero to 12, with zero representing countries with ‘‘very unstable govern-ment’’ to 11 representing those countries with ‘‘very stable government.’’ For instance, in June 2002, the United States had a ‘‘government stability’’ rating of 11, while Poland had a rating of 6.
28. The relevant calculations from Table 8 are as follows. For instrumented per capita international remittances, (18.15/17.151) * (0.351) = (2.046). For survey mean income, (1,629.60/1,628.601) * (1.590) = (0.976).
REFERENCES Adams, R., Jr. (1991). The effects of international
remittances on poverty, inequality and development in rural Egypt. Research Report 86. International Food Policy Research Institute, Washington, DC. Adams, R. Jr. (1993). The economic and demographic
determinants of international migration in rural Egypt.Journal of Development Studies, 30, 146–167. Adams, R. Jr. (2004). Economic growth, inequality and poverty: estimating the growth elasticity of poverty.
World Development, 32, 1989–2014.
Bhalla, S. (2002).Imagine there’s no country: Poverty, inequality and growth in the era of globalization. Washington, DC: Institute for International Eco-nomics.
Birdsall, N., & Londono, J. (1997). Asset inequality matters: an assessment of the World Bank’s ap-proach to poverty reduction. American Economic Review, 87, 32–37.
Borjas, G. (1999). Heaven’s Door: Immigration policy and the American economy. Princeton, NJ: Princeton University Press.
Collier, P., & Dollar, D. (2001). Can the world cut poverty in half. How policy reform and effective aid can meet international development goals. World Development, 29, 1787–1802.
Deaton, A. (2001). Counting the world’s poor: problems and possible solutions. World Bank Research Ob-server, 16, 125–147.
El-Qorchi, M., Maimbo, S., & Wilson, J. (2003). Informal funds transfer systems: an analysis of the informal hawala system. IMF Occasional Paper 222. International Monetary Fund, Washington, DC. Gustafson, B., & Makonnen, N. (1993). Poverty and
remittances in Lesotho. Journal of African Econo-mies, 2, 49–73.
Harris, J., & Todaro, M. (1970). Migration, unemploy-ment and developunemploy-ment: a two-sector analysis. Amer-ican Economic Review, 60, 126–142.
Hatton, T., & Williamson, J. (2003). What fundamentals drive world migration? Wider Discussion Paper No. 2003/23. Helsinki, Finland.
International Monetary Fund (various). Balance of payments statistics yearbook. International Mone-tary Fund, Washington, DC.
Karemera, D., Oguledo, V., & Davis, B. (2000). A gravity model analysis of international migration to North America. Applied Economics, 32, 1745– 1755.
Lipton, M. (1980). Migration from rural areas of poor countries: the impact on rural productivity and income distribution. World Development, 8, 1–24.
Mora, J., & Taylor, J. E. (2005). Determinants of international migration: disentangling individual, household and community effects. Unpublished manuscript. Department of Agricultural Economics, University of California, Davis, USA.
Organization for Economic Cooperation and Develop-ment (various). Trends in international migration. Paris, France.
Passel, J., Capps, R., Fix, M. (2004). Undocumented immigrants: facts and figures. Unpublished manu-script. Urban Institute, Washington, DC.
Ratha, D. (2004). Enhancing the developmental effect of workers’ remittances to developing countries. In
Global development finance(pp. 169–173). Washing-ton, DC: World Bank.
Ravallion, M. (1997). Can high-inequality developing countries escape absolute poverty? Economics Let-ters, 56, 51–57.
Ravallion, M., & Chen, S. (1997). What can new survey data tell us about recent changes in distribution and poverty?World Bank Economic Review, 11, 357–382. Squire, L. (1993). Fighting poverty.American Economic
Review, 83, 377–382.
Stahl, C. (1982). Labor emigration and economic development. International Migration Review, 16, 868–899.
Stark, O. (1991). The migration of labor. Cambridge, MA: Harvard University Press.
Stark, O., & Taylor, J. E. (1989). Relative deprivation and international migration.Demography, 26, 1–14. Taylor, J. E. (1992). Remittances and inequality recon-sidered: direct, indirect and intertemporal effects.
Journal of Policy Modeling, 14, 187–208.
Taylor, J. E., Zabin, C., & Eckhoff, K. (1999). Migration and rural development in El-Salvador: a micro-economywide perspective.North American Journal of Economics and Finance, 10, 91–114.
United Nations, Department of Economic and Social Affairs, Population Division (2002).International Mig-ration Report 2002. New York: United Nations. United States, Census Bureau (1990, 2000). Population
census. Washington, DC.
Vogler, M., & Rotte, R. (2000). The effects of develop-ment on migration: theoretical issues and new empirical evidence.Journal of Population Economics, 13, 485–505.
World Bank (2000). World Development Report, 2000/ 01. World Bank, Washington, DC.
World Bank (2002). Global Poverty Monitoring data-base. World Bank, Washington, DC.
World Bank (2004). Global Development Finance. World Bank, Washington, DC.
APPENDIX
Table 9summarizes the variables used in the new data set.
(See Overleaf)
Table 9. Summary of data set on poverty, inequality, international migration and remittances
Country Survey year
Region Poverty headcount ($1/person/day)
Poverty gap (%)
Squared poverty gap (%)
Gini coefficient
Migration as share of country population
Official remittances (million dollars)
Per capita official remittances
(constant 1995 dollars) Algeria 1988 Middle East, North Africa 1.75 0.64 0.48 0.414 2.77 379 15.94 Algeria 1995 Middle East, North Africa 1.16 0.23 0.094 0.353 2.01 1,101 39.22
Bangladesh 1984 South Asia 26.16 5.98 1.96 0.258 0.04 527 5.58
Bangladesh 1986 South Asia 21.96 3.92 1.07 0.269 0.04 497 4.98
Bangladesh 1989 South Asia 33.75 7.72 2.44 0.288 0.05 771 7.17
Bangladesh 1992 South Asia 35.86 8.77 2.98 0.282 0.06 848 7.43
Bangladesh 1996 South Asia 29.07 5.88 1.6 0.336 0.09 1,217 10.78
Belarus 1988 Europe, Central Asia 0 0 0 0.227 0 0 0
Belarus 1993 Europe, Central Asia 1.06 0.13 0.03 0.216 0 0 0
Belarus 1995 Europe, Central Asia 2.27 0.71 0.46 0.287 0 29 2.84
Bolivia 1990 Latin America 11.28 2.22 0.6 0.42 0.47 2 0.30
Botswana 1985 Sub-Saharan Africa 33.3 12.53 6.09 0.542 0 0 0
Brazil 1985 Latin America 15.8 4.69 1.82 0.595 0.05 25 0.18
Brazil 1988 Latin America 18.62 6.78 3.22 0.624 0.05 19 0.13
Brazil 1993 Latin America 18.79 8.38 5.01 0.615 0.08 1,123 7.24
Brazil 1995 Latin America 13.94 3.94 1.46 0.6 0.09 2,891 18.12
Brazil 1997 Latin America 5.1 1.32 0.5 0.517 0.11 1,324 8.08
Bulgaria 1989 Europe, Central Asia 0 0 0 0.233 0.2 0 0
Bulgaria 1992 Europe, Central Asia 0 0 0 0.308 0.2 0 0
Bulgaria 1995 Europe, Central Asia 0 0 0 0.285 0.2 0 0
Burkina Faso 1994 Sub-Saharan Africa 61.18 25.51 13.03 0.482 0 80 8.19 Central African
Republic
1993 Sub-Saharan Africa 66.58 40.04 28.56 0.613 0 0 0
Chile 1987 Latin America 10.2 2.25 0.66 0.564 0.4 0 0
Chile 1990 Latin America 8.26 2.03 0.73 0.56 0.42 0 0
Chile 1992 Latin America 3.91 0.74 0.23 0.557 0.44 0 0
Chile 1994 Latin America 4.18 0.65 0.15 0.548 0.46 0 0
Colombia 1988 Latin America 4.47 1.31 0.57 0.531 0.8 448 13.32
Colombia 1991 Latin America 2.82 0.75 0.32 0.513 0.86 866 24.29
Colombia 1995 Latin America 8.87 2.05 0.63 0.574 1.02 739 19.16
Colombia 1996 Latin America 10.99 3.16 1.21 0.571 1.06 635 16.16
Costa Rica 1986 Latin America 12.52 5.44 3.27 0.344 1.43 0 0
Costa Rica 1990 Latin America 11.08 4.19 2.37 0.456 1.41 0 0
1664
WORLD
DEVELO
Costa Rica 1993 Latin America 10.3 3.53 1.79 0.462 1.58 0 0
Costa Rica 1996 Latin America 9.57 3.18 1.55 0.47 1.71 122 34.83
Coˆte d’Ivoire 1985 Sub-Saharan Africa 4.71 0.59 0.1 0.412 0 0 0
Coˆte d’Ivoire 1987 Sub-Saharan Africa 3.28 0.41 0.08 0.4 0 0 0
Coˆte d’Ivoire 1993 Sub-Saharan Africa 9.88 1.86 0.54 0.369 0 0 0
Coˆte d’Ivoire 1995 Sub-Saharan Africa 12.29 2.4 0.71 0.367 0 0 0
Czech Republic 1988 Europe, Central Asia 0 0 0 0.194 1.73 0 0
Czech Republic 1993 Europe, Central Asia 0 0 0 0.266 1.53 0 0
Dominican Republic 1989 Latin America 7.73 1.51 0.42 0.504 4.89 301 43.33 Dominican Republic 1996 Latin America 3.19 0.71 0.26 0.487 7.08 914 116.70
Ecuador 1988 Latin America 24.85 10.21 5.82 0.439 1.38 0 0
Ecuador 1995 Latin America 20.21 5.77 2.27 0.437 1.92 382 33.32
Egypt 1991 Middle East, North Africa 3.97 0.53 0.13 0.35 0.15 2,569 47.92 Egypt 1995 Middle East, North Africa 5.55 0.66 0.13 0.283 0.18 3,279 56.35
El Salvador 1989 Latin America 25.49 13.72 10.06 0.489 9.06 228 45.38
El Salvador 1996 Latin America 25.26 10.35 5.79 0.522 11.67 1,084 187.32
Estonia 1988 Europe, Central Asia 0 0 0 0.229 0 0 0
Estonia 1993 Europe, Central Asia 3.15 0.91 0.51 0.395 0 0 0
Estonia 1995 Europe, Central Asia 4.85 1.18 0.39 0.353 0 0 0
Ethiopia 1981 Sub-Saharan Africa 32.73 7.69 2.71 0.324 0.07 0 0
Ethiopia 1995 Sub-Saharan Africa 31.25 7.95 2.99 0.399 0.09 0 0
Gambia 1992 Sub-Saharan Africa 53.69 23.27 13.28 0.478 0 0 0
Ghana 1987 Sub-Saharan Africa 47.68 16.6 7.81 0.353 0.11 1 0.07
Ghana 1989 Sub-Saharan Africa 50.44 17.71 8.36 0.359 0.12 6 0.41
Ghana 1992 Sub-Saharan Africa 45.31 13.73 5.61 0.339 0.18 7 0.43
Ghana 1999 Sub-Saharan Africa 44.81 17.28 8.71 0.327 0.32 26 1.44
Guatemala 1987 Latin America 47.04 22.47 13.63 0.582 2.09 0 0
Guatemala 1989 Latin America 39.81 19.79 12.59 0.596 2.34 69 8.07
Honduras 1989 Latin America 44.67 20.65 12.08 0.595 2.11 35 7.40
Honduras 1992 Latin America 38.98 17.74 10.4 0.545 2.74 60 11.62
Honduras 1994 Latin America 37.93 16.6 9.38 0.552 3.23 85 15.54
Honduras 1996 Latin America 40.49 17.47 9.72 0.537 3.66 128 22.15
Hungary 1989 Europe, Central Asia 0 0 0 0.233 2.02 0 0
Hungary 1993 Europe, Central Asia 0 0 0 0.279 1.75 0 0
India 1983 South Asia 52.55 16.27 NA 0.32 0.04 2,311 3.14
India 1986 South Asia 47.46 13.92 NA 0.337 0.06 2,105 2.69
India 1988 South Asia 47.99 13.51 NA 0.329 0.07 2,402 2.95
India 1990 South Asia 45.95 12.63 NA 0.312 0.09 1,875 2.21
(continued next page)
INTERNAT
IONAL
MIGRATIO
N
AND
REMIT
TANCES
Table 9—continued
Country Survey year
Region Poverty headcount ($1/person/day)
Poverty gap (%)
Squared poverty gap (%)
Gini coefficient
Migration as share of country population
Official remittances (million dollars)
Per capita official remittances
(constant 1995 dollars)
India 1995 South Asia 46.75 12.72 NA 0.363 0.11 7,685 8.27
India 1997 South Asia 44.03 11.96 NA 0.378 0.12 10,688 11.10
Indonesia 1987 East Asia 28.08 6.08 1.78 0.331 0.01 86 0.51
Indonesia 1993 East Asia 14.82 2.98 0.39 0.317 0.05 346 1.84
Indonesia 1996 East Asia 7.81 0.95 0.18 0.364 0.08 796 4.35
Indonesia 1998 East Asia 26.33 5.43 1.69 0.315 0.1 959 4.71
Iran 1990 Middle East, North Africa 0.9 0.8 NA 0.434 0.63 1 0.02
Jamaica 1988 Latin America 5.02 1.38 0.67 0.431 17.03 76 32.24
Jamaica 1990 Latin America 0.62 0.03 0.01 0.418 19.07 136 56.57
Jamaica 1993 Latin America 4.52 0.86 0.29 0.379 21.8 187 75.65
Jamaica 1996 Latin America 3.15 0.73 0.32 0.364 24.4 636 250.52
Jordan 1987 Middle East, North Africa 0 0 0 0.36 0.87 939 329.99
Jordan 1992 Middle East, North Africa 0.55 0.12 0.05 0.433 0.93 843 225.89 Jordan 1997 Middle East, North Africa 0.36 0.1 0.06 0.364 0.94 1,655 371.26
Kazakhstan 1988 Europe, Central Asia 0.05 0.02 0.01 0.257 0 0 0
Kazakhstan 1993 Europe, Central Asia 1.06 0.04 0.01 0.326 0 0 0
Kazakhstan 1996 Europe, Central Asia 1.49 0.27 0.1 0.354 0 10 0.64
Kenya 1992 Sub-Saharan Africa 33.54 12.82 6.62 0.574 0 0 0
Kenya 1994 Sub-Saharan Africa 26.54 9.03 4.5 0.445 0 0 0
Kyrgyz Republic 1988 Europe, Central Asia 0 0 0 0.26 0 0 0
Kyrgyz Republic 1993 Europe, Central Asia 22.99 10.87 6.82 0.537 0 2 0.44 Kyrgyz Republic 1997 Europe, Central Asia 1.57 0.28 0.1 0.405 0 3 0.64
Latvia 1988 Europe, Central Asia 0 0 0 0.225 0 0 0
Latvia 1993 Europe, Central Asia 0 0 0 0.269 0 0 0
Latvia 1995 Europe, Central Asia 0 0 0 0.284 0 0 0
Latvia 1998 Europe, Central Asia 0.19 0.01 0 0.323 0 3 1.22
Lesotho 1987 Sub-Saharan Africa 30.34 12.66 6.85 0.56 0 0 0
Lesotho 1993 Sub-Saharan Africa 43.14 20.26 11.84 0.579 0 0 0
Lithuania 1988 Europe, Central Asia 0 0 0 0.224 0 0 0
Lithuania 1993 Europe, Central Asia 16.47 3.37 0.95 0.336 0 0 0
Lithuania 1996 Europe, Central Asia 0 0 0 0.323 0 2 0.55
Madagascar 1980 Sub-Saharan Africa 49.18 19.74 10.21 0.468 0 0 0
Madagascar 1994 Sub-Saharan Africa 60.17 24.46 12.83 0.434 0 11 0.85
1666
WORLD
DEVELO