From Data Fusion to Knowledge Fusion
Xin Luna Dong, Evgeniy Gabrilovich, Geremy Heitz, Wilko Horn,
Kevin Murphy, Shaohua Sun, Wei Zhang
Google Inc.{
lunadong|gabr|geremy|wilko|kpmurphy|sunsh|weizh
}@google.com
ABSTRACT
The task ofdata fusionis to identify the true values of data items (e.g., the true date of birth forTom Cruise) among multiple observed values drawn from different sources (e.g., Web sites) of varying (and unknown) reliabil-ity. A recent survey [20] has provided a detailed comparison of various fusion methods on Deep Web data. In this paper, we study the applicability and limitations of different fusion techniques on a more challenging prob-lem:knowledge fusion. Knowledge fusion identifies true subject-predicate-object triples extracted by multiple information extractors from multiple information sources. These extractors perform the tasks of entity linkage and schema alignment, thus introducing an additional source of noise that is quite different from that traditionally considered in the data fusion litera-ture, which only focuses on factual errors in the original sources. We adapt state-of-the-art data fusion techniques and apply them to a knowledge base with 1.6B unique knowledge triples extracted by 12 extractors from over 1B Web pages, which is three orders of magnitude larger than the data sets used in previous data fusion papers. We show great promise of the data fusion approaches in solving the knowledge fusion problem, and suggest interest-ing research directions through a detailed error analysis of the methods.
1.
INTRODUCTION
Extracting information from multiple, possibly conflicting, data sources, and reconciling the values so the true values can be stored in a central data repository, is a problem of vital importance to the database and knowledge management communities. A
com-mon way to formalize the problem is to assume we haveM data
items, each describing a particular aspect of an entity (e.g., the date
of birth ofTom Cruise), andNdata sources (e.g., Web sites); we
can visualize the raw data as anM×Ndata matrix, where each
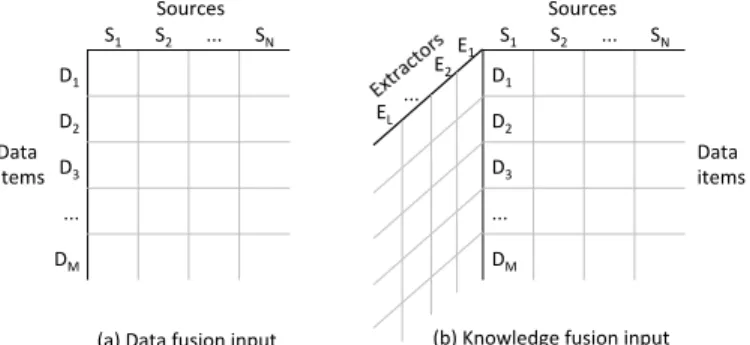
cell represents the values provided by a source on a data item, al-though many cells may be empty, representing missing data (see Figure 1(a)). The goal is to infer the true latent value for each of the data items (rows), given the noisy observed values in the matrix, while simultaneously estimating the unknown quality and interdependence of the data sources (columns). This problem is
calleddata fusion, and has received a lot of attention in recent years
(see [3, 20] for recent surveys).
This work is licensed under the Creative Commons Attribution-NonCommercial-NoDerivs 3.0 Unported License. To view a copy of this li-cense, visit http://creativecommons.org/licenses/by-nc-nd/3.0/. Obtain per-mission prior to any use beyond those covered by the license. Contact copyright holder by emailing [email protected]. Articles from this volume were invited to present their results at the 40th International Conference on Very Large Data Bases, September 1st - 5th 2014, Hangzhou, China.
Proceedings of the VLDB Endowment,Vol. 7, No. 10 Copyright 2014 VLDB Endowment 2150-8097/14/06.
In this paper, we study how we can adapt existing data fusion techniques to the more challenging area of automatically construct-ing large-scale knowledge bases (KBs). To build a knowledge base, we employ multiple knowledge extractors to extract (possibly con-flicting) values from each data source for each data item; we then need to decide the degree of correctness of the extracted
knowl-edge. We call this new problemknowledge fusion. We can
visual-ize it as adding a third dimension to the aforementioned data matrix (see Figure 1(b)). This third dimension corresponds to different in-formation extractors applied to each data source. These extractors must convert raw data, often expressed in unstructured text format, into structured knowledge that can be integrated into a knowledge base. This involves three key steps: identifying which parts of the data indicate a data item and its value; linking any entities that are mentioned to the corresponding entity identifier; and linking any relations that are mentioned to the corresponding knowledge base schema. All three steps are error prone. Furthermore, the errors introduced by these steps are quite different from what has been considered in data fusion, which has focussed on factual errors in the original sources. To handle the increased level of noise in the data, we compute a calibrated probability distribution over values for each data item, rather than just returning a single “best guess” as in data fusion.
We make three contributions in this paper. The first contribu-tion is to define the knowledge fusion problem, and to adapt exist-ing data fusion techniques to solve this problem. We select three such techniques and devise efficient MapReduce based implemen-tations for them. We evaluate the performance of these techniques on a knowledge base that contains 1.6B RDF triples in the form
of (subject,predicate,object), extracted by 12 extractors
from over 1 billion Web pages; the size of the data is 1000 times larger than any data set used in previous data fusion experiments.
The second contribution is to suggest some simple improvements to existing methods that substantially improve their quality, espe-cially in terms of the quality of the calibration of the estimated probabilities. The result of these improvements is a fairly well calibrated system: when we predict a probability above 0.9, the real accuracy of the triples is indeed high (0.94); when we predict a probability below 0.1, the real accuracy is fairly low (0.2); and when we predict a medium probability in [0.4, 0.6), the real accu-racy also matches well (0.6).
The third contribution is a detailed error analysis of our meth-ods, and a list of suggested directions for future research to address some of the new problems raised by knowledge fusion.
Related work: There are two main bodies of related work. The
first concerns data fusion, surveyed in [20]. As discussed above, the current paper adapts those approaches to solve the more chal-lenging problem of knowledge fusion by considering a third source
S1 S2 ... SN D1
D2 D3 ... DM
(a) Data fusion input
S1 S2 ... SN D1
D2 D3 ... DM
(b) Knowledge fusion input E1
EL ...
E2
Sources Sources
Data
items Data items
Figure 1: Input for data fusion is two-dimensional whereas input for knowledge fusion is three-dimensional.
of noise from the use of multiple information extractors. The sec-ond main body of work is related to knowledge base construction, such as YAGO [32], NELL [7], and DeepDive [24]. Prior work in this literature focuses on applying (semi-)supervised machine learning methods to improve extraction quality, while we focus on resolving conflicts from different systems using an unsupervised approach, treating the extractors themselves as black boxes.
Finally, we note the difference of our work from the domain-centric approach that extracts and integrates structured data in a particular domain. Dalvi et al. [8] studied distribution of structured data in particular domains to evaluate the feasibility and efficacy of such an approach, whereas we focus on detecting errors from knowledge extracted from various types of data in domains of a large variety.
The rest of the paper is structured as follows. Section 2 briefly surveys the state-of-the-art methods in data fusion. Section 3 de-scribes knowledge extraction and formally defines knowledge fu-sion. Section 4 evaluates the performance of data fusion techniques on knowledge fusion and presents a detailed error analysis. Sec-tion 5 suggests future research direcSec-tions and SecSec-tion 6 concludes.
2.
STATE OF THE ART IN DATA FUSION
Data fusion is the problem of resolving conflicting values from different sources, and finding the underlying true values. In this section, we provide a brief summary of existing approaches to this problem; this will set the stage for our later discussion of knowl-edge fusion.
We can consider the input of data fusion as a two-dimensional data matrix (Figure 1(a)). Each row represents a data item that
de-scribes a particular aspect of an entity, such as thebirth dateofTom
Cruise. Each column represents a data source. Each cell represents the value (or values) provided by the corresponding source on the corresponding data item. The matrix can be sparse, since a source may provide values on only a subset of the data items. Erroneous values may be provided and conflicts may exist for the same data item. Data fusion aims at finding the one true value (or sometimes the set of true values) for each data item. Note that for this paper we consider only a snapshot of data rather than temporally evolving data from data sources that are frequently updated.
Early approaches to data fusion methods were typically rule-based, such as using the observed value from the most recently updated source, or taking the average/maximum/minimum for nu-merical values. They focus on improving efficiency with the use of database queries (surveyed in [3, 13]). Recently many advanced solutions have been proposed that apply unsupervised learning or semi-supervised learning to find the truths (see [20] for a recent survey and [27, 29] for works thereafter). We can roughly classify these methods into three classes.
Voting: Votingis a baseline strategy. Among conflicting values,
each value has one vote from each data source, and we take the
value with the highest vote count (i.e., the value provided by the
largest number of sources).
Quality-based: Quality-based methods evaluate the
trustworthi-ness of data sources and accordingly compute a higher vote count for a high-quality source. We can further divide them into four sub-categories according to how they measure source trustworthiness.
• Web-link based methods [19, 25, 26, 35]measure source
trustworthiness and value correctness usingPageRank [5]:
a source providing a value is considered as a link between the source and the value.
• IR-based methods [17]measure source trustworthiness as the
similaritybetween the provided values and the true values. They use similarity metrics that are widely accepted in infor-mation retrieval, such as cosine similarity. Value correctness is decided by the accumulated source trustworthiness.
• Bayesian methods [11, 14, 34]measure the trustworthiness
of a source by itsaccuracy, which essentially indicates the
probability of each of its values being true. They apply Bayesian
analysis to compute themaximum a posteriorior MAP value
for each data item.
• Graphical-model methods [27, 36, 37]apply probabilistic graphical models to jointly reason about source trustworthi-ness and value correcttrustworthi-ness.
Relation-based:Relation-based methodsextend quality-based
meth-ods by additionally considering the relationships between the sources. The relationship can be that of copying between a pair of sources [2, 10, 11, 12, 21]; in this case, a copier has a discounted vote count for its copied values. The relationship can also be correlation among a subset of sources [28, 29]; sources in such a subset may be consid-ered as one in trustworthiness evaluation.
Most of the advanced methods take an iterative approach to truth finding, quality evaluation, and relationship detection when appli-cable. They do not use training data and are unsupervised. A few of them assume the existence of labeled data, which can be used to estimate source accuracy without the need for iterative algo-rithms [14], or can be used in conjunction with unlabeled data for optimization purpose [35]; such methods are semi-supervised.
3.
FUSING EXTRACTED KNOWLEDGE
Our goal is to build a high-quality Web-scale knowledge base. Figure 2 depicts the architecture of our system; we describe each component of this system in Section 3.1. In Section 3.2 we ana-lyze the quality of the collected knowledge, which motivates our formal definition of the knowledge fusion problem. While our sta-tistical analysis is conducted on the knowledge that we extracted using our system, we expect that similar properties will apply to data extracted by other similar KB construction methods.
3.1
Knowledge extraction
3.1.1
Knowledge base
We follow the data format and ontology inFreebase, which
con-tains a large number of manually verified triples [4]. We store
the knowledge as (subject,predicate,object)triples; an
example triple is(Tom Cruise, birth date, 7/3/1962). Each
sub-jectis anentityrepresented by its ID inFreebase, and it belongs
to one or several types; here, we use pre-definedFreebase types,
Web
TXT DOM TBL ANO Extractor Extractor ... Extractor
Knowledge fusion Knowledge base
Figure 2: Architecture of knowledge extrac-tion and fusion.
TXT
(301M) (1280M) DOM
ANO (145M) TBL
(10M) 13K
110M
1.1M 1.7M
0.3M 1.5M
Figure 3: Contributions and overlaps be-tween different types of Web contents.
0.00 0.02 0.04 0.06 0.08 0.10 0.12 0.14 0.16 0.18 0.20
0 0.1 0.2 0.3 0.4 0.5 0.6 0.7 0.8 0.9 1
Percen
ta
ge o
f p
red
ica
tes wi
th
the
spe
cifi
c ac
cur
ac
y
Accuracy Distribu8on of Predicate Accuracy
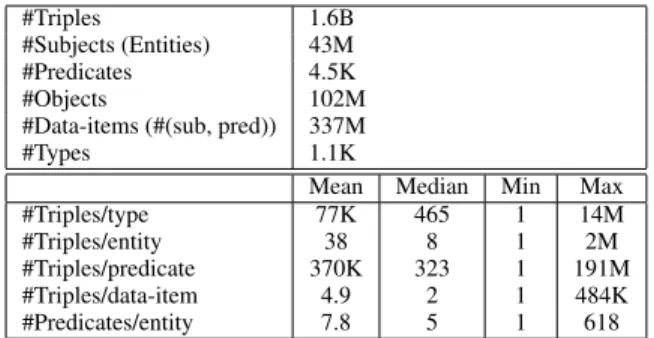
Figure 4: The accuracy of extracted triples can vary a lot for different predicates. Table 1: Overview of knowledge extracted on 10/2/2013. The size
of the data is huge and the distribution is highly skewed in general.
#Triples 1.6B
#Subjects (Entities) 43M
#Predicates 4.5K
#Objects 102M
#Data-items (#(sub, pred)) 337M
#Types 1.1K
Mean Median Min Max
#Triples/type 77K 465 1 14M
#Triples/entity 38 8 1 2M
#Triples/predicate 370K 323 1 191M
#Triples/data-item 4.9 2 1 484K
#Predicates/entity 7.8 5 1 618
people/profession). Eachpredicateis chosen from the set of
pre-defined predicates inFreebase. Typically a predicate is associated
with a single type and can be considered as the attribute of entities
in that type. Some predicates arefunctional; that is, there is a single
truth for a data item (e.g., a person has a single date of birth). Other
predicates arenon-functional; for example, a person can have
sev-eral children. Eachobjectcan be an entity inFreebase, a string, or
a number. Note that in each triple the (subject,predicate)
pair corresponds to a “data item” in data fusion, and the object can be considered as a “value” provided for the data item.
In this paper we focus on triples whose subjects and predicates
already exist inFreebase. Our goal is to extract new facts about
these subjects and predicates. As we show shortly, this already raises many challenges. We note that identifying new types, new entities and new predicates are interesting research topics and we briefly discuss these challenges in Section 5.
For each extracted triple, we keep rich provenance information, including which extractor was used to extract it, which URL the triple is extracted from, what is the context for each extraction, and so on. Some extractors provide a confidence for each extraction, which is kept as well. This provenance information is much richer than that in data fusion, which is simply the identity of the source.
Statistics:Table 1 lists basic counts for the extracted triples. There
are in total 1.6B unique triples; together they present knowledge about 43M unique entities from 1.1K types. The types are in var-ious domains including geography, business, book, music, sports, people, biology, etc. In total there are 4.5K unique predicates and over 300M data items. There are many more unique objects (102M) than subjects; among them 23M are entities, 80M are raw strings
(e.g., names, descriptions, addresses), and 1M are numbers. Among
the extracted triples, 83% are not included inFreebase.
Most distributions (e.g., #triples per type, #predicates per entity)
are highly skewed, which means they have a heavy head and a long tail; indeed, we observe that the median is typically much smaller than the mean. For example, 11 types contain millions of entities
(the top 3 types arelocation,organization, andbusiness), while
for 30% types we know only up to 100 entities. As another exam-ple, for 5 entities our knowledge consists of over 1M triples (they
are all locations: USA, UK, CA, NYC, TX, although many triples
are due to wrong extractions), while for 56% entities we extract no more than 10 triples.
3.1.2
Web sources
We crawl a large set of Web pages and extract knowledge from
four types of Web contents. Text documents (TXT)contain texts
from Web pages; knowledge triples are typically hidden in the
sen-tences and phrases. For example, the sentence“Tom Cruise is an
American film actor and producer”(fromWikipedia) yields three
knowledge triples: (Tom Cruise, nationality, USA),(Tom Cruise,
profession, film actor), and(Tom Cruise, profession, film producer).
DOM trees (DOM)contain information organized in DOM-tree
format, which can be found either in Web pages (e.g., Web lists,
Web tables), or in deep-Web sources [22]. The structure of a DOM tree hints at the relations between the entities. As an example, con-sider the following DOM tree snippet (from a Wikipedia infobox).
<tr>
<th>Born</th> <td>
<span>Thomas Cruise Mapother IV</span><br/>
<span>1962-07-03</span><br/>
<span>Syracuse, New York </span> </td> </tr>
It contains two knowledge triples:(Tom Cruise, birth date, 7/3/1962)
and(Tom Cruise, birth place, Syracuse NY).
Web tables (TBL)contain tabular data on the Web with essen-tially relational data (as opposed to visual formatting) [6].
Typi-cally each row in the table represents an entity (i.e., subject) and
each column represents an attribute of the entity (i.e., predicate),
and the corresponding cell represents the value of the attribute for
the entity (i.e., object). Consider the following example table.
Movie Release year Actor Top Gun 1986 Tom Cruise
...
It contains two triples: (Top Gun, release year, 1986)and (Top
Gun, actor, Tom Cruise).
Finally,Web annotations (ANO)contain annotations manually
created by Webmasters using ontologies defined by schema.org,
microformats.org etc. The annotations provide rich evidence for extracting knowledge. Consider the following annotations
accord-ing toschema.org:
<h1 itemprop="name">Tom Cruise</h1>
<span itemprop="birthDate">7/3/1962</span>
<span itemprop="gender">Male</span>
The annotation indicates two knowledge triples:(Tom Cruise, birth
date, 7/3/1962)and(Tom Cruise, gender, male).
Statistics: We crawled the Web and extracted triples from over
1B Web pages. Figure 3 shows the number of triples we extracted
and contributes 80% of the triples, whileTXTcomes next and con-tributes 19% of the triples. Note however that the contribution is also bounded by the capability of our extractors, thus only partially reflects the amount of knowledge in a particular type of Web con-tents. We may extract the same triple from different types of Web contents; but interestingly, the overlap is rather small. Contribu-tions from Web sources are highly skewed: the largest Web pages each contributes 50K triples (again, some are due to wrong extrac-tions), while half of the Web pages each contributes a single triple.
3.1.3
Extractors
We employ a variety of extractors that extract knowledge triples from the Web. There are three tasks in knowledge extraction. The
first istriple identification; that is, deciding which words or phrases
describe a triple. This is easy for certain types of Web contents such as Web tables, but can be harder for other types of Web contents, as shown in the example text and DOM snippet above. The
sec-ond task isentity linkage; that is, deciding whichFreebaseentity
a word or phrase refers to. For example, we need to decide that
“Thomas Cruise Mapother IV”refers to the actor Tom Cruise with
FreebaseID/m/07r1h. The third task ispredicate linkage; that is,
to decide whichFreebasepredicate is expressed in the given piece
of text. Sometimes the predicates are explicitly specified such as in
the annotationitemprop=“birthDate”. However, more commonly,
the predicates are implicit; for example, in sentence“Tom Cruise
is an American film actor and producer”, the predicate of the triple
(Tom Cruise, nationality, USA)is implicit.
Our extractors apply different techniques for different types of Web contents. For texts, we first run standard natural language pro-cessing tools for named entity recognition, parsing, co-reference
resolution, etc. We then applydistant supervision[23] using
Free-basetriples as training data. Since there can be many ways for
expressing a given predicate in natural language, an extractor can learn many different patterns (or templates) for each predicate. For DOM trees, we apply distant supervision in a similar way except that we derive features from the DOM-tree structure. For Web ta-bles, we apply state-of-the-art schema mapping techniques as
de-scribed in [1] to map table columns toFreebasepredicates. For
an-notations we rely on semi-automatically defined mappings from the
ontology inschema.orgto that inFreebase. For entity linkage, we
use techniques similar to [30]. Some extractors may extract triples from multiple types of Web contents; for example, an extractor tar-geted at DOM can also extract from TBL since Web tables are in DOM-tree format. We omit the details for these techniques as they are not the focus of this paper.
We note that different extractors may perform the three basic tasks in different order; for example, some extractors first perform entity linkage and use the results for triple identification, while oth-ers first identify the triples and then reconcile the entities. The three tasks may be combined; for example, some natural language pro-cessing tools may perform triple identification and predicate link-age at the same time. Finally, we note that the extractors can be correlated: some may apply the same underlying techniques and differ only in the features selected for learning; multiple extractors may use the same entity linkage tool.
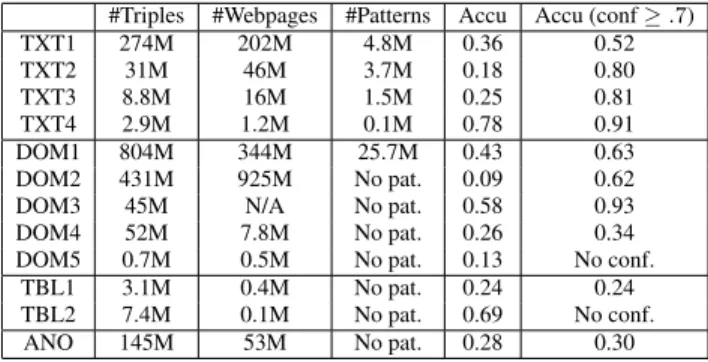
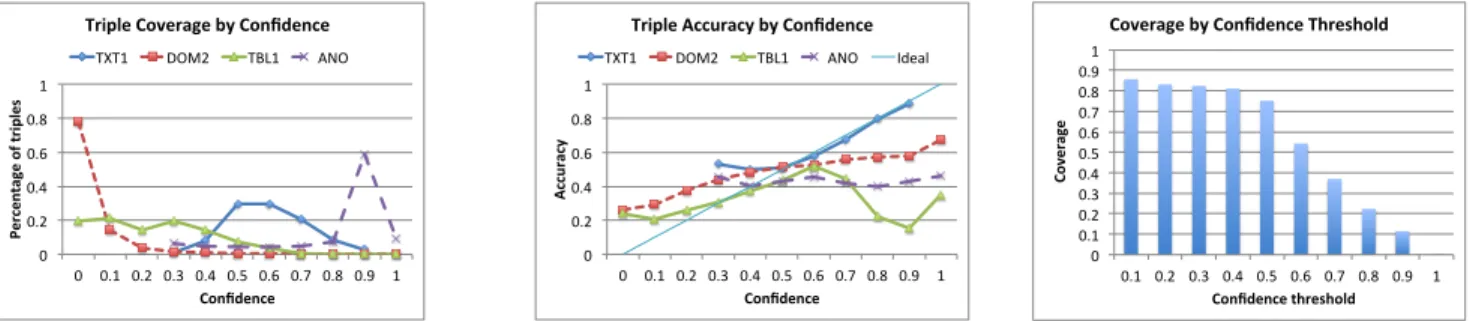
Statistics: We used 12 extractors: 4 for TXT, 5 for DOM, 2 for
TBL, and 1 for ANO (Table 2); each extractor is a rather complex system, so we skip the details. Different extractors for the same type of Web contents often use broadly similar methods, but differ in terms of their implementation details, signals used in training, and the set of Webpages they are designed to operate on. Specif-ically, TXT2-TXT4 use the same framework but run on normal
Webpages, newswire, andWikipediacorrespondingly, whereas TXT1
Table 2: Extractors vary a lot in the number of triples they extract and extraction quality.
#Triples #Webpages #Patterns Accu Accu (conf≥.7)
TXT1 274M 202M 4.8M 0.36 0.52
TXT2 31M 46M 3.7M 0.18 0.80
TXT3 8.8M 16M 1.5M 0.25 0.81
TXT4 2.9M 1.2M 0.1M 0.78 0.91
DOM1 804M 344M 25.7M 0.43 0.63
DOM2 431M 925M No pat. 0.09 0.62
DOM3 45M N/A No pat. 0.58 0.93
DOM4 52M 7.8M No pat. 0.26 0.34
DOM5 0.7M 0.5M No pat. 0.13 No conf.
TBL1 3.1M 0.4M No pat. 0.24 0.24
TBL2 7.4M 0.1M No pat. 0.69 No conf.
ANO 145M 53M No pat. 0.28 0.30
has a different implementation and runs on all Webpages. On the other hand, DOM1 and DOM2 run on all Webpages but differ in implementation details, DOM3 and DOM4 focus on identifying
entity types, and DOM5 runs only onWikipedia. Finally, TBL1
and TBL2 use different schema mapping techniques. We observe a high variety in the number of unique triples extracted by each ex-tractor, and in the number of the Webpages each extractor extracts triples from. Some of the extractors have trained millions of
pat-terns, while others (e.g., extractors for Web tables) do not involve
any pattern. As we elaborate soon, we also observe a high variety in the extraction quality of the extractors.
3.2
Knowledge fusion
3.2.1
Quality of extracted knowledge
Evaluating the quality of the extracted triples requires a gold
standard that contains true triples and false triples. We use
Free-basefor this purpose, since its triples are manually verified and thus
highly reliable. If a triple(s, p, o)occurs inFreebase, we consider
it as true. If a triple does not occur inFreebase, we could assume
it is false; this would be equivalent to making the closed-world as-sumption. However, we know that this assumption is not valid, since for tail entities, many facts are missing. Instead, we make a
slightly more refined assumption, which we call thelocal
closed-world assumption (LCWA). Under LCWA, if a triple(s, p, o)does
not occur in Freebasebut the pair(s, p) does, we consider it as
false; but if(s, p)does not occur inFreebase, we abstain from
la-beling the triple, and exclude it from the gold standard. In other
words, we assume onceFreebasehas knowledge about a particular
data item, it has complete knowledge, so it is locally complete. This assumption is valid for functional predicates, but not for
non-functional ones. This is becauseFreebasemay only contain a
subset of true triples for a data item, and hence we could wrongly label the extra true triples we have extracted as false. For example,
the set of actors in a movie is often incomplete inFreebase.
Never-theless, in practice we observe that most predicates have only 1 or 2 true values, so the LCWA assumption works well. Note also that [16] has shown the effectiveness of LCWA in data extraction.
Among the 1.6B triples, 650M (40%) have gold standard labels,
of which 200M are labeled as correct (i.e., included inFreebase);
in other words, the accuracy of the extracted triples is estimated to be about 30% (assuming the accuracy of triples not in the gold stan-dard is similar to those in the gold stanstan-dard). Note that this includes triples of different extraction confidence; as we show shortly, often-times triples with a lower confidence have lower accuracy, but the correlation can be different for different extractors. Figure 4 shows that the accuracy varies from predicate to predicate: 44% of the predicates have very low accuracy (below 0.3), while 13% of the predicates have fairly high accuracy (above 0.7).
Some of the erroneous triples are due to wrong information pro-vided by Web sources whereas others are due to mistakes in ex-tractions. Unfortunately, it is hard to distinguish them, unless we can automatically decide whether a source indeed claims a particu-lar knowledge triple. A random sampling of 25 false triples shows that 44% have triple-identification errors, such as taking part of the album name as the artist for the album; 44% have entity-linkage
errors, such as wrongly reconciling the Broadway showLes
Miser-ablesto the novel of the same name; 20% have predicate-linkage errors, such as mistaking the book author as the book editor; and only 4% are indeed provided by the Web sources (some triples are due to multiple errors). Thus, extractions are responsible for the majority of the errors.
As shown in Table 2, the accuracy of the extractors ranges from 0.09 to 0.78 (again, some errors are due to wrong information pro-vided by the Web sources). Within each extractor, we observe high variance of extraction quality among different patterns, and on dif-ferent Web pages; in most cases the accuracy ranges from nearly 0 to nearly 1 under the same extractor. For extractors that attach a confidence to each extraction, typically we observe a higher
accu-racy for triples with a high confidence (i.e., normalized confidence
above .7); however, the variance differs for different extractors. It is hard to evaluate the trustworthiness of a Web source, since many errors from the Web source are actually introduced by the extractors. We measure each Web source by the quality of triples extracted by a particular extractor; it turns out we often obtain very different quality measures when we use different extractors. (Here we consider an extractor for a Web source only if it extracts at least 5 triples from that source.) As shown in Figure 5, for a Web page the difference between the accuracy of the best extractor and that of the worst one is 0.32 on average, and above 0.5 for 21% of the Web pages.
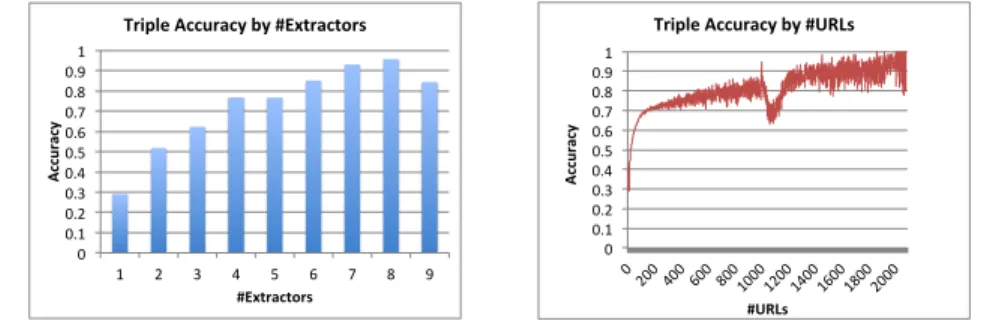
Finally, as shown in Figures 6-7, the more Web sources from which we extract a triple, or the more extractors that extract a triple, the more likely the triple is true. But there can be exceptions: in Figure 6 there is a big drop when the number of extractors increases from 8 to 9, mainly because of correlations between the extrac-tors; in Figure 7 the curve fluctuates and there is a big drop when
the number of sources is in[1K,1.1K), mainly because of
com-mon errors by the same extractor on many different sources. On the other hand, triples that lack significant support can still have a good chance to be true: the majority of the triples (75%) are ex-tracted by a single extractor and their accuracy is nearly 30%; half of the triples (51%) are extracted from a single Web page and their accuracy is also nearly 30%.
3.2.2
Knowledge fusion
The many errors in the extracted candidate triples call for a strat-egy that can automatically decide the correctness for each triple; that is, whether the triple is consistent with the real world. Instead of making binary decisions and discarding the triples that are deter-mined to be false, we wish to output for each triple a truthfulness probability between 0 and 1. We can use such probabilistic knowl-edge in three ways. For the triples with very high probabilities, we can trust them and use them directly in applications. For the triples with very low probabilities, we can feed them to extraction systems as negative training examples. The triples with medium probabili-ties can be used as input to active learning strategies. Motivated by this, we now formally define the knowledge fusion problem.
DEFINITION3.1 (KNOWLEDGE FUSION). Given a set of
ex-tracted knowledge triples, each associated with provenance infor-mation such as the extractor and the Web source,knowledge fusion
computes for each unique triple the probability that it is true. 2
Compared with data fusion, knowledge fusion raises three chal-lenges. First, recall that data fusion takes as input a two-dimensional data matrix; in contrast, the input of knowledge fusion is three-dimensional (Figure 1(b)). The additional dimension represents ex-tractors, so each cell in the matrix represents what the correspond-ing extractor extracts from the correspondcorrespond-ing Web source on the corresponding data item. In other words, a triple is not necessarily what is provided by a source, but what is extracted by an extractor from the source. Errors can creep in at every stage in this process, not only from the Web sources, but also from triple identification, entity linkage, and predicate linkage by the extractors.
Second, recall that data fusion makes a binary decision on which value is true for a data item; in contrast, the output of knowledge fusion is a truthfulness probability for each triple. We wish the predicted probability to truly reflect the likelihood that the triple is
true. A basic requirement ismonotonicity: a triple with a higher
predicted probability should be more likely to be true than a triple with a lower predicted probability. A more demanding requirement iscalibration: among all triples predicted with a certain probability
p, ideally apfraction of them are indeed true.
Third, the scale of knowledge is typically huge. Currently the largest data sets used in data fusion experiments contain up to 170K data sources [27], up to 400K data items, and up to 18M provided triples [20]. Knowledge fusion often needs to handle data that is orders of magnitude larger in every aspect. The overall size of our data is 1.1TB; there are 12 extractors, 1B+ Web sources, 375M data items, 1.6B unique triples, and 6.4B extracted triples.
4.
APPLYING DATA FUSION METHODS TO
KNOWLEDGE FUSION
We apply existing data fusion (DF) methods to solve the knowl-edge fusion (KF) problem. In Section 4.1 we describe our adap-tations. In Section 4.2, we evaluate the quality of these methods, and note several problems. In Section 4.3, we suggest some sim-ple improvements that improve the quality considerably. Finally, in Section 4.4, we analyze the remaining errors made by our system.
4.1
Adapting data fusion techniques
To select from existing DF methods, we adopted three criteria. First, since the goal of KF is to compute for each triple a truth-fulness probability, we select DF methods that can easily derive a meaningful probability. This rules out methods such as [34], which computes a probability close to 1 for every triple, as well as Web-link based methods and IR-based methods, which compute correct-ness scores that do not have a probabilistic interpretation.
Second, since the scale of our data is three orders of magnitude larger than that used in traditional DF, we select methods that can be fairly easily scaled up under a MapReduce based framework [9]. Scaling up some DF methods is non-trivial. For example, relation-based methods reason about every pair or even every subset of data sources; this is prohibitively expensive for the 1B+ Web sources in our data set even with parallelization. Similarly, we have not found an easy way to scale up graphical-model methods.
Third, we focus on methods for which latest studies have shown great promise; for example, [20] has shown the advantages of Bayesian methods over Web-link based and IR-based methods.
This selection process yields three methods: VOTE, ACCU, and
POPACCU. We describe them briefly, and then describe how we
adapt them to the KF problem setting.
VOTE: For each data item, VOTEcounts the sources for each value
and trusts the value with the largest number of sources. VOTE
0 0.05 0.1 0.15 0.2 0.25
0 0-‐.1 .1-‐.2 .2-‐.3 .3-‐.4 .4-‐.5 >.5
Percen
ta
ge o
f Web
p
ages
Accuracy difference Accuracy Difference Between the Best and
the Worst Extractors on A Web Page
Figure 5: For a lot of Web sources extraction quality varies a lot for different extractors.
0 0.1 0.2 0.3 0.4 0.5 0.6 0.7 0.8
0.9 1
1 2 3 4 5 6 7 8 9
Ac
cu
ra
cy
#Extractors Triple Accuracy by #Extractors
Figure 6: Accuracy of triples increases with #Extractors, but there are drops sometimes.
0 0.1 0.2 0.3 0.4 0.5 0.6 0.7 0.8 0.9 1
0
200 400 600 800 1000 1200 1400 1600 1800 2000
Ac
cu
ra
cy
#URLs Triple Accuracy by #URLs
Figure 7: Accuracy of triples increases with #Sources, but there are drops sometimes.
Map each extracted triple
by data item
Compute triple Probability on each data item
Map each extracted triple by provenance
Accuracy eval for each provenance
Converge? Map by triple
Deduplicate & output
N Y
M
M
M R
R
R Stage I
Stage II
Stage III
Figure 8: MapReduce implementation of ACCUand POPACCU.
ACCU: ACCUapplies Bayesian analysis proposed in [11]. For each
sourceS that provides a set of valuesVS, the accuracy ofS is
computed as the average probability for values inVS. For each
data itemDand the set of valuesVDprovided forD, the
proba-bility of a valuev∈VDis computed as itsa posteriorprobability
conditioned on the observed data using Bayesian analysis. ACCU
assumes that (1) for eachDthere is a single true value, (2) there are
Nuniformly distributed false values, and (3) the sources are
inde-pendent of each other. We start with a default accuracyAfor each
source and iteratively compute value probability and source
accu-racy. By default we setN = 100andA= 0.8. For lack of space,
we omit the equations and refer our readers to [11] for details.
POPACCU: POPACCU [14] extends ACCU by removing the
as-sumption that wrong values are uniformly distributed; instead, it computes the distribution from real data and plugs it in to the Bayesian
analysis. It is proved in [14] that POPACCU is monotonic in the
sense that adding a data source would not decrease the quality of data fusion under the assumption that all sources and data items are
independent; it is also empirically shown in [14, 20] that POPACCU
is more robust than ACCUin case there exists copying between the
sources, because copied false values may be considered aspopular
false values.
Adaptations:We adapt the data fusion methods in three ways to
solve the knowledge fusion problem.
First, recall that the input of DF methods is a two-dimensional data matrix with values provided by each source on each data item, whereas the input of KF methods is three-dimensional, containing the values extracted by each extractor from each source on each data item. We reduce the dimension of the KF input by considering
each (Extractor, URL) pair as a data source, which we call a
prove-nance. Having a large number of provenances indicates either the triple is supported by many Web sources, or the triple is extracted by many different extractors; both presumably would increase our confidence in the correctness of the triple. We describe shortly how we may vary the granularity of the provenance.
Second, recall that the output of the DF methods consists of bi-nary decisions on each provided value, whereas the output of the
KF methods consists of truthfulness probabilities for each triple.
For ACCUand POPACCU, we simply take the probability computed
by the Bayesian analysis [14]. For VOTE, we assign a probability
as follows: if a data itemD = (s, p)hasnprovenances in total
and a tripleT = (s, p, o)hasmprovenances, the probability of
T isp(T) = mn. Note that all three methods assume single-truth:
the probabilities of different triples associated with the same data item sum up to 1. This assumption is theoretically invalid for non-functional predicates, but in practice it performs surprisingly well, as we discuss shortly.
Third, we scale up the three methods using a MapReduce-based framework: Figure 8 shows the architecture for knowledge fusion. There are three stages; each stage is a MapReduce process and so is
performed in a parallel fashion. In the first stage, theMapstep takes
as input theextracted triples, each being a (triple, provenance) pair,
and partitions them by the associated data item; theReducestep
ap-plies Bayesian inference on all triples provided for the same data item and computes the probability for each of them. In the second
stage, theMapstep partitions each extracted triple, where the triple
is already assigned a probability, by its provenance; theReduce
step computes the accuracy of each provenance from its triples. We iterate the first two stages until convergence. The third stage
outputs the results: theMapstep partitions extracted triples by the
triple and theReducestep removes duplicates from different
prove-nances. Note that VOTEdoes not need the iterations and has only
Stage I and Stage III.
We use two additional strategies to speed up execution. First, re-call that we observe a big skew in the data: the number of extracted triples for each data item ranges from 1 to 2.7M, and the number of triples a provenance contributes ranges from 1 to 50K. To speed
up computation at each reducer, whenever applicable, we sampleL
triples (by default we setL= 1M) each time instead of using all
triples for Bayesian analysis or source accuracy evaluation. Sec-ond, there might be many rounds before convergence and even a
single round can take a long time. We force termination afterR
rounds (by default we setR= 5). We examine the effect of these
choices on performance shortly.
4.2
Experimental evaluation
Metrics:We use two evaluation metrics: the area under the
precision-recall curve, and a measure of how well-calibrated our probability estimates are. We describe both of these in more detail next.
PR curve:We order the triples in decreasing order of the predicted probability. As we gradually add new triples, we plot the precision versus the recall of the considered triples. A good method should have a high precision as we fix recall, and have a high recall as we fix precision. We summarize using the area under the curve, which we call AUC-PR.
Note that PR-curves show whether the predicted probabilities are
sys-0 0.1 0.2 0.3 0.4 0.5 0.6 0.7 0.8 0.9 1
0 0.1 0.2 0.3 0.4 0.5 0.6 0.7 0.8 0.9 1
Re
al
p
ro
ba
bi
lit
y
(a
cc
ur
ac
y)
Predicted probability Calibra4on Curves for Basic Models
Ideal PopAccu Accu Vote
Dev. WDev. AUC-PR
VOTE .047 .061 .489
ACCU .033 .042 .524
POPACCU .020 .037 .499
POPACCU(Only ext) .049 .052 .589
POPACCU(Only src) .024 .039 .528
Figure 9: Among the three basic fusion
meth-ods, POPACCUhas the best probability
cali-bration. The best measures are in bold.
0 0.1 0.2 0.3 0.4 0.5 0.6 0.7 0.8 0.9 1
0 0.1 0.2 0.3 0.4 0.5 0.6 0.7 0.8 0.9 1
Re
al
p
ro
ba
bi
lit
y
(a
cc
ur
ac
y)
Predicted probability Calibra4on Curves for Provenance
Granularity (Extractor, URL) (Extractor, Site) (Extractor, Site, Predicate) (Extractor, Site, Predicate, Pa?ern)
Dev. WDev. AUC-PR
(Extractor, URL) .020 .037 .499
(Extractor, Site) .023 .042 .514
(Ext, Site, Pred) .017 .033 .525
(Ext, Site, Pred, Pattern) .012 .032 .522
Figure 10: The granularity of (Extractor, Site, Predicate, Pattern) for provenances ob-tains the best probability calibration.
0 0.1 0.2 0.3 0.4 0.5 0.6 0.7 0.8 0.9 1
0 0.1 0.2 0.3 0.4 0.5 0.6 0.7 0.8 0.9 1
Re
al
p
ro
ba
bi
lit
y
(a
cc
ur
ac
y)
Predicted probability Calibra4on Curves for Provenance
Selec4on
NoFilter ByCov ByCovAccu (0.1)
Dev. WDev. AUC-PR
NOFILTERING .020 .037 .499
BYCOV .016 .038 .511
BYCOVACCU(θ=.1) .010 .035 .495
BYCOVACCU(θ=.3) .017 .038 .516
BYCOVACCU(θ=.5) .018 .038 .520
BYCOVACCU(θ=.7) .024 .039 .518
BYCOVACCU(θ=.9) .042 .038 .510
Figure 11: Filtering sources by coverage and accuracy improves probability calibration. tems order the triples in the same way, even if one predicts
proba-bilities in[0,0.1](implying that all triples are likely to be false) and
the other predicts probabilities in[0.9,1](implying that all triples
are likely to be true), we would observe the same PR-curve. For this reason, we also consider an additional metric, described next.
Calibration curve: We plot the predicted probability versus the real probability. To compute the real probability, we divide the triples
intol+ 1buckets: thei-th (0 ≤ i < l) bucket contains triples
with predicted probability in[i
l,
i+1
l ), and the (l+ 1)-th bucket
contains triples with probability 1. We usel= 20when we report
our results. We compute the real probability for each bucket as the percentage of true triples in the bucket compared with our gold standard. Ideally the predicted probability should match the real
probability so the ideal curve is a diagonal line from(0,0)to(1,1).
Note that such curves have also been plotted in [24, 33].
We summarize the calibration using two measures. The
devia-tioncomputes the average square loss between predicted
probabil-ities and real probabilprobabil-ities for each bucket. Theweighted deviation
is the same except that it weighs each bucket by the number of triples in the bucket, thus essentially computes the average square loss of each predicted probability.
Results: We evaluate the three methods on our extracted
knowl-edge. Figure 9 plots the calibration curves and summarizes the de-viation, weighted dede-viation, and AUC-PR for each method. Among
them, POPACCU has the lowest weighted deviation, then comes
ACCU, and both are much better than VOTE. In terms of PR-curves,
ACCUhas the highest AUC-PR, while VOTEhas the lowest.
VOTE has two inherent problems. First, except a few points,
it under-estimates (i.e., the predicted probability is lower than the
real probability) most of the time for true triples. To understand why, consider an example data item for which there are four unique triples, one extracted from 7 provenances while each of the others
extracted from 1 provenance. VOTEwould compute a probability
of 107 = 0.7for the first triple, although intuitively the likelihood
for this triple to be true is much higher. Second, VOTEfalls short
when there is only 1 or 2 provenances for a data item, where it would compute a probability of 1 or 0.5. However, intuitively this is often the case when the extractions go wrongly and as shown in
Figure 9, the real accuracy for triples with predicted probability of 1 or 0.5 is much lower (0.56 and 0.37 respectively).
The calibration curves for ACCUand POPACCUare better, but
they reveal two major problems. First, we observe that they
over-estimate for triples with a high predicted probability (≥ 0.4), so
there are a lot of false positives; they also underestimate for triples with a low predicted probability, so there are a lot of false negatives.
Second, we observe that the calibration curve for POPACCUis
not smooth: there are valleys when the predicted probability is 0.8 or 0.5. Such probabilities are mostly predicted when small prove-nances exist, which is common in practice. As an example, con-sider the case when a data item is extracted from a single prove-nance (so there is no conflict) and that proveprove-nance contributes a single triple. Recall that initially we assign a default accuracy of 0.8 for each provenance; over the iterations that single triple would carry this default accuracy as its probability, reinforcing the default
accuracy for that provenance. Note that ACCUcan also be biased in
such situations, but we do not observe obvious valleys in its curve.
This is because ACCUassumes that there areNfalse triples in the
domain for each data item, so the computed probabilities would not stick to a particular value.
Finally, we also show in Figure 9 the results of applying POPACCU
when we consider only extractor patterns or only URLs instead of (Extractor, URL) pairs. Considering only extractor patterns under-estimates most of the time as it may compute a low probability for triples extracted by one pattern but from many sources (using ex-tractors instead of patterns exacerbates the problem). Considering only sources over-estimates more when the predicted probability is high, and under-estimates more when the predicted probability is low, as it ignores the supports from different extractors.
4.3
Improving the existing methods
We next describe a set of refinements that improve ACCUand
POPACCU. We show our results for POPACCU, since it has a lower
deviation than ACCU, but we have similar observations on ACCU.
For each refinement, we compare it with the default setting; we show in the end the result of putting all refinements together.
0 0.1 0.2 0.3 0.4 0.5 0.6 0.7 0.8 0.9 1
0 0.1 0.2 0.3 0.4 0.5 0.6 0.7 0.8 0.9 1
Re
al
p
ro
ba
bi
lit
y
(a
cc
ur
ac
y)
Predicted probability Calibra4on Curves for Leveraging the
Gold Standard
DefaultAccu InitAccuByFreebase
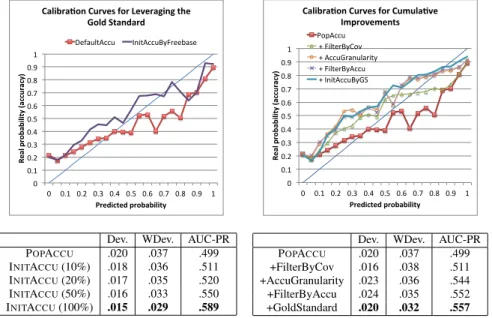
Dev. WDev. AUC-PR POPACCU .020 .037 .499 INITACCU(10%) .018 .036 .511 INITACCU(20%) .017 .035 .520 INITACCU(50%) .016 .033 .550 INITACCU(100%) .015 .029 .589 Figure 12: Leveraging the gold standard for initial accuracy computation improves prob-ability calibration.
0 0.1 0.2 0.3 0.4 0.5 0.6 0.7 0.8 0.9 1
0 0.1 0.2 0.3 0.4 0.5 0.6 0.7 0.8 0.9 1
Re
al
p
ro
ba
bi
lit
y
(a
cc
ur
ac
y)
Predicted probability
Calibra4on Curves for Cumula4ve Improvements PopAccu
+ FilterByCov + AccuGranularity + FilterByAccu + InitAccuByGS
Dev. WDev. AUC-PR POPACCU .020 .037 .499 +FilterByCov .016 .038 .511 +AccuGranularity .023 .036 .544 +FilterByAccu .024 .035 .552 +GoldStandard .020 .032 .557 Figure 13: The refinements altogether can significantly improve probability calibration and AUC-PR.
0 0.01 0.02 0.03 0.04 0.05
1 2 3 4 5
Wei
gh
ted
d
evi
a+o
n
Round
Devia+on Round by Round
DefaultAccu InitAccuByFreebase
Dev. WDev. AUC-PR L=1M, R=5 .020 .037 .499 L=1K, R=5 .020 .037 .499 L=1M, R=25 .019 .038 .497
Figure 14: Weighted deviation vs number of iterations for two ways of initializing the
provenance accuracies. SamplingL = 1K
triples in each reducer and terminating in
R= 5rounds does not hurt the results.
The basic models consider an (Extractor, URL) pair as a prove-nance. We can vary the granularity. First, recall that half of the provenances each contributes a single triple; thus, we lack support data to evaluate the quality of such provenances. If we consider the
Web sources at a coarser level, the Website level (i.e., the prefix of
the URL till the first “/”; for example, replacing “en.wikipedia.org/ wiki/Data fusion” with just “en.wikipedia.org”), we would have much more support data for quality evaluation. So the first choice
is betweenpage-levelandsite-level. Second, recall that we observe
very different quality for different predicates; thus, we may wish to evaluate quality for each predicate instead of the whole Webpage
or Website. So the second choice is betweenpredicate-levelor all
triples. Third, recall that we observe very different quality of differ-ent patterns for the same extractor; thus, we may wish to evaluate quality for each pattern instead of the whole extractor. So the third
choice is betweenpattern-levelandextractor-level.
Figure 10 shows the calibration curves and various measures for applying different granularities. We observe that using site-level instead of source-level has two effects. On the one hand, for triples
whose predicted probability falls in[.65,1], the predicted
proba-bility is much closer to the real probaproba-bility; this is because there are much fewer provenances for which we lack extracted triples for accuracy evaluation. On the other hand, for triples whose predicted
probability falls between[.05, .65), the predicted probability is
far-ther away from the real probability; this is partially because even triples extracted from the same Website can still vary in quality, but now we cannot distinguish them.
Using the predicate, as well as the extractor and the Website, fur-ther improves the calibration (dragging the calibration curve closer to the ideal diagonal line), since the finer-granularity enables distin-guishing quality of triples with different predicates from the same Website. We note however that applying predicate-level granularity together with URL-level granularity would hurt the results, because we then have even more provenances that contribute too few triples for effective accuracy evaluation.
Appending the pattern, in addition to site-level and predicate-level granularity, further improves the results, but only slightly. This is because some extractors only have a single pattern, and of-ten a pattern extracts triples for just a single predicate. Overall, comparing with the (Extractor, URL) granularity, using (Extractor,
site, predicate, pattern) reduces weighted deviation by 13% and in-creases AUC-PR by 5%.
4.3.2
Provenance selection
Recent work [14] has shown that ignoring low-quality sources can often obtain better results in data fusion than considering every source. Here we consider filtering provenances by two criteria — the coverage and the accuracy — which we define below.
As we have seen, when a provenance contributes a single triple, we cannot effectively evaluate its accuracy and this may hurt the probability we predict. We revise our models in two ways to filter provenances for which we cannot compute an accuracy other than the default accuracy. (1) In the first round, when all provenances have the same default accuracy, we compute triple probabilities for data items where at least one triple is extracted more than once, and then re-evaluate accuracy for each provenance. (2) In later rounds, we ignore provenances for which we still use the default accuracy. Figure 11 shows that this modification considerably smooths the calibration curve; on the other hand, for 8.2% of the triples, we cannot predict a probability because the provenances are filtered.
We also filter provenances of low accuracy and revise our
mod-els as follows. (1) Given a threshold on accuracyθ, we ignore a
provenance if its accuracy is belowθ. (2) For certain data items we
may lose all provenances so cannot predict the probability for any triple; as a compensation, for such cases we set the probability of each triple as the average accuracy of its provenances. In Figure 11
we observe that settingθ=.1would significantly improve the
cal-ibration curve, reducing the weighted deviation by 5%. Setting a
higherθ can continue increasing AUC-PR, but may not improve
the calibration curve any more, since for more and more triples we compute the probability as the average accuracy of the provenances instead of applying the principled Bayesian analysis. Starting from θ > .5, even the AUC-PR measure decreases.
4.3.3
Leveraging the gold standard
There are already high-quality knowledge bases such as
Free-baseand we can leverage them in predicting the correctness of
newly extracted knowledge triples. Recall that we initialize the ac-curacy of a provenance as a default value .8; instead, we compare
0 0.1 0.2 0.3 0.4 0.5 0.6 0.7 0.8 0.9 1
0 0.2 0.4 0.6 0.8 1
Preci
si
on
Recall
PR-‐Curves for Various Models
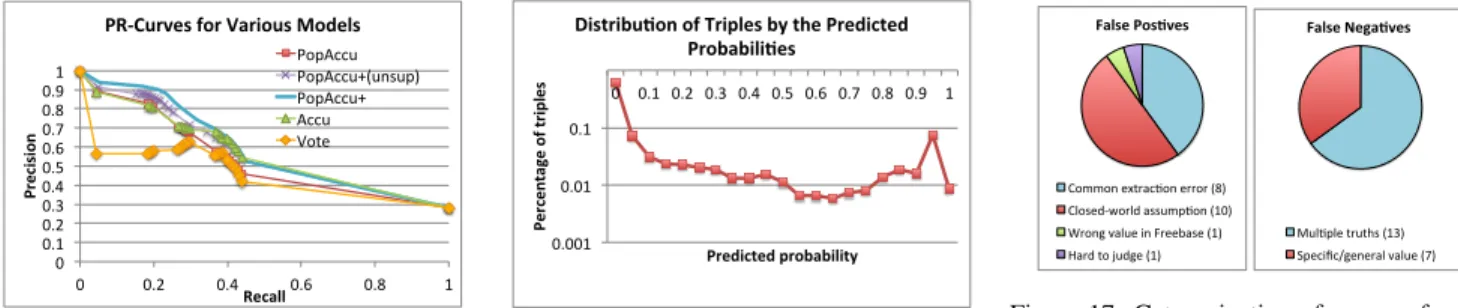
PopAccu PopAccu+(unsup) PopAccu+ Accu Vote
Figure 15: The PR-curve for POPACCU+ has
the best shape.
0.001 0.01 0.1
0 0.1 0.2 0.3 0.4 0.5 0.6 0.7 0.8 0.9 1
Percen
ta
ge o
f t
rip
les
Predicted probability Distribu5on of Triples by the Predicted
Probabili5es
Figure 16: More than 70% of the triples have a very low predicted probability.
False Pos)ves
Common extrac,on error (8) Closed-‐world assump,on (10) Wrong value in Freebase (1) Hard to judge (1)
False Nega)ves
Mul$ple truths (13) Specific/general value (7)
Figure 17: Categorization of reasons for the
errors by POPACCU+ for a sample of 20
ex-tractions. local closed-world assumption, and initialize the accuracy as the
percentage of true triples.
Figure 12 shows that this change can improve the results a lot: it decreases the weighted deviation by 21% and increases AUC-PR by 18%. In addition, when we sample only a portion of the gold standard, we observe that the higher sample rate, the better results; we obtain the best results when we use the full gold standard.
4.3.4
Putting them all together
We now apply all the refinements and make the following changes one by one: I. filter provenances by coverage; II. change prove-nance granularity to (Extractor, pattern, site, predicate); III. filter provenances by accuracy (here we observe the best results when
we setθ=.5); and IV. initialize source accuracy by the gold
stan-dard. After the first three changes the algorithm is still
unsuper-vised, which we call POPACCU+unsup; with the fourth change the
algorithm becomes semi-supervised, which we call POPACCU+.
Figure 13 shows the calibration curve and the measures for each method, and Figure 15 shows the corresponding PR-curves. The changes altogether reduce the weighted deviation by 13%, and in-creases the AUC-PR by 12%. We observe that Change I can smoothen the calibration curve a lot. Change II not only improves the cali-bration, but also increases the percentage of the triples for which we predict probabilities from 91.8% to 99.4%. Change III further improves the results, but very slightly. Change IV also further
im-proves the results, mainly for triples of very high ([.85,1]) or very
low ([0, .15)) predicted probabilities, and smoothes out for triples
with predicted probabilities in the range of[.45, .6). However, with
the improvements from Changes I-III, the help from Change IV is limited. We note that only applying Change IV can obtain a lower deviation and a higher AUC-PR, as it overfits when we have fine-grained provenances; however, the calibration curve is not smooth because of the overfitting (see Figure 12).
Figure 16 shows the distribution of the predicted probabilities for
POPACCU+. We observe that most of the triples have very high or
very low probabilities: 70% triples are predicted with a probability of lower than 0.1, while 10% triples are predicted with a probability of over 0.9.
4.3.5
Speeding up execution
Finally, we evaluate the choices we have made in speeding up
execution. Recall that we sampleL = 1M triples for each data
item in triple-probability computation and for each provenance in accuracy evaluation. Not applying such sampling would cause
out-of-memory errors, while samplingL = 1Ktriples actually leads
to very similar performance measures (Figure 14).
Recall also that we force termination afterR = 5rounds.
Fig-ure 14 shows that if we set default accuracy initially for each prove-nance, the predicted triple probabilities would change a lot from the first round to the second, but stay fairly stable afterwards. If we
initialize provenance accuracy by the gold standard, even the
differ-ence from the first two rounds is small. Terminating afterR= 25
rounds obtains very similar performance measures.
4.4
Error analysis
Although POPACCU+ improves a lot over POPACCU and has
reasonably well calibrated curves, there is still a lot of space for
improvement. Among the triples that POPACCU+ predicts to be
true with a fairly high confidence (predicting a probability above 0.9), the accuracy is 0.94, so there are still quite some false pos-itives. On the other hand, recall that 30% of the extracted triples
are correct, but POPACCU+ only predicts a probability over 0.5 for
18% of them, so there are still a lot of false negatives.
To gain insights on how we can further improve knowledge
fu-sion, we next take a closer look at the errors made by POPACCU+.
We randomly selected 20 false positives (i.e., triples for which we
predict a probability of 1.0 but the gold standard says are false),
and 20 false negatives (i.e., triples for which we predict a
probabil-ity of 0.0 but the gold standard says are true). We manually checked the Webpages from which each triple is extracted and decided the reason for the “mistakes”, summarized in Figure 17.
Of the 20 false positives, 8 (40%) are caused by common extrac-tion errors made by one or two extractors on a lot of Webpages: 3 are triple identification errors, 3 are entity linkage errors, and 2 are predicate linkage errors. Of the remaining false positives, 10 (50%) actually are not errors, but are classified as such due to the local closed world assumption. Specifically, for 5 triples
POPACCU+ finds additional correct values that were not in
Free-base; for 3 triples POPACCU+ chooses a more specific (but correct)
value (e.g., “New York City”’ is a more specific value than “USA”);
and for 2 triples POPACCU+ chooses a more general (but correct)
value. One false positive is due toFreebasehaving an obviously
incorrect value. And finally, one false positive is hard to judge: the extracted value is mentioned on a lot of Webpages but contradicts
the value inFreebase; both values seem plausible.
There are two major reasons for false negatives. For 13 (65%)
triples there are multiple truths for the associated data item; POPACCU+
computes a high probability for only one of them because of its single-truth assumption. For 7 (35%) triples the values are
hier-archical; POPACCU+ chooses one value under the single-truth
as-sumption but predicts a low probability for a more specific or a more general value. We note that for some false positives, presum-ably there can be a false negative if the truth is extracted, since the probabilities for all triples associated with the same data item sum up to 1. None of them appears in our sample though, indicating that the percentage is low.
5.
FUTURE DIRECTIONS
Although our experimental results suggest that small modifica-tions to existing DF methods can lead to reasonable results for the
0 0.2 0.4 0.6 0.8 1
0 500 1000 1500 2000 2500
Ac
cu
ra
cy
o
f t
rip
le
s
#Provenances Accuracy of Triples by #Provenances and
#Extractors
By any num of extractors By 1 extractor By >=8 extractors
Figure 18: Fixing #provenances, triples from more extractors are more likely to be true.
0 5 10 15 20 25 30 35
-‐0.15 -‐0.1 -‐0.05 0
#P
ai
rs
o
f e
xt
ra
ct
or
s
Kappa measure
Distribu4on of Kappa Measures
Extractors for the same type of Web contents Extractors for the different types of Web contents
Figure 19: The Kappa measure indicates that a lot of extractors are anti-correlated.
0 0.1 0.2 0.3 0.4 0.5 0.6 0.7 0.8
0 1 2 3 4 5 >5
Percen
ta
ge o
f d
at
a i
tems wi
th
th
e
sp
ec
ifi
c
#T
ru
th
s
#Truths Distribu9ons of #Truths for a Data Item
Figure 20: We know multiple true triples in the gold standard for very few data items. KF task, there is still much room for improvement. However,
im-proving the quality will require more radical changes to the basic assumptions made by DF methods. We sketch some of these future directions in this section.
1. Distinguishing mistakes from extractors and from
sources
One key assumption that DF techniques make is that a value pro-vided by a large number of data sources is more likely to be true, unless copying exists. This assumption is verified on Deep Web data [20], but breaks on extracted knowledge when we consider an (Extractor, URL) pair (or provenances of different granularities) as a source. Recall that among the 20 randomly selected false posi-tives in our error analysis, 8 of them are genuine errors and they all come from common extraction errors by one or two
extrac-tors. POPACCU+ fails to detect such extraction errors when they
are prevalent.
To illustrate this, we plot in Figure 18 the accuracy of triples by the number of provenances. Because of possible common extrac-tion errors, having a lot of provenances is not necessarily a strong signal for correctness: the triples with 100 provenances have an ac-curacy of only 0.6, and the triples with 1000 provenances have an accuracy of only 0.75. However, for triples with the same number of provenances, those extracted by at least 8 extractors have a much higher accuracy (on average 70% higher) than those extracted by a single extractor. This important signal, unfortunately, is buried when we simply represent the provenance as the cross product of the Web source and the extractor.
A better approach would be to distinguish mistakes made by ex-tractors and erroneous information provided by Web sources. This would enable us to evaluate the quality of the sources and the qual-ity of the extractors independently. Then, we could identify possi-ble mistakes by the same extractor on many different Web sources, and avoid being biased by a false triple provided by only a couple of sources but extracted by many different extractors.
2. Identifying complex correlations between extractors
and between sources
Both ACCUand POPACCUassume independence between data sources.
In our adaptations a data source is an (Extractor, URL) pair, so
ob-viously the sources arenotindependent. Existing DF works have
discussed how to detect copying between data sources by find-ing common mistakes, since independent sources are less likely to make a lot of common mistakes [2, 10, 11, 12, 21]. Such tech-niques can fall short in KF for two reasons. First and most impor-tantly, we have billions of Web sources, so the proposed techniques that reason about every pair of sources do not scale. Second, for
Web sources we have onlyextracteddata instead of knowing the
trulyprovideddata, so the proposed models can wrongly consider
common extraction errors as evidence of copying.
Table 3: The majority of the knowledge triples have non-functional predicates.
Type Predicates Data items Triples Accuracy
Functional 28% 24% 32% 0.18
Non-functional 72% 76% 68% 0.25
In addition, for extractors the relationships can be much richer: instead of copying, there can be correlation or anti-correlation. To illustrate such rich relationships, we plot in Figure 19 the
distribu-tion of theKappa measure[15] of every pair of extractors designed
for the same type of Web contents (e.g., TXT, DOM) and those for
different types of Web contents. The Kappa measure of two sets of
extracted triplesT1andT2with respect to the overall setKBis
defined as follows.
κ= |T1∩T2| · |KB| − |T1| · |T2|
|KB|2− |T 1| · |T2|
(1) The Kappa measure is considered as a more robust measure than merely measuring the intersection, as it takes into account the in-tersection that can happen even in case of independence. A pos-itive Kappa measure indicates pospos-itive correlation; a negative one indicates negative correlation; and one close to 0 indicates dence. Among the 66 pairs of extractors, 53% of them are indepen-dent. Five pairs of sources are positively correlated (but the kappa measures are very close to 0), as they apply the same extraction techniques (sometimes only differ in parameter settings) or inves-tigate the same type of Web contents. We observe negative corre-lation on 40% of the pairs; they are often caused by considering different types of Web contents, but sometimes even extractors on the same type of Web contents can be highly anti-correlated when they apply different techniques. Finally, we point out that since a lot of extractors employ the same entity linkage components, they may make common linkage mistakes, even if the Kappa measure indicates independence or anti-correlation. Finding general corre-lations has been studied in [28, 29], but again, it is not clear how to scale the reasoning for billions of sources.
We wish to scale up existing methods such that we can reason about copying between Web sources (recall that for one false posi-tive in our error analysis we are not sure if a wrong fact has spread out) and the rich correlations between extractors.
3. Handling non-functional predicates properly
One big limitation of the DF models implemented in this paper is that they all assume predicates being functional; that is, for each data item the probabilities of different triples add up to 1. This assumption is invalid for the majority of the data items in our ex-tracted knowledge: as shown in Table 3, 72% of the predicates are actually functional and 76% of the data items have non-functional predicates. This assumption is responsible for 65% of the false negatives according to our error analysis.